



Spend Analytics Market
Spend Analytics Market Size, Share, Insights, Competitive Landscape, and Forecast 2026 to 2033
Spend Analytics Market Size and Trend Analysis
How Fast Is the Spend Analytics Market Growing?
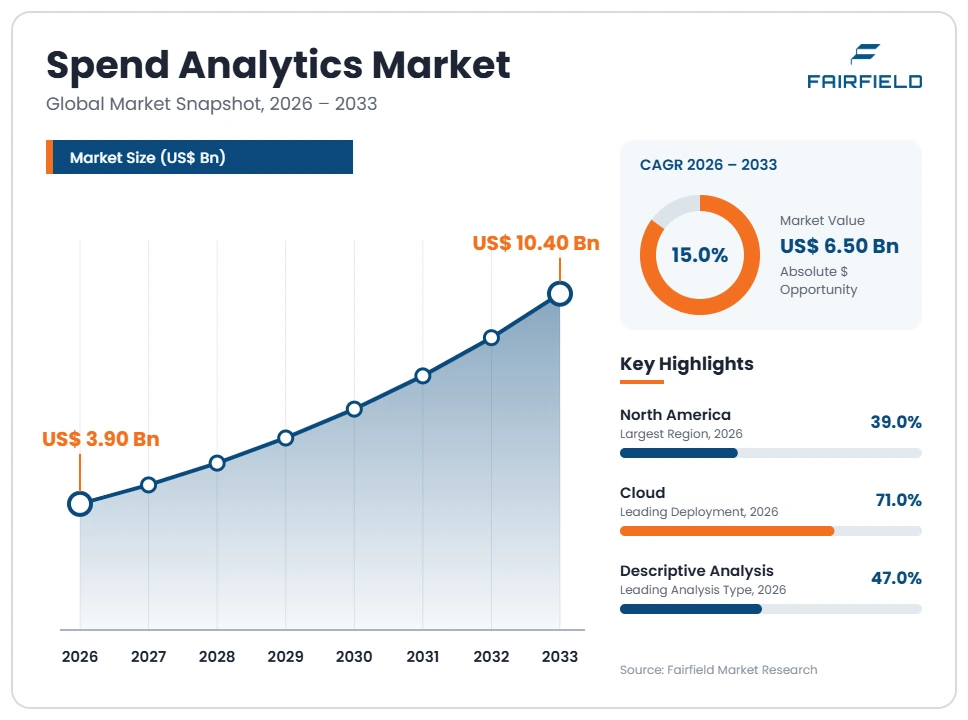
The global spend analytics market size is expected to be valued at US$ 3.90 billion in 2026 and projected to reach US$ 10.40 billion by 2033, growing at a CAGR of 15.0% between 2026 and 2033.
Between 2020 and 2025, the market grew at a CAGR of about 13.2%, as supply chain disruption, inflation, and pressure on margins pushed companies to understand exactly what they buy, from whom, and at what price. Spend analytics software collects purchasing data from ERP systems, invoices, cards, and contracts, cleans and classifies it, and shows where money goes so teams can cut costs and manage suppliers. Three factors now drive growth: the shift to cloud-based spend analytics, the need for procurement analytics that track supplier risk and sustainability, and the rise of AI-powered spend classification that turns messy data into clear categories automatically. The market is shifting toward predictive analytics and prescriptive tools that forecast prices and recommend actions, and toward AI agents that analyze bids. In October 2025, SAP announced next-generation SAP Ariba with embedded analytics and a Joule bid-analysis agent, showing how AI is entering procurement suites.
Key Report Takeaways
- By Type: Software held 68.0% share in 2026, while Service is projected to expand at a 16.2% CAGR through 2033, driven by demand for data cleansing, managed analytics, and procurement consulting among firms lacking in-house skills.
- By Analysis: Descriptive Analysis held 47.0% share in 2026, while Prescriptive Analysis is projected to expand at an 18.4% CAGR through 2033, driven by AI tools that recommend sourcing actions and savings opportunities.
- By Deployment: Cloud held 71.0% share in 2026 and is also projected to expand at a 16.3% CAGR through 2033, driven by subscription pricing, fast deployment, and integration with cloud procurement suites.
- By Region: North America held 39.0% share in 2026, while Asia Pacific is projected to expand at a 17.1% CAGR through 2033, driven by digital procurement adoption in India, China, Japan, and Australia.
Global Spend Analytics Market Trends and Insights
Drivers Impact Analysis
Two drivers carry the strongest influence on spend analytics demand during the forecast period.
| Driver | Impact on CAGR Forecast | Geographic Relevance | Impact Timeline |
| Cost pressure and need for spend visibility | High | Global | Long term (≥4 years) |
| AI and cloud procurement platforms | High | North America, Europe, Asia Pacific | Medium term (2–4 years) |
Cost Pressure Is Driving the Spend Analytics Market
Cost pressure and the need for spend visibility are the strongest driver of the spend analytics market. Companies want to know where every dollar goes.
The mechanism is the link between purchasing and profit. For most companies, buying goods and services makes up a large share of total costs, so small savings have a big impact on margins. Inflation, tariffs, and supply shocks since 2020 have raised costs and made prices volatile. Purchasing data is often spread across many systems, business units, and countries, and it is recorded in different formats. Procurement analytics tools bring this data together, show spending by supplier and category, find duplicate suppliers, and reveal off-contract buying. Finance leaders use the results to negotiate better deals and consolidate suppliers. Boards ask for regular savings reports, which keeps tools in daily use. This direct link to savings makes spend analytics easy to justify.
AI and Cloud Platforms Are Expanding the Spend Analytics Market
AI and cloud procurement platforms are expanding the spend analytics market. New technology makes analysis faster, cheaper, and more accurate.
The cause is the maturing of cloud software and machine learning. AI-powered spend classification can sort millions of invoice lines into categories in hours, a task that once took months of manual work. Cloud-based spend analytics is sold by subscription, needs little IT work, and connects to ERP and procurement suites such as SAP Ariba, Coupa, and Oracle. Generative AI assistants let buyers ask questions in plain language and get charts and answers. AI agents can now compare supplier bids and draft negotiation strategies. These tools bring advanced analysis to mid-sized companies that could not afford it before. Vendors are bundling analytics into broader source-to-pay suites, which widens reach.
Restraints Impact Analysis
Two restraints limit how quickly the spend analytics market grows.
| Restraint | Impact on CAGR Forecast | Geographic Relevance | Impact Timeline |
| Poor data quality and integration complexity | Medium | Global | Medium term (2–4 years) |
| Data security concerns and skills shortages | Medium | Global | Medium term (2–4 years) |
Poor Data Quality Slows the Spend Analytics Market
Poor data quality and integration complexity slow the spend analytics market. Analytics is only as good as the data behind it.
The specific causes are messy records and many separate systems. Large companies often run several ERP systems after mergers, with different supplier names, codes, and currencies. Invoices may lack line-item detail, and purchase card data can be vague. Cleaning and mapping this data takes time and expertise. Projects can stall when IT teams are busy or when data owners in business units do not cooperate. If early results are wrong, users lose trust in the tool. Ongoing data maintenance adds cost. Some companies buy software but never fully deploy it. These problems delay value and slow adoption, especially in complex global firms with many divisions and legacy systems.
Security and Skills Gaps Restrict the Spend Analytics Market
Data security concerns and skills shortages restrict the spend analytics market. Companies must protect sensitive pricing and supplier data.
The underlying causes are risk and talent limits. Spend data reveals contract prices, supplier relationships, and business plans, so companies worry about storing it in the cloud. Regulated industries such as banking, defense, and healthcare face strict data rules, and some governments limit cross-border data transfers. Procurement teams often lack data analysts who can interpret results and turn them into savings. Training buyers to use new tools takes time. Smaller companies may not see enough value to justify the cost. Change management is needed to move teams away from spreadsheets. These factors slow adoption in some sectors and regions. Vendors respond with private cloud options, regional data centers, and simpler interfaces for non-specialist buyers.
Market Opportunities
AI Agents and Prescriptive Analytics Open a Fast-Growth Revenue Pool
AI agents and prescriptive analytics open a fast-growth revenue pool in the spend analytics market. Tools are moving from showing what happened to recommending what to do.
Software vendors with strong AI and data assets can capture this opportunity. Predictive analytics forecast commodity prices, supplier risk, and demand, while prescriptive tools suggest which suppliers to use, when to buy, and how to negotiate. SAP is adding Joule agents to SAP Ariba, and Coupa is building AI on its large community spend dataset. Startups are building autonomous sourcing agents that run simple tenders without human effort. Customers will pay more for tools that deliver measurable savings. Vendors with large benchmark datasets can show customers how their prices compare with peers. Outcome-based pricing tied to savings is also emerging as a sales model.
Supplier Risk and Sustainability Analytics Create a Compliance Revenue Pool
Supplier risk and sustainability analytics create a compliance revenue pool in the spend analytics market. Companies must track who they buy from and the impact of their purchases.
Vendors that combine spend data with supplier intelligence can capture this opportunity. New rules on supply chain due diligence and carbon reporting in Europe require companies to know their suppliers and estimate emissions from purchased goods. Spend data is the starting point for calculating supply chain emissions. Risk tools monitor supplier finances, sanctions, cyber threats, and disruption. Coupa agreed to acquire Scoutbee in October 2025 to strengthen supplier discovery. Procurement analytics that link spend, risk, and sustainability help companies meet rules and build resilience. Tariff changes and trade restrictions add demand for tools that map spend by supplier country and model the cost of switching suppliers.
Segment Analysis
- By Type: Software Leads While Service Grows Fastest
Software held 68.0% share in 2026. Spend analytics software includes data connectors, classification engines, dashboards, and reports, sold standalone or within procurement suites. SAP, Coupa, Oracle, IBM, GEP, Sievo, and Zip offer platforms used by procurement and finance teams worldwide.
Service is the fastest-growing type, expanding at a 16.2% CAGR through 2033. Many companies lack the skills to clean data, build category taxonomies, and turn results into savings, so they buy implementation, managed analytics, and consulting services. Services also help integrate data from many ERP systems after mergers. For the market, service growth deepens customer relationships and supports software adoption. Consulting firms and specialist providers in India deliver many of these services at lower cost, often bundled with software licenses.
- By Analysis: Descriptive Analysis Leads While Prescriptive Analysis Grows Fastest
Descriptive Analysis held 47.0% share in 2026. Most spend analytics use today shows historical spending by supplier, category, business unit, and region, helping teams find savings and enforce contracts. It is the foundation of any program.
Prescriptive Analysis is the fastest-growing analysis type, expanding at an 18.4% CAGR through 2033. AI tools now recommend actions, such as consolidating suppliers, switching to contracted items, or timing purchases. Predictive analytics forecast prices and risks and sit between descriptive and prescriptive tools. AI-powered spend classification makes all three types more accurate. For the market, prescriptive analysis increases value per user and supports higher pricing for advanced modules. Buyers increasingly expect tools to explain recommendations so procurement teams can trust them.
- By Deployment: Cloud Leads and Grows Fastest
Cloud held 71.0% share in 2026 and is also the fastest-growing deployment model, expanding at a 16.3% CAGR through 2033. Cloud-based spend analytics offers fast setup, automatic updates, lower upfront costs, and easy connection to cloud procurement suites. Vendors release AI features first in the cloud.
On-premises deployment remains in use at some banks, defense contractors, and government bodies with strict data rules. By industry, manufacturing is the largest user, followed by retail, BFSI, IT and telecom, healthcare, and education. For the market, cloud growth supports recurring subscription revenue and faster adoption among mid-sized firms. Manufacturing leads because of large direct material spend and complex supplier networks, while BFSI and healthcare focus on indirect spend, compliance, and vendor risk.
Geography Analysis
- Which Region Is Leading the Spend Analytics Market?
North America is leading the spend analytics market with a 39.0% share in 2026. The United States has many large companies with complex supply chains, mature procurement teams, and high cloud adoption. Coupa, Oracle, IBM, Zip, and GEP are based in the region, and SAP has a large customer base. Tariff changes in 2025 pushed companies to analyze supplier exposure by country. Canada adds demand from public sector and resource companies. Key barriers include data integration complexity across many ERP systems. One change shaping the region is AI agents in sourcing, which automate bid comparison and simple tenders.
- Europe Builds the Spend Analytics Market Through Compliance and Procurement Maturity
Europe is a major spend analytics market. Germany, the United Kingdom, France, the Netherlands, and Finland have mature procurement functions. SAP in Germany and Sievo in Finland are key vendors. Supply chain due diligence and sustainability reporting rules push companies to understand their suppliers and estimate emissions from purchases. Public sector bodies use analytics to manage tenders. Procurement analytics also support compliance with public procurement directives and supplier payment rules. Key barriers include data protection rules and limits on transferring data outside the region. One opportunity is sustainability analytics that estimate emissions from purchased goods and services.
- Which Region Is Growing Fastest in the Spend Analytics Market?
Asia Pacific is growing fastest in the spend analytics market at a 17.1% CAGR through 2033. India has fast-growing companies adopting digital procurement and a large pool of analytics service providers. China, Japan, South Korea, and Australia are investing in cloud procurement. Manufacturers across the region use analytics to manage complex supplier networks. Key barriers include data residency rules and fragmented systems. One change shaping the region is cloud adoption by mid-sized firms. Cloud-based spend analytics with local data centers helps vendors meet residency rules in India, China, and Australia, and global capability centers in India run analytics for multinational companies.
- Latin America Grows the Spend Analytics Market Through Digital Procurement
Latin America is a growing spend analytics market. Brazil, Mexico, Chile, and Colombia have large companies in mining, retail, and manufacturing that are digitizing procurement. Electronic invoicing rules in Brazil and Mexico create cleaner data. Currency swings make cost control important. Mining firms in Chile and Peru use analytics to manage large equipment and service contracts, and retailers in Mexico track supplier costs closely. Key barriers include limited budgets, skills shortages, and fragmented legacy systems. One opportunity is cloud tools for mid-sized firms, offered through local partners with Spanish and Portuguese support and connections to electronic invoice data.
- Middle East & Africa Expands the Spend Analytics Market Through Transformation Programs
Middle East & Africa is an emerging spend analytics market. Saudi Arabia and the United Arab Emirates are digitizing government and corporate procurement under national transformation programs, and local content rules require spend tracking. South Africa has large mining and retail firms using analytics. Large state-linked companies in energy, construction, and telecom manage huge supplier bases and invest in modern procurement suites. Qatar and Egypt are also digitizing public tenders. Key barriers include skills shortages and limited data quality in legacy systems. One opportunity is government procurement, where analytics can show savings and track local content targets across ministries and state companies.
Competitive Landscape
The spend analytics market is moderately concentrated. SAP, Coupa, and Oracle lead through procurement suites with built-in analytics, while IBM, GEP, Sievo, Zip, JAGGAER, and Ivalua offer specialist or suite-based tools. Microsoft, Salesforce, SAS, and Qlik provide general analytics platforms that companies use for spend analysis.
Companies compete on data classification accuracy, AI features, benchmark data, integration with ERP systems, ease of use, and price. Suite vendors benefit from owning purchasing transactions. Specialists win where companies run several ERP systems, because they can combine and clean data from many sources. General analytics platforms are popular with companies that build their own dashboards. Service partners and consulting firms influence many buying decisions, and benchmark data is becoming a key differentiator.
Strategic moves show how competition is changing. In October 2024, Zip raised US$ 190 million in Series D funding at a US$ 2.2 billion valuation to expand its procurement orchestration platform. In October 2025, SAP announced next-generation SAP Ariba with embedded analytics and AI agents. In October 2025, Coupa agreed to acquire Scoutbee. These moves show competition shifting toward AI agents and supplier intelligence.
Three themes shape vendor strategy. First, companies are adding AI agents and assistants. Second, they are buying supplier data and risk intelligence companies. Third, they are targeting mid-sized firms with simpler, faster cloud products. Vendors that combine clean data, trusted AI, and measurable savings are best placed to win share.
Recent Industry Developments
- October 2025: SAP announced next-generation SAP Ariba with embedded analytics and a Joule bid-analysis agent, rolling out from Q1 2026 – brings AI agents into procurement analytics.
- October 2025: Coupa agreed to acquire Scoutbee, an AI-driven supplier discovery platform – strengthens supplier intelligence within spend management.
- October 2024: Zip raised US$ 190 million in Series D funding at a US$ 2.2 billion valuation – funds expansion of AI procurement orchestration.
Companies Covered in the Report
- SAP
- Coupa
- Oracle
- IBM
- GEP
- Sievo
- Zip
- JAGGAER
- Ivalua
- Microsoft
- SAS Institute
- Qlik
Spend Analytics Market Report Scope
| Metric | Value |
| Study Period | 2020–2033 |
| Market Size 2026 | US$ 3.90 Billion |
| Market Size 2033 | US$ 10.40 Billion |
| CAGR 2026–2033 | 15.0% |
| Absolute Dollar Opportunity | US$ 6.50 Billion |
| Largest Market | North America |
| Fastest-Growing Market | Asia Pacific |
| Market Concentration | Moderate |
| Major Players | SAP, Coupa, Oracle, IBM, GEP |
Spend Analytics Market Segmentation
Type
- Software
- Service
Analysis
- Descriptive Analysis
- Predictive Analysis
- Prescriptive Analysis
Deployment
- On-premises
- Cloud
Industry
- Manufacturing
- Retail
- BFSI
- IT & Telecom
- Education
- Healthcare
- Others
Regions
- North America
- Europe
- Asia Pacific
- Latin America
- Middle East & Africa
- Executive Summary
- Global Spend Analytics Market Snapshot
- Future Projections
- Key Report Takeaways
- Regional Snapshot
- Market Overview
- Market Definition and Report Scope
- Historical Trends 2020–2025
- Market Dynamics
- Drivers
- Cost Pressure Is Driving the Spend Analytics Market
- AI and Cloud Platforms Are Expanding the Spend Analytics Market
- Restraints
- Poor Data Quality Slows the Spend Analytics Market
- Security and Skills Gaps Restrict the Spend Analytics Market
- Market Opportunities
- AI Agents and Prescriptive Analytics Open a Fast-Growth Revenue Pool
- Supplier Risk and Sustainability Analytics Create a Compliance Revenue Pool
- Drivers
- Global Spend Analytics Market Outlook, 2020-2033
- Global Spend Analytics Market Outlook, by Type, Value (US$ Billion), 2020-2033
- Software
- Service
- Global Spend Analytics Market Outlook, by Analysis, Value (US$ Billion), 2020-2033
- Descriptive Analysis
- Predictive Analysis
- Prescriptive Analysis
- Global Spend Analytics Market Outlook, by Deployment, Value (US$ Billion), 2020-2033
- On-premises
- Cloud
- Global Spend Analytics Market Outlook, by Industry, Value (US$ Billion), 2020-2033
- Manufacturing
- Retail
- BFSI
- IT & Telecom
- Education
- Healthcare
- Others
- Global Spend Analytics Market Outlook, by Region, Value (US$ Billion), 2020-2033
- North America
- Europe
- Asia Pacific
- Latin America
- Middle East & Africa
- Global Spend Analytics Market Outlook, by Type, Value (US$ Billion), 2020-2033
- North America Spend Analytics Market Outlook, 2020-2033
- North America Spend Analytics Market Outlook, by Type, Value (US$ Billion), 2020-2033
- Software
- Service
- North America Spend Analytics Market Outlook, by Analysis, Value (US$ Billion), 2020-2033
- Descriptive Analysis
- Predictive Analysis
- Prescriptive Analysis
- North America Spend Analytics Market Outlook, by Deployment, Value (US$ Billion), 2020-2033
- On-premises
- Cloud
- North America Spend Analytics Market Outlook, by Industry, Value (US$ Billion), 2020-2033
- Manufacturing
- Retail
- BFSI
- IT & Telecom
- Education
- Healthcare
- Others
- North America Spend Analytics Market Outlook, by Country, Value (US$ Billion), 2020-2033
- United States Spend Analytics Market Outlook, by Type, 2020-2033
- United States Spend Analytics Market Outlook, by Analysis, 2020-2033
- United States Spend Analytics Market Outlook, by Deployment, 2020-2033
- United States Spend Analytics Market Outlook, by Industry, 2020-2033
- Canada Spend Analytics Market Outlook, by Type, 2020-2033
- Canada Spend Analytics Market Outlook, by Analysis, 2020-2033
- Canada Spend Analytics Market Outlook, by Deployment, 2020-2033
- Canada Spend Analytics Market Outlook, by Industry, 2020-2033
- North America Spend Analytics Market Outlook, by Type, Value (US$ Billion), 2020-2033
- Europe Spend Analytics Market Outlook, 2020-2033
- Europe Spend Analytics Market Outlook, by Type, Value (US$ Billion), 2020-2033
- Software
- Service
- Europe Spend Analytics Market Outlook, by Analysis, Value (US$ Billion), 2020-2033
- Descriptive Analysis
- Predictive Analysis
- Prescriptive Analysis
- Europe Spend Analytics Market Outlook, by Deployment, Value (US$ Billion), 2020-2033
- On-premises
- Cloud
- Europe Spend Analytics Market Outlook, by Industry, Value (US$ Billion), 2020-2033
- Manufacturing
- Retail
- BFSI
- IT & Telecom
- Education
- Healthcare
- Others
- Europe Spend Analytics Market Outlook, by Country, Value (US$ Billion), 2020-2033
- Germany Spend Analytics Market Outlook, by Type, 2020-2033
- Germany Spend Analytics Market Outlook, by Analysis, 2020-2033
- Germany Spend Analytics Market Outlook, by Deployment, 2020-2033
- Germany Spend Analytics Market Outlook, by Industry, 2020-2033
- United Kingdom Spend Analytics Market Outlook, by Type, 2020-2033
- United Kingdom Spend Analytics Market Outlook, by Analysis, 2020-2033
- United Kingdom Spend Analytics Market Outlook, by Deployment, 2020-2033
- United Kingdom Spend Analytics Market Outlook, by Industry, 2020-2033
- France Spend Analytics Market Outlook, by Type, 2020-2033
- France Spend Analytics Market Outlook, by Analysis, 2020-2033
- France Spend Analytics Market Outlook, by Deployment, 2020-2033
- France Spend Analytics Market Outlook, by Industry, 2020-2033
- Netherlands Spend Analytics Market Outlook, by Type, 2020-2033
- Netherlands Spend Analytics Market Outlook, by Analysis, 2020-2033
- Netherlands Spend Analytics Market Outlook, by Deployment, 2020-2033
- Netherlands Spend Analytics Market Outlook, by Industry, 2020-2033
- Finland Spend Analytics Market Outlook, by Type, 2020-2033
- Finland Spend Analytics Market Outlook, by Analysis, 2020-2033
- Finland Spend Analytics Market Outlook, by Deployment, 2020-2033
- Finland Spend Analytics Market Outlook, by Industry, 2020-2033
- Europe Spend Analytics Market Outlook, by Type, Value (US$ Billion), 2020-2033
- Asia Pacific Spend Analytics Market Outlook, 2020-2033
- Asia Pacific Spend Analytics Market Outlook, by Type, Value (US$ Billion), 2020-2033
- Software
- Service
- Asia Pacific Spend Analytics Market Outlook, by Analysis, Value (US$ Billion), 2020-2033
- Descriptive Analysis
- Predictive Analysis
- Prescriptive Analysis
- Asia Pacific Spend Analytics Market Outlook, by Deployment, Value (US$ Billion), 2020-2033
- On-premises
- Cloud
- Asia Pacific Spend Analytics Market Outlook, by Industry, Value (US$ Billion), 2020-2033
- Manufacturing
- Retail
- BFSI
- IT & Telecom
- Education
- Healthcare
- Others
- Asia Pacific Spend Analytics Market Outlook, by Country, Value (US$ Billion), 2020-2033
- India Spend Analytics Market Outlook, by Type, 2020-2033
- India Spend Analytics Market Outlook, by Analysis, 2020-2033
- India Spend Analytics Market Outlook, by Deployment, 2020-2033
- India Spend Analytics Market Outlook, by Industry, 2020-2033
- China Spend Analytics Market Outlook, by Type, 2020-2033
- China Spend Analytics Market Outlook, by Analysis, 2020-2033
- China Spend Analytics Market Outlook, by Deployment, 2020-2033
- China Spend Analytics Market Outlook, by Industry, 2020-2033
- Japan Spend Analytics Market Outlook, by Type, 2020-2033
- Japan Spend Analytics Market Outlook, by Analysis, 2020-2033
- Japan Spend Analytics Market Outlook, by Deployment, 2020-2033
- Japan Spend Analytics Market Outlook, by Industry, 2020-2033
- South Korea Spend Analytics Market Outlook, by Type, 2020-2033
- South Korea Spend Analytics Market Outlook, by Analysis, 2020-2033
- South Korea Spend Analytics Market Outlook, by Deployment, 2020-2033
- South Korea Spend Analytics Market Outlook, by Industry, 2020-2033
- Australia Spend Analytics Market Outlook, by Type, 2020-2033
- Australia Spend Analytics Market Outlook, by Analysis, 2020-2033
- Australia Spend Analytics Market Outlook, by Deployment, 2020-2033
- Australia Spend Analytics Market Outlook, by Industry, 2020-2033
- Asia Pacific Spend Analytics Market Outlook, by Type, Value (US$ Billion), 2020-2033
- Latin America Spend Analytics Market Outlook, 2020-2033
- Latin America Spend Analytics Market Outlook, by Type, Value (US$ Billion), 2020-2033
- Software
- Service
- Latin America Spend Analytics Market Outlook, by Analysis, Value (US$ Billion), 2020-2033
- Descriptive Analysis
- Predictive Analysis
- Prescriptive Analysis
- Latin America Spend Analytics Market Outlook, by Deployment, Value (US$ Billion), 2020-2033
- On-premises
- Cloud
- Latin America Spend Analytics Market Outlook, by Industry, Value (US$ Billion), 2020-2033
- Manufacturing
- Retail
- BFSI
- IT & Telecom
- Education
- Healthcare
- Others
- Latin America Spend Analytics Market Outlook, by Country, Value (US$ Billion), 2020-2033
- Brazil Spend Analytics Market Outlook, by Type, 2020-2033
- Brazil Spend Analytics Market Outlook, by Analysis, 2020-2033
- Brazil Spend Analytics Market Outlook, by Deployment, 2020-2033
- Brazil Spend Analytics Market Outlook, by Industry, 2020-2033
- Mexico Spend Analytics Market Outlook, by Type, 2020-2033
- Mexico Spend Analytics Market Outlook, by Analysis, 2020-2033
- Mexico Spend Analytics Market Outlook, by Deployment, 2020-2033
- Mexico Spend Analytics Market Outlook, by Industry, 2020-2033
- Chile Spend Analytics Market Outlook, by Type, 2020-2033
- Chile Spend Analytics Market Outlook, by Analysis, 2020-2033
- Chile Spend Analytics Market Outlook, by Deployment, 2020-2033
- Chile Spend Analytics Market Outlook, by Industry, 2020-2033
- Colombia Spend Analytics Market Outlook, by Type, 2020-2033
- Colombia Spend Analytics Market Outlook, by Analysis, 2020-2033
- Colombia Spend Analytics Market Outlook, by Deployment, 2020-2033
- Colombia Spend Analytics Market Outlook, by Industry, 2020-2033
- Peru Spend Analytics Market Outlook, by Type, 2020-2033
- Peru Spend Analytics Market Outlook, by Analysis, 2020-2033
- Peru Spend Analytics Market Outlook, by Deployment, 2020-2033
- Peru Spend Analytics Market Outlook, by Industry, 2020-2033
- Latin America Spend Analytics Market Outlook, by Type, Value (US$ Billion), 2020-2033
- Middle East & Africa Spend Analytics Market Outlook, 2020-2033
- Middle East & Africa Spend Analytics Market Outlook, by Type, Value (US$ Billion), 2020-2033
- Software
- Service
- Middle East & Africa Spend Analytics Market Outlook, by Analysis, Value (US$ Billion), 2020-2033
- Descriptive Analysis
- Predictive Analysis
- Prescriptive Analysis
- Middle East & Africa Spend Analytics Market Outlook, by Deployment, Value (US$ Billion), 2020-2033
- On-premises
- Cloud
- Middle East & Africa Spend Analytics Market Outlook, by Industry, Value (US$ Billion), 2020-2033
- Manufacturing
- Retail
- BFSI
- IT & Telecom
- Education
- Healthcare
- Others
- Middle East & Africa Spend Analytics Market Outlook, by Country, Value (US$ Billion), 2020-2033
- Saudi Arabia Spend Analytics Market Outlook, by Type, 2020-2033
- Saudi Arabia Spend Analytics Market Outlook, by Analysis, 2020-2033
- Saudi Arabia Spend Analytics Market Outlook, by Deployment, 2020-2033
- Saudi Arabia Spend Analytics Market Outlook, by Industry, 2020-2033
- United Arab Emirates Spend Analytics Market Outlook, by Type, 2020-2033
- United Arab Emirates Spend Analytics Market Outlook, by Analysis, 2020-2033
- United Arab Emirates Spend Analytics Market Outlook, by Deployment, 2020-2033
- United Arab Emirates Spend Analytics Market Outlook, by Industry, 2020-2033
- South Africa Spend Analytics Market Outlook, by Type, 2020-2033
- South Africa Spend Analytics Market Outlook, by Analysis, 2020-2033
- South Africa Spend Analytics Market Outlook, by Deployment, 2020-2033
- South Africa Spend Analytics Market Outlook, by Industry, 2020-2033
- Qatar Spend Analytics Market Outlook, by Type, 2020-2033
- Qatar Spend Analytics Market Outlook, by Analysis, 2020-2033
- Qatar Spend Analytics Market Outlook, by Deployment, 2020-2033
- Qatar Spend Analytics Market Outlook, by Industry, 2020-2033
- Egypt Spend Analytics Market Outlook, by Type, 2020-2033
- Egypt Spend Analytics Market Outlook, by Analysis, 2020-2033
- Egypt Spend Analytics Market Outlook, by Deployment, 2020-2033
- Egypt Spend Analytics Market Outlook, by Industry, 2020-2033
- Middle East & Africa Spend Analytics Market Outlook, by Type, Value (US$ Billion), 2020-2033
- Competitive Landscape
- Market Concentration and Industry Leaders
- Competitive Differentiation
- Strategic Moves and Market Direction
- Recent Industry Developments
- Company Profiles
- SAP
- Coupa
- Oracle
- IBM
- GEP
- Sievo
- Zip
- JAGGAER
- Ivalua
- Microsoft
- SAS Institute
- Qlik
- Appendix
- Research Methodology
- Report Assumptions
- Acronyms and Abbreviations
Type
- Software
- Service
Analysis
- Descriptive Analysis
- Predictive Analysis
- Prescriptive Analysis
Deployment
- On-premises
- Cloud
Industry
- Manufacturing
- Retail
- BFSI
- IT & Telecom
- Education
- Healthcare
- Others
Regions
- North America
- Europe
- Asia Pacific
- Latin America
- Middle East & Africa
Our Research Methodology
Considering the volatility of business today, traditional approaches to strategizing a game plan can be unfruitful if not detrimental. True ambiguity is no way to determine a forecast. A myriad of predetermined factors must be accounted for such as the degree of risk involved, the magnitude of circumstances, as well as conditions or consequences that are not known or unpredictable. To circumvent binary views that cast uncertainty, the application of market research intelligence to strategically posture, move, and enable actionable outcomes is necessary.
View Methodology
Quality Assured
Rigorous Validation Process

Confidentiality Assured
End-to-end Data Security

Custom Research Services
Tailored To Your Objectives
FAQs
The spend analytics market is valued at US$ 3.90 billion in 2026, led by software and North America.
The market is projected to reach US$ 10.40 billion by 2033, growing at a 15.0% CAGR and adding US$ 6.50 billion.
Prescriptive analysis is growing fastest at an 18.4% CAGR through 2033, driven by AI tools that recommend sourcing actions.
Asia Pacific is growing fastest at a 17.1% CAGR through 2033, driven by digital procurement adoption in India and China.
North America holds the largest share at 39.0% in 2026, supported by large enterprises and leading procurement software vendors.
Related Reports
Wearable Cameras Market Size, Share, Insights, Competitive Landscape, and Forecast 2026 to 2033
The global wearable cameras market is valued at US$8.80 billion in 2026, reaching US$20.80 billion by 2033, growing at a 13.1% CAGR
IoT Security Market Size, Share, Insights, Competitive Landscape, and Forecast 2026 to 2033
The global IoT security market is valued at US$21.40 billion in 2026, reaching US$66.60 billion by 2033, growing at a 17.6% CAGR
Insurance Analytics Market Size, Share, Insights, Competitive Landscape, and Forecast 2026 to 2033
The global insurance analytics market is valued at US$17.30 billion in 2026, reaching US$39.70 billion by 2033, growing at a 12.6% CAGR
Smart Lighting Market Size, Share, Insights, Competitive Landscape, and Forecast 2026 to 2033
The smart lighting market is projected to grow from US$27.52 billion in 2026 to US$97.29 billion by 2033, at a 19.8% CAGR, led by connected lighting demand.
Lit Fiber Market Size, Share, Insights, Competitive Landscape, and Forecast 2026 to 2033
The lit fiber market is projected to grow from US$7.13 billion in 2026 to US$20.52 billion by 2033, at a 16.3% CAGR, driven by AI and cloud connectivity.
Laser Processing Market Size, Share, Insights, Competitive Landscape, and Forecast 2026 to 2033
The laser processing market is projected to grow from US$27.97 billion in 2026 to US$47.32 billion by 2033, at a 7.8% CAGR, driven by precision manufacturing.