



3D Concrete Printing Market
3D Concrete Printing Market Size, Share, Insights, Competitive Landscape, and Forecast 2026 to 2033
3D Concrete Printing Market Size and Trend Analysis
How Fast Is the 3D Concrete Printing Market Growing?
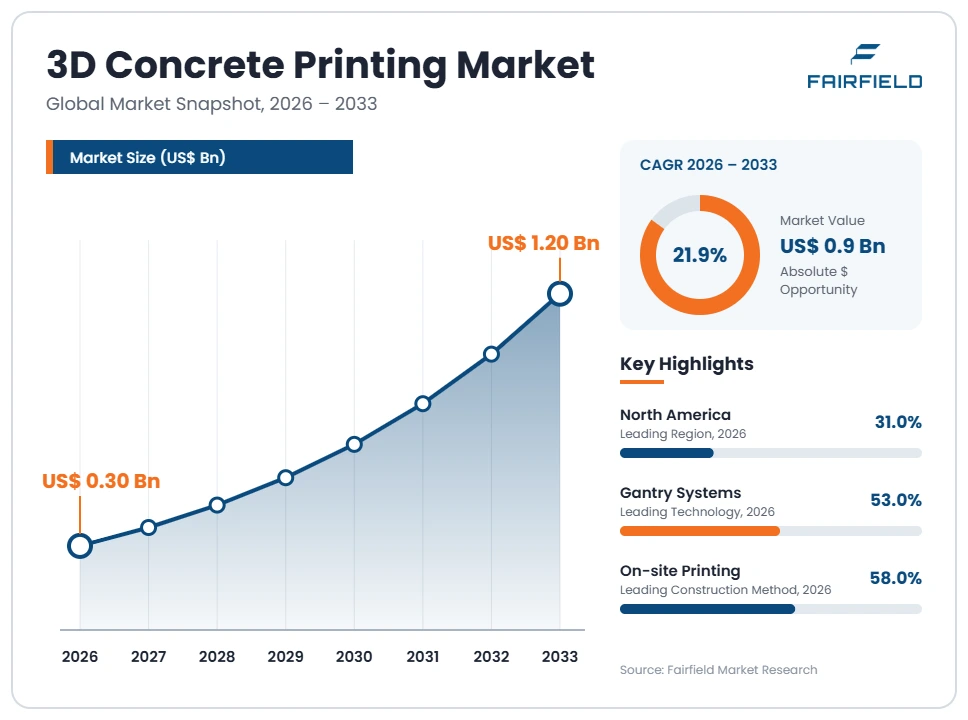
The global 3D Concrete Printing market size is expected to be valued at US$ 0.30 billion in 2026 and projected to reach US$ 1.20 billion by 2033, growing at a CAGR of 21.9% between 2026 and 2033.
The sector grew from roughly US$ 118 million in 2020 to about US$ 252 million in 2025, a historical CAGR of 16.4%. This estimate counts printing equipment, printable mortars and admixtures, and construction services delivered using printed elements. Three factors shape the forecast: shortages of skilled masonry labour across developed construction markets, state housing and infrastructure programmes that reward faster site delivery, and falling prices for gantry and robotic-arm hardware. Growth stays project-led rather than volume-led. Most completed work is low-rise, partly conventional, and concentrated in walls, precast components and formwork, so absolute revenue remains small beside the wider cementitious construction industry.
Key Report Takeaways
- By Technology: Gantry Systems held 53% share in 2026, while Robotic Arm Systems are projected to expand at a 25.1% CAGR through 2033, driven by their reach advantage on irregular sites and their reuse across other fabrication tasks between print jobs.
- By Offering: Printing Equipment held 45% share in 2026, while Construction Services are projected to expand at a 25.4% CAGR through 2033, as contractors buy delivered printed structures rather than operate printers and train crews in-house.
- By Construction Method: On-site Printing held 58% share in 2026, while Off-site Precast Printing is projected to expand at a 24.2% CAGR through 2033, because factory conditions remove weather variability and simplify inspection before elements reach the site.
- By End Use: Residential Buildings held 37% share in 2026, while Infrastructure & Public Works is projected to expand at a 24.8% CAGR through 2033, supported by printed culverts, retaining elements, marine units and street furniture bought by public agencies.
- By Geography: North America held 31% share in 2026, while Middle East & Africa is projected to expand at a 25.6% CAGR through 2033, reflecting Gulf state construction strategies that set explicit targets for printed building output.
Global 3D Concrete Printing Market Trends and Insights
Drivers Impact Analysis
Two forces account for most of the forecast growth in automated cementitious construction.
| Driver | Impact on CAGR Forecast | Geographic Relevance | Impact Timeline |
| Skilled masonry and formwork labour shortages | High | North America, Europe | Medium term (2–4 years) |
| State housing and infrastructure delivery targets | Medium | Middle East & Africa, Asia Pacific | Long term (≥4 years) |
Masonry Labour Shortages Push Contractors Toward Printed Wall Systems
Labour scarcity is the clearest commercial argument for printed concrete today. A gantry printer lays wall geometry with a crew of three to four, against the larger teams needed for block work, shuttering and stripping. Contractors facing unfilled trade vacancies use printing to protect programme dates rather than to cut unit cost, which is why adoption clusters in regions with ageing construction workforces and strict site timelines.
The mechanism is substitution of equipment hours for trade hours. Formwork carpentry and masonry are among the hardest site roles to recruit, and wage inflation in these trades raises the relative appeal of automation. Printing also removes the formwork purchase, transport and disposal cycle for curved or tapered walls. Builders report the strongest case on repetitive low-rise layouts, where a single digital model drives many near-identical wall prints without new shuttering for each unit.
Gulf and Asian Housing Programmes Create Repeatable Demand for Printed Structures
Public construction programmes convert printing from demonstration work into repeatable orders. Housing ministries and development authorities procure in batches, which lets a printing contractor amortise mobilisation, mix qualification and operator training across dozens of units instead of one villa. That changes the economics more than any hardware improvement, and it explains why the densest clusters of completed printed buildings sit alongside state-backed delivery targets.
The causal chain runs through procurement rules. When an authority writes printed construction into a tender or a municipal building strategy, local consultants and testing laboratories build the review capacity that private clients cannot justify alone. Printable mortar suppliers then qualify regional mixes using local aggregates, cutting material logistics cost. Infrastructure agencies extend the same route to culverts, noise barriers, marine armour units and street furniture, where structural performance demands are lower than in occupied buildings.
Restraints Impact Analysis
Two constraints hold the automated construction market well below its technical potential.
| Restraint | Impact on CAGR Forecast | Geographic Relevance | Impact Timeline |
| No design standards for reinforcement in printed elements | High | Global | Long term (≥4 years) |
| Slow permitting and code acceptance cycles | High | North America, Europe | Medium term (2–4 years) |
Missing Reinforcement Design Rules Keep Printed Concrete Out of Structural Roles
The binding constraint on this market is design standards, not printer availability. ACI 318 governs structural concrete design in the United States and contains no provisions for layered, extruded geometry, and Eurocode 2 is silent on printed sections in the same way. Engineers therefore cannot calculate a printed wall as a structural element under an accepted code, so most printed walls are treated as permanent formwork or infill around conventional reinforced cores.
The technical cause is reinforcement continuity. Extrusion lays filament by filament, which leaves anisotropic interlayer bond planes and no straightforward path for vertical and horizontal steel. Practical answers today include printing hollow cavities that are later filled with reinforced concrete, inserting bars between layers, or adding fibres to the mix. Each route needs project-specific testing, so engineering and third-party review costs recur on every job instead of falling with repetition.
Permitting and Code Acceptance Delays Limit Project Throughput
Permit timelines, not print speed, set the ceiling on how many projects a contractor completes each year. A printed building usually enters approval as an alternative means and methods submission, which requires a plan reviewer to assess a system no local code section describes. Reviews that take weeks for conventional construction can run for months, and the uncertainty discourages developers who work to financing deadlines.
The cost source is duplicated evaluation. ICC Evaluation Service offers an acceptance route through AC509, its acceptance criteria for 3D automated construction technology for printed walls, and UL 3401 provides an outline for evaluating outcomes of additively manufactured structures. Both require physical test programmes covering mix strength, interlayer bond, wall assembly behaviour and durability. ISO/ASTM 52939 sets qualification principles but does not grant local approval, so testing is often repeated jurisdiction by jurisdiction.
Market Opportunities
Two revenue pools sit outside the headline business of printing complete buildings.
Printed Formwork and Precast Components Open a Factory-Based Revenue Pool
Printed formwork and precast components give the industry a revenue pool that avoids the permitting bottleneck entirely. A printed mould for a complex column capital, a bridge node or an architectural façade panel is a temporary work product, so it faces no structural code review. Precasters can therefore adopt printing immediately, selling shapes that timber or steel shuttering cannot produce economically in small runs.
Precast plants and formwork specialists are best placed to capture this. Their customers are infrastructure contractors and architects who already accept factory-made concrete elements, and their quality systems cover dimensional tolerance and strength testing. Printing inside a controlled plant also removes wind, temperature and humidity variability that destabilises on-site extrusion. Growing interest in material-efficient, topology-optimised concrete sections supports the shift, because those geometries are impractical to form with conventional shuttering.
Low-Carbon Printable Binders Create a Materials Revenue Stream Beyond Hardware
Printable mortars and admixtures are becoming a larger profit pool than printers themselves. Every printed cubic metre consumes a proprietary mix tuned for pumpability, open time, buildability and early strength gain, and those mixes sell at a significant premium over ordinary ready-mix. A hardware sale happens once, while material supply recurs on every project for the life of the machine.
Cement and chemical groups are the natural owners of this pool, since they already run admixture laboratories and regional aggregate networks. Demand comes from public clients and developers reporting embodied carbon, who push suppliers toward calcined clay blends, slag systems and geopolymer binders rather than high-cement mortars. The EU Construction Products Regulation requires environmental performance declaration for construction products, which gives low-carbon printable binders a documented commercial advantage over undeclared alternatives.
Segment Analysis
- By Technology: Gantry Systems Lead While Robotic Arm Platforms Accelerate
Gantry Systems held 53% of the market in 2026 because they offer the most predictable accuracy over a full building footprint. A rigid frame fixes the print envelope, simplifies calibration and supports the continuous wall paths that low-rise housing requires, which is why most completed printed residential projects used gantry hardware. Robotic Arm Systems are the fastest-growing technology at a 25.1% CAGR to 2033. Arms mount on tracks or mobile bases, reach around existing structures, and can be redeployed for spraying, finishing or material handling between prints, improving asset utilisation for contractors who cannot fill a dedicated printer’s schedule. Shotcrete & Spray Systems serve repair and shell applications, while Powder Bed Binder Jetting remains confined to small architectural components. For suppliers, the implication is that hardware differentiation is shifting from raw print speed toward motion flexibility, pump integration and reliable operation in uncontrolled site conditions.
- By Offering: Equipment Sales Dominate Today While Construction Services Scale Faster
Printing Equipment accounted for 45% of revenue in 2026, reflecting an early market where most spending is capital purchase of gantries, robotic cells, pumps and mixing units by contractors and research institutions. Printing Materials follow, since proprietary printable mortar is consumed on every job. Construction Services, where a specialist firm delivers a finished printed structure under contract, is the fastest-growing offering at a 25.4% CAGR through 2033. Most builders lack the mix expertise, operator skills and engineering support that printing demands, so buying an outcome is less risky than buying a machine. Software remains the smallest segment but is becoming essential, as slicing, path planning and quality monitoring tools determine whether printed geometry matches the structural model. The business implication is clear: equipment vendors increasingly need a services or materials annuity to stabilise revenue between machine sales cycles.
- By Construction Method: On-site Printing Leads While Off-site Precast Printing Gains Ground
On-site Printing held 58% share in 2026 because the headline application remains printing walls in position, avoiding the transport and craneage costs of moving heavy concrete elements. Single-storey housing, boundary walls and small commercial shells suit this method. Off-site Precast Printing is expanding fastest at a 24.2% CAGR to 2033, driven by quality control rather than cost. A factory removes wind, rain and temperature swings that alter mortar rheology, and elements can be tested, cured and inspected before they reach a site, which materially shortens the approval conversation. Hybrid Printing, where printed shells are combined with conventional reinforced cores and cast floors, underpins most real projects regardless of category. For investors, the shift toward factory printing signals that the market may mature as a specialised precast segment rather than as a wholesale replacement for site-based construction.
- By End Use: Residential Buildings Hold the Largest Share While Public Infrastructure Grows Quickest
Residential Buildings represented 37% of demand in 2026, since low-rise houses have simple load paths, repetitive layouts and clients who tolerate novel construction in exchange for speed. Affordable housing pilots and disaster-replacement schemes make up much of this volume. Infrastructure & Public Works is the fastest-growing end use at a 24.8% CAGR through 2033, covering culverts, retaining elements, noise barriers, marine armour units, utility chambers and street furniture. These items are unoccupied, so approval hinges on durability and dimensional accuracy rather than life-safety provisions, and public agencies can specify them without an alternative-methods review. Commercial Buildings adopt printing mainly for façade and feature elements, while Industrial & Utility Structures use it for equipment plinths and bunded enclosures. The implication is that near-term revenue growth favours vendors selling into civil engineering procurement rather than into housebuilding alone.
Geography Analysis
- Which Region Is Leading the 3D Concrete Printing Market?
North America leads the 3D concrete printing market with 31% share in 2026, supported by the largest base of completed printed residential projects and the most developed evaluation pathway. The United States accounts for most of this, with activity concentrated in Texas, Arizona, California and Virginia, where labour costs are high and housing demand is persistent. The ICC Evaluation Service acceptance criteria AC509 gives engineers a recognised route to demonstrate code compliance for printed walls, which reduces the uncertainty that blocks permits elsewhere. Canada contributes smaller volumes through remote-community housing trials. The main barrier is that ACI 318 still has no printed-geometry provisions, so reinforced cores and project-specific testing remain standard. The clearest opportunity is production housing, where a single approved wall system can be repeated across a subdivision and spread evaluation costs across many units.
- Europe Advances Printed Construction Under a Tightening Products Regime
Europe holds 27% share in 2026 and leads on research depth, with established programmes in Germany, the Netherlands, Denmark, France, Italy and Belgium. The region produced several of the first permitted printed dwellings and the first printed pedestrian bridges, usually delivered with university partners and national approval bodies. Eurocode 2 contains no provisions for printed sections, so projects proceed through national technical assessments granted case by case. Regulation (EU) 2024/3110, the recast Construction Products Regulation, tightens declaration requirements and adds environmental performance information, which raises documentation effort but gives low-carbon printable mortars a defensible position. Rising cement and energy costs, plus strict embodied-carbon reporting in public tenders, favour material-efficient printed geometry. Growth is steady rather than rapid, because approval is handled nation by nation and construction output in several large economies has been weak.
- Asia Pacific Scales Printed Precast Through Large Contractor Groups
Asia Pacific holds 21% share in 2026, and its pattern differs from Western demonstration projects. China dominates regional activity through large state-linked contractors and precast groups that print bridge components, park structures, boundary walls and architectural elements at genuine production volumes. Japan focuses on printed precast units for infrastructure, drawing on an established precast industry and an acute construction labour shortage. Singapore supports adoption through national construction productivity programmes, while Australia and India run smaller pilots. The regional advantage is manufacturing capacity: printers, pumps and mixing equipment are produced locally, lowering capital cost. The barrier is low prevailing construction wages in parts of the region, which weakens the labour-substitution argument that drives adoption elsewhere. The opportunity lies in printed precast exported as components rather than printed buildings delivered on site.
- Latin America Tests Printed Social Housing at Limited Volumes
Latin America accounts for 6% share in 2026, the smallest regional position, with activity centred on social housing pilots in Mexico, Brazil, Colombia and Argentina. Printed housing settlements built with non-governmental and philanthropic funding have shown that the method suits single-storey dwellings with simple services. Interest is genuine because housing deficits are large and delivery speed matters politically. The barriers are financial and institutional: capital equipment is imported and priced in dollars, financing costs are high, and municipal building departments have no established procedure for reviewing printed structures. Cement producers with strong regional positions are the most likely route to scale, since they can supply qualified printable mortar and absorb equipment cost. Seismic design requirements in several countries also reinforce the need for conventional reinforcement alongside printed shells.
- Which Region Is Growing Fastest in the 3D Concrete Printing Market?
Middle East & Africa is growing fastest in the 3D concrete printing market, at a 25.6% CAGR between 2026 and 2033 from 15% share in 2026. The United Arab Emirates set an explicit municipal target for printed construction as a share of new buildings, which created the first sustained public procurement pipeline anywhere. Saudi Arabia followed with printed villas tied to large housing programmes, and Qatar has used printing for schools and public buildings. Three conditions make the Gulf unusually suitable: hot, dry weather that supports year-round extrusion, dependence on imported construction labour, and clients willing to fund new methods. Egypt and South Africa are early movers in Africa. The constraint is a shallow local supply chain for printable mortar, so most mixes are formulated from imported binders and admixtures.
Competitive Landscape
The 3D concrete printing market is fragmented and concentration is low. No supplier holds a dominant global share, and the field divides into three groups with different economics. Equipment specialists such as COBOD International, Apis Cor, CyBe Construction, WASP and Black Buffalo 3D sell gantries and robotic cells. Construction-led firms such as ICON Technology and XtreeE deliver finished structures rather than machines. Materials groups including Sika AG, Holcim, CEMEX and Saint-Gobain Weber supply printable mortars and admixtures that work across competing printers. Formwork and scaffolding specialists such as PERI SE have entered through both equipment distribution and project delivery, bringing established contractor relationships.
Competition is based less on print speed than on qualification evidence. Buyers ask which authorities have accepted a system, what structural testing exists, whether the mortar is available locally, and how the vendor handles reinforcement. Open hardware architectures that accept third-party mortars compete against closed systems that bundle machine and mix. Service availability matters too, because a stalled print can waste a full batch of material.
Strategic activity concentrates on alliances rather than acquisitions. Equipment vendors partner with cement and admixture producers so that qualified mixes exist in each target country, while materials suppliers take positions in printing firms to secure consumable demand. Contractors and precasters license systems instead of developing their own, and several vendors pair with universities and testing houses to build the structural evidence that approval bodies require.
Strategic direction is moving toward verticalisation. Suppliers increasingly offer machine, mortar, software and engineering support as one package, because fragmented responsibility makes approval harder. Investment is also shifting toward factory precast printing, reinforcement automation and lower-carbon binder systems.
Recent Industry Developments
- 2023: ISO and ASTM International published ISO/ASTM 52939, setting qualification principles for additive manufacturing of structural and infrastructure elements in construction – the first international framework that lets printed construction be assessed against a common technical basis rather than purely project by project.
- December 2024: Regulation (EU) 2024/3110, the recast Construction Products Regulation, was published in the Official Journal of the European Union, repealing Regulation (EU) No 305/2011 – its expanded declaration and environmental performance requirements strengthen the commercial case for documented low-carbon printable mortars.
- 2025: The American Concrete Institute issued the current edition of its structural concrete building code, ACI 318-25, which remains the governing design basis in the United States – printed geometry is still outside its scope, confirming that alternative-means review remains the route to approval.
Companies Covered in the Report
- COBOD International
- ICON Technology
- Apis Cor
- WASP
- XtreeE
- PERI SE
- CyBe Construction
- Sika AG
- Holcim
- CEMEX
- Saint-Gobain Weber
- Black Buffalo 3D
- Branch Technology
- Baumit
3D Concrete Printing Market Report Scope
| Metric | Value |
| Study Period | 2020–2033 |
| Market Size 2026 | US$ 0.3 Billion |
| Market Size 2033 | US$ 1.2 Billion |
| CAGR 2026–2033 | 21.9% |
| Absolute Dollar Opportunity | US$ 0.9 Billion |
| Largest Market | North America (31% share in 2026) |
| Fastest-Growing Market | Middle East & Africa (25.6% CAGR) |
| Market Concentration | Low |
| Major Players | COBOD International, ICON Technology, PERI SE, Sika AG, Holcim |
3D Concrete Printing Market Segmentation
Technology
- Gantry Systems
- Robotic Arm Systems
- Shotcrete & Spray Systems
- Powder Bed Binder Jetting
Offering
- Printing Equipment
- Printing Materials
- Construction Services
- Software
Construction Method
- On-site Printing
- Off-site Precast Printing
- Hybrid Printing
End Use
- Residential Buildings
- Commercial Buildings
- Infrastructure & Public Works
- Industrial & Utility Structures
Regions
- North America
- Europe
- Asia Pacific
- Latin America
- Middle East & Africa
- Executive Summary
- Global 3D Concrete Printing Market Snapshot
- Future Projections
- Key Report Takeaways
- Regional Snapshot
- Market Overview
- Market Definition and Report Scope
- Historical Trends 2020–2025
- Market Dynamics
- Drivers
- Masonry Labour Shortages Push Contractors Toward Printed Wall Systems
- Gulf and Asian Housing Programmes Create Repeatable Demand for Printed Structures
- Restraints
- Missing Reinforcement Design Rules Keep Printed Concrete Out of Structural Roles
- Permitting and Code Acceptance Delays Limit Project Throughput
- Market Opportunities
- Printed Formwork and Precast Components Open a Factory-Based Revenue Pool
- Low-Carbon Printable Binders Create a Materials Revenue Stream Beyond Hardware
- Drivers
- Global 3D Concrete Printing Market Outlook, 2020–2033
- Global 3D Concrete Printing Market Outlook, by Technology, Value (US$ Billion), 2020–2033
- Gantry Systems
- Robotic Arm Systems
- Shotcrete & Spray Systems
- Powder Bed Binder Jetting
- Global 3D Concrete Printing Market Outlook, by Offering, Value (US$ Billion), 2020–2033
- Printing Equipment
- Printing Materials
- Construction Services
- Software
- Global 3D Concrete Printing Market Outlook, by Construction Method, Value (US$ Billion), 2020–2033
- On-site Printing
- Off-site Precast Printing
- Hybrid Printing
- Global 3D Concrete Printing Market Outlook, by End Use, Value (US$ Billion), 2020–2033
- Residential Buildings
- Commercial Buildings
- Infrastructure & Public Works
- Industrial & Utility Structures
- Global 3D Concrete Printing Market Outlook, by Region, Value (US$ Billion), 2020–2033
- North America
- Europe
- Asia Pacific
- Latin America
- Middle East & Africa
- Global 3D Concrete Printing Market Outlook, by Technology, Value (US$ Billion), 2020–2033
- North America 3D Concrete Printing Market Outlook, 2020–2033
- North America 3D Concrete Printing Market Outlook, by Technology, Value (US$ Billion), 2020–2033
- Gantry Systems
- Robotic Arm Systems
- Shotcrete & Spray Systems
- Powder Bed Binder Jetting
- North America 3D Concrete Printing Market Outlook, by Offering, Value (US$ Billion), 2020–2033
- Printing Equipment
- Printing Materials
- Construction Services
- Software
- North America 3D Concrete Printing Market Outlook, by Construction Method, Value (US$ Billion), 2020–2033
- On-site Printing
- Off-site Precast Printing
- Hybrid Printing
- North America 3D Concrete Printing Market Outlook, by End Use, Value (US$ Billion), 2020–2033
- Residential Buildings
- Commercial Buildings
- Infrastructure & Public Works
- Industrial & Utility Structures
- North America 3D Concrete Printing Market Outlook, by Country, Value (US$ Billion), 2020–2033
- United States 3D Concrete Printing Market Outlook, by Technology, 2020–2033
- United States 3D Concrete Printing Market Outlook, by Offering, 2020–2033
- United States 3D Concrete Printing Market Outlook, by Construction Method, 2020–2033
- United States 3D Concrete Printing Market Outlook, by End Use, 2020–2033
- Canada 3D Concrete Printing Market Outlook, by Technology, 2020–2033
- Canada 3D Concrete Printing Market Outlook, by Offering, 2020–2033
- Canada 3D Concrete Printing Market Outlook, by Construction Method, 2020–2033
- Canada 3D Concrete Printing Market Outlook, by End Use, 2020–2033
- North America 3D Concrete Printing Market Outlook, by Technology, Value (US$ Billion), 2020–2033
- Europe 3D Concrete Printing Market Outlook, 2020–2033
- Europe 3D Concrete Printing Market Outlook, by Technology, Value (US$ Billion), 2020–2033
- Gantry Systems
- Robotic Arm Systems
- Shotcrete & Spray Systems
- Powder Bed Binder Jetting
- Europe 3D Concrete Printing Market Outlook, by Offering, Value (US$ Billion), 2020–2033
- Printing Equipment
- Printing Materials
- Construction Services
- Software
- Europe 3D Concrete Printing Market Outlook, by Construction Method, Value (US$ Billion), 2020–2033
- On-site Printing
- Off-site Precast Printing
- Hybrid Printing
- Europe 3D Concrete Printing Market Outlook, by End Use, Value (US$ Billion), 2020–2033
- Residential Buildings
- Commercial Buildings
- Infrastructure & Public Works
- Industrial & Utility Structures
- Europe 3D Concrete Printing Market Outlook, by Country, Value (US$ Billion), 2020–2033
- Germany 3D Concrete Printing Market Outlook, by Technology, 2020–2033
- Germany 3D Concrete Printing Market Outlook, by Offering, 2020–2033
- Germany 3D Concrete Printing Market Outlook, by Construction Method, 2020–2033
- Germany 3D Concrete Printing Market Outlook, by End Use, 2020–2033
- Netherlands 3D Concrete Printing Market Outlook, by Technology, 2020–2033
- Netherlands 3D Concrete Printing Market Outlook, by Offering, 2020–2033
- Netherlands 3D Concrete Printing Market Outlook, by Construction Method, 2020–2033
- Netherlands 3D Concrete Printing Market Outlook, by End Use, 2020–2033
- Denmark 3D Concrete Printing Market Outlook, by Technology, 2020–2033
- Denmark 3D Concrete Printing Market Outlook, by Offering, 2020–2033
- Denmark 3D Concrete Printing Market Outlook, by Construction Method, 2020–2033
- Denmark 3D Concrete Printing Market Outlook, by End Use, 2020–2033
- France 3D Concrete Printing Market Outlook, by Technology, 2020–2033
- France 3D Concrete Printing Market Outlook, by Offering, 2020–2033
- France 3D Concrete Printing Market Outlook, by Construction Method, 2020–2033
- France 3D Concrete Printing Market Outlook, by End Use, 2020–2033
- Italy 3D Concrete Printing Market Outlook, by Technology, 2020–2033
- Italy 3D Concrete Printing Market Outlook, by Offering, 2020–2033
- Italy 3D Concrete Printing Market Outlook, by Construction Method, 2020–2033
- Italy 3D Concrete Printing Market Outlook, by End Use, 2020–2033
- Belgium 3D Concrete Printing Market Outlook, by Technology, 2020–2033
- Belgium 3D Concrete Printing Market Outlook, by Offering, 2020–2033
- Belgium 3D Concrete Printing Market Outlook, by Construction Method, 2020–2033
- Belgium 3D Concrete Printing Market Outlook, by End Use, 2020–2033
- Europe 3D Concrete Printing Market Outlook, by Technology, Value (US$ Billion), 2020–2033
- Asia Pacific 3D Concrete Printing Market Outlook, 2020–2033
- Asia Pacific 3D Concrete Printing Market Outlook, by Technology, Value (US$ Billion), 2020–2033
- Gantry Systems
- Robotic Arm Systems
- Shotcrete & Spray Systems
- Powder Bed Binder Jetting
- Asia Pacific 3D Concrete Printing Market Outlook, by Offering, Value (US$ Billion), 2020–2033
- Printing Equipment
- Printing Materials
- Construction Services
- Software
- Asia Pacific 3D Concrete Printing Market Outlook, by Construction Method, Value (US$ Billion), 2020–2033
- On-site Printing
- Off-site Precast Printing
- Hybrid Printing
- Asia Pacific 3D Concrete Printing Market Outlook, by End Use, Value (US$ Billion), 2020–2033
- Residential Buildings
- Commercial Buildings
- Infrastructure & Public Works
- Industrial & Utility Structures
- Asia Pacific 3D Concrete Printing Market Outlook, by Country, Value (US$ Billion), 2020–2033
- China 3D Concrete Printing Market Outlook, by Technology, 2020–2033
- China 3D Concrete Printing Market Outlook, by Offering, 2020–2033
- China 3D Concrete Printing Market Outlook, by Construction Method, 2020–2033
- China 3D Concrete Printing Market Outlook, by End Use, 2020–2033
- Japan 3D Concrete Printing Market Outlook, by Technology, 2020–2033
- Japan 3D Concrete Printing Market Outlook, by Offering, 2020–2033
- Japan 3D Concrete Printing Market Outlook, by Construction Method, 2020–2033
- Japan 3D Concrete Printing Market Outlook, by End Use, 2020–2033
- Singapore 3D Concrete Printing Market Outlook, by Technology, 2020–2033
- Singapore 3D Concrete Printing Market Outlook, by Offering, 2020–2033
- Singapore 3D Concrete Printing Market Outlook, by Construction Method, 2020–2033
- Singapore 3D Concrete Printing Market Outlook, by End Use, 2020–2033
- Australia 3D Concrete Printing Market Outlook, by Technology, 2020–2033
- Australia 3D Concrete Printing Market Outlook, by Offering, 2020–2033
- Australia 3D Concrete Printing Market Outlook, by Construction Method, 2020–2033
- Australia 3D Concrete Printing Market Outlook, by End Use, 2020–2033
- India 3D Concrete Printing Market Outlook, by Technology, 2020–2033
- India 3D Concrete Printing Market Outlook, by Offering, 2020–2033
- India 3D Concrete Printing Market Outlook, by Construction Method, 2020–2033
- India 3D Concrete Printing Market Outlook, by End Use, 2020–2033
- Asia Pacific 3D Concrete Printing Market Outlook, by Technology, Value (US$ Billion), 2020–2033
- Latin America 3D Concrete Printing Market Outlook, 2020–2033
- Latin America 3D Concrete Printing Market Outlook, by Technology, Value (US$ Billion), 2020–2033
- Gantry Systems
- Robotic Arm Systems
- Shotcrete & Spray Systems
- Powder Bed Binder Jetting
- Latin America 3D Concrete Printing Market Outlook, by Offering, Value (US$ Billion), 2020–2033
- Printing Equipment
- Printing Materials
- Construction Services
- Software
- Latin America 3D Concrete Printing Market Outlook, by Construction Method, Value (US$ Billion), 2020–2033
- On-site Printing
- Off-site Precast Printing
- Hybrid Printing
- Latin America 3D Concrete Printing Market Outlook, by End Use, Value (US$ Billion), 2020–2033
- Residential Buildings
- Commercial Buildings
- Infrastructure & Public Works
- Industrial & Utility Structures
- Latin America 3D Concrete Printing Market Outlook, by Country, Value (US$ Billion), 2020–2033
- Mexico 3D Concrete Printing Market Outlook, by Technology, 2020–2033
- Mexico 3D Concrete Printing Market Outlook, by Offering, 2020–2033
- Mexico 3D Concrete Printing Market Outlook, by Construction Method, 2020–2033
- Mexico 3D Concrete Printing Market Outlook, by End Use, 2020–2033
- Brazil 3D Concrete Printing Market Outlook, by Technology, 2020–2033
- Brazil 3D Concrete Printing Market Outlook, by Offering, 2020–2033
- Brazil 3D Concrete Printing Market Outlook, by Construction Method, 2020–2033
- Brazil 3D Concrete Printing Market Outlook, by End Use, 2020–2033
- Colombia 3D Concrete Printing Market Outlook, by Technology, 2020–2033
- Colombia 3D Concrete Printing Market Outlook, by Offering, 2020–2033
- Colombia 3D Concrete Printing Market Outlook, by Construction Method, 2020–2033
- Colombia 3D Concrete Printing Market Outlook, by End Use, 2020–2033
- Argentina 3D Concrete Printing Market Outlook, by Technology, 2020–2033
- Argentina 3D Concrete Printing Market Outlook, by Offering, 2020–2033
- Argentina 3D Concrete Printing Market Outlook, by Construction Method, 2020–2033
- Argentina 3D Concrete Printing Market Outlook, by End Use, 2020–2033
- Latin America 3D Concrete Printing Market Outlook, by Technology, Value (US$ Billion), 2020–2033
- Middle East & Africa 3D Concrete Printing Market Outlook, 2020–2033
- Middle East & Africa 3D Concrete Printing Market Outlook, by Technology, Value (US$ Billion), 2020–2033
- Gantry Systems
- Robotic Arm Systems
- Shotcrete & Spray Systems
- Powder Bed Binder Jetting
- Middle East & Africa 3D Concrete Printing Market Outlook, by Offering, Value (US$ Billion), 2020–2033
- Printing Equipment
- Printing Materials
- Construction Services
- Software
- Middle East & Africa 3D Concrete Printing Market Outlook, by Construction Method, Value (US$ Billion), 2020–2033
- On-site Printing
- Off-site Precast Printing
- Hybrid Printing
- Middle East & Africa 3D Concrete Printing Market Outlook, by End Use, Value (US$ Billion), 2020–2033
- Residential Buildings
- Commercial Buildings
- Infrastructure & Public Works
- Industrial & Utility Structures
- Middle East & Africa 3D Concrete Printing Market Outlook, by Country, Value (US$ Billion), 2020–2033
- United Arab Emirates 3D Concrete Printing Market Outlook, by Technology, 2020–2033
- United Arab Emirates 3D Concrete Printing Market Outlook, by Offering, 2020–2033
- United Arab Emirates 3D Concrete Printing Market Outlook, by Construction Method, 2020–2033
- United Arab Emirates 3D Concrete Printing Market Outlook, by End Use, 2020–2033
- Saudi Arabia 3D Concrete Printing Market Outlook, by Technology, 2020–2033
- Saudi Arabia 3D Concrete Printing Market Outlook, by Offering, 2020–2033
- Saudi Arabia 3D Concrete Printing Market Outlook, by Construction Method, 2020–2033
- Saudi Arabia 3D Concrete Printing Market Outlook, by End Use, 2020–2033
- Qatar 3D Concrete Printing Market Outlook, by Technology, 2020–2033
- Qatar 3D Concrete Printing Market Outlook, by Offering, 2020–2033
- Qatar 3D Concrete Printing Market Outlook, by Construction Method, 2020–2033
- Qatar 3D Concrete Printing Market Outlook, by End Use, 2020–2033
- Egypt 3D Concrete Printing Market Outlook, by Technology, 2020–2033
- Egypt 3D Concrete Printing Market Outlook, by Offering, 2020–2033
- Egypt 3D Concrete Printing Market Outlook, by Construction Method, 2020–2033
- Egypt 3D Concrete Printing Market Outlook, by End Use, 2020–2033
- South Africa 3D Concrete Printing Market Outlook, by Technology, 2020–2033
- South Africa 3D Concrete Printing Market Outlook, by Offering, 2020–2033
- South Africa 3D Concrete Printing Market Outlook, by Construction Method, 2020–2033
- South Africa 3D Concrete Printing Market Outlook, by End Use, 2020–2033
- Middle East & Africa 3D Concrete Printing Market Outlook, by Technology, Value (US$ Billion), 2020–2033
- Competitive Landscape
- Market Concentration and Industry Leaders
- Competitive Differentiation
- Strategic Moves and Market Direction
- Recent Industry Developments
- Company Profiles
- COBOD International
- ICON Technology
- Apis Cor
- WASP
- XtreeE
- PERI SE
- CyBe Construction
- Sika AG
- Holcim
- CEMEX
- Saint-Gobain Weber
- Black Buffalo 3D
- Branch Technology
- Baumit
- Appendix
- Research Methodology
- Report Assumptions
- Acronyms and Abbreviations
Technology
- Gantry Systems
- Robotic Arm Systems
- Shotcrete & Spray Systems
- Powder Bed Binder Jetting
Offering
- Printing Equipment
- Printing Materials
- Construction Services
- Software
Construction Method
- On-site Printing
- Off-site Precast Printing
- Hybrid Printing
End Use
- Residential Buildings
- Commercial Buildings
- Infrastructure & Public Works
- Industrial & Utility Structures
Regions
- North America
- Europe
- Asia Pacific
- Latin America
- Middle East & Africa
Our Research Methodology
Considering the volatility of business today, traditional approaches to strategizing a game plan can be unfruitful if not detrimental. True ambiguity is no way to determine a forecast. A myriad of predetermined factors must be accounted for such as the degree of risk involved, the magnitude of circumstances, as well as conditions or consequences that are not known or unpredictable. To circumvent binary views that cast uncertainty, the application of market research intelligence to strategically posture, move, and enable actionable outcomes is necessary.
View Methodology
Quality Assured
Rigorous Validation Process

Confidentiality Assured
End-to-end Data Security

Custom Research Services
Tailored To Your Objectives
FAQs
The market is valued at US$ 0.30 billion in 2026, covering printing equipment, printable cementitious materials and construction services delivered with printed elements worldwide.
It is projected to reach US$ 1.20 billion by 2033, expanding at a 21.9% CAGR and adding US$ 0.9 billion in absolute dollar opportunity.
Gantry Systems lead with 53% share in 2026, because rigid frames deliver predictable accuracy across a full building footprint and suit repetitive low-rise wall printing.
Construction Services grow fastest at a 25.4% CAGR, since most builders prefer buying a delivered printed structure over operating printers and qualifying mortars themselves.
North America holds 31% share in 2026, helped by high construction labour costs and a recognised evaluation route for demonstrating printed wall code compliance.
Related Reports
Elevator Maintenance Market Size, Share, Insights, Competitive Landscape, and Forecast 2026 to 2033
The global elevator maintenance market is valued at US$64.8 billion in 2026, reaching US$92.6 billion by 2033, growing at a 5.2% CAGR
Gas Insulated Power Equipment Market Size, Share, Insights, Competitive Landscape, and Forecast 2026 to 2033
The gas insulated power equipment market is valued at US$ 24.0 Bn in 2026 and is projected to reach US$ 40.5 Bn by 2033, growing at a CAGR of 7.8%
Chain Conveyors Market Size, Share, Insights, Competitive Landscape, and Forecast 2026 to 2033
The global chain conveyors market will grow from US$9.78 billion in 2026 to US$15.45 billion by 2033, at a CAGR of 6.75%, driven by industrial automation.
Reciprocating Plunger Pumps Market Size, Share, Insights, Competitive Landscape, and Forecast 2026 to 2033
The reciprocating plunger pumps market will grow from US$4.89 billion in 2026 to US$7.45 billion by 2033, at a CAGR of 6.2%.
Plastic Injection Molding Machine for MedTech Market Size, Share, Insights, Competitive Landscape, and Forecast 2026 to 2033
The plastic injection molding machine for MedTech market will grow from US$2.1 billion in 2026 to US$3.46 billion by 2033, at a CAGR of 7.4%.
Plastic Processing Machinery Market Size, Share, Insights, Competitive Landscape, and Forecast 2026 to 2033
The plastic processing machinery market will grow from US$38.5 billion in 2026 to US$55.3 billion by 2033, at a 5.3% CAGR, driven by industrial demand.