



AI in Oil & Gas Market
AI in Oil & Gas Market Size, Share, Insights, Competitive Landscape, and Forecast 2026 to 2033
AI in Oil & Gas Market Size and Trend Analysis
How Fast Is AI Adoption Growing in Oil and Gas?
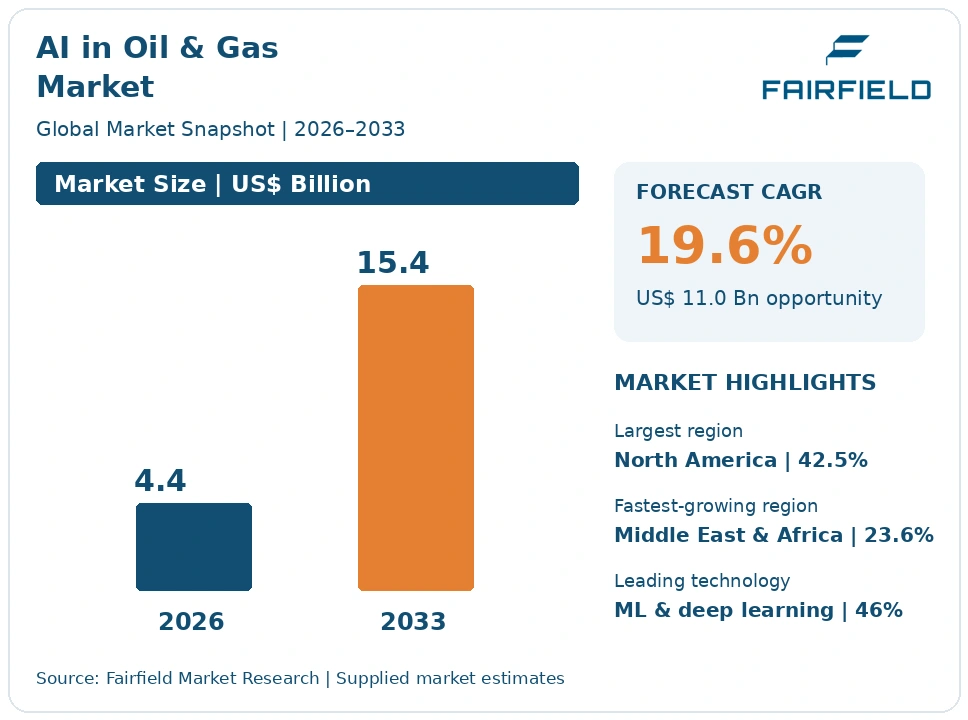
The global AI in Oil & Gas market size is expected to be valued at US$ 4.4 billion in 2026 and projected to reach US$ 15.4 billion by 2033, growing at a CAGR of 19.6% between 2026 and 2033.
Spending grew at roughly a 21.0% CAGR between 2020 and 2025, though from a narrow base concentrated in seismic interpretation pilots. Three factors now drive the forecast. Methane measurement obligations in the European Union and the United States have created a compliance workload that only automated image and sensor analysis can handle at scale. Operators facing retiring technical staff are buying prescriptive maintenance and engineering assistance models to retain working knowledge. Falling inference costs make generative assistants affordable for field use. Growth is strong but disciplined, because management-of-change procedures and safety validation requirements stretch procurement cycles well beyond those seen in other industries.
Key Report Takeaways
- By Technology: Machine Learning & Deep Learning held 46.0% share in 2026, while Generative AI & Large Language Models is projected to expand at a 28.9% CAGR through 2033, driven by demand for retrieval over decades of unstructured engineering documentation.
- By Application: Subsurface Interpretation & Reservoir Characterization held 24.0% share in 2026, while Methane Detection & Emissions Quantification is projected to expand at a 26.4% CAGR through 2033, because regulators now require measurement-based reporting rather than engineering factors.
- By Deployment: On-Premise held 44.0% share in 2026, while Edge is projected to expand at a 24.1% CAGR through 2033, as pipeline security directives and latency limits push inference onto local controllers and cameras.
- By Value Chain Stream: Upstream held 58.0% share in 2026, while Midstream is projected to expand at a 21.8% CAGR through 2033, reflecting leak detection, pigging analytics and integrity models across long transmission networks.
- By Geography: North America held 42.5% share in 2026, while Middle East & Africa is projected to expand at a 23.6% CAGR through 2033, supported by national oil company digital programmes and new autonomous drilling deployments.
Global AI in Oil & Gas Market Trends and Insights
Drivers Impact Analysis
The two drivers below have the clearest measurable effect on model and autonomy spending through the forecast period.
| Driver | Impact on CAGR Forecast | Geographic Relevance | Impact Timeline |
| Methane measurement and quantification obligations | High | North America, Europe | Short term ≤2 years |
| Workforce attrition raising demand for prescriptive models | Medium | North America, Middle East & Africa | Medium term 2–4 years |
Methane Measurement Rules Create a Dedicated AI Workload in Plume Detection
Regulatory shifts from estimated to measured methane emissions have created a computing workload that manual review cannot absorb. Operators must now reconcile satellite imagery, aerial surveys, continuous point sensors and site inspections across thousands of dispersed facilities. Detecting, attributing and quantifying a plume from spectral imagery is a pattern recognition problem, so each new reporting obligation converts directly into demand for trained detection models.
The mechanism is specific and auditable. The United States Environmental Protection Agency standards for new and existing oil and gas sources permit advanced measurement technologies in place of prescribed survey frequencies, which rewards operators that can prove detection performance. Regulation (EU) 2024/1787 requires source-level measurement and independent verification for energy-sector methane. Both regimes reward quantification accuracy, and accuracy at continental scale is achievable only through automated inference over imagery and sensor streams.
Technical Workforce Attrition Pushes Operators Toward Prescriptive Maintenance Models
Retirement of experienced reliability and reservoir engineers is accelerating purchases of models that encode judgement rather than merely flag anomalies. Operators running compressors, pumps and turbines across remote sites no longer have enough specialists to interpret vibration and thermal data manually. Prescriptive models that recommend a specific intervention, with a confidence estimate and an expected failure window, directly substitute for scarce expertise.
The causal chain runs through crew structure. Shift rosters at offshore and remote onshore facilities have thinned, while asset ages have risen, so the ratio of rotating equipment to qualified reviewers has worsened. Vendors have responded by embedding inference on control hardware so that recommendations reach the control room without a data science team in the loop. NIST guidance on artificial intelligence risk management gives reliability groups a vocabulary for documenting when such recommendations may be trusted.
Restraints Impact Analysis
Two constraints consistently slow conversion of successful pilots into fleet-wide deployment.
| Restraint | Impact on CAGR Forecast | Geographic Relevance | Impact Timeline |
| Model validation and explainability in safety-critical control | High | Europe, North America | Long term ≥4 years |
| Scarce labelled data for rare failure events | Medium | Global | Medium term 2–4 years |
Validation and Liability Questions Stall AI Deployment in Safety-Critical Operations
Safety-critical duties remain largely closed to autonomous models, and that ceiling limits the addressable value of each deployment. Where a model recommendation could change well pressure, flare routing or shutdown logic, operators require evidence that behaviour is bounded and explainable. Management-of-change procedures treat a retrained model as a plant modification, so every version update triggers review, documentation and sign-off.
The underlying cause is accountability rather than technical capability. Liability for an operational decision sits with the duty holder, and no vendor contract transfers it, so engineers default to advisory rather than closed-loop implementations. Regulation (EU) 2024/1689 adds formal obligations where a system is classified as high risk, including logging, human oversight and technical documentation. Compliance work for conformity assessment, documentation and post-market monitoring is a direct cost that lengthens payback on each installation.
Scarce Labelled Failure Data Caps Model Accuracy Across Oil and Gas Assets
Model performance is constrained by a shortage of labelled examples for exactly the events operators most want to predict. Catastrophic seal failures, casing deformation and compressor surge events are rare by design, so a single facility may record only a handful of confirmed cases across a decade. Without sufficient positive examples, detection models produce false alarms that operations teams quickly learn to ignore.
The cost source is data preparation, not computing. Historical maintenance records are inconsistently coded, failure causes are often entered as free text, and sensor tags differ between sites commissioned in different decades. Building a usable training set means paying engineers to relabel years of work orders. Operators also resist pooling failure data across companies because of competitive and legal exposure, which prevents the larger datasets that would make rare-event prediction reliable.
Market Opportunities
Generative Assistants for Technical Documentation Open a Seat-Based Revenue Pool
Retrieval and generation over engineering documentation is the clearest near-term revenue pool, because it reaches users who never touched analytics software. A single mature asset holds decades of drilling reports, inspection records, piping drawings and incident investigations. Making that corpus searchable in natural language turns a licence from a specialist tool into a per-seat subscription across engineering, operations and regulatory reporting teams.
Software vendors and systems integrators are best positioned to capture it, since the work is mostly ingestion, access control and evaluation rather than novel modelling. Demand comes from operations engineers preparing shutdown scopes, regulatory teams assembling submissions, and field crews writing daily reports. The NIST generative artificial intelligence profile supports adoption by giving risk teams a recognised structure for assessing hallucination, provenance and access control before approval.
Autonomous Directional Drilling Shifts Vendors Toward Outcome-Based Contracting
Closed-loop directional drilling creates a revenue pool that licence pricing cannot capture, because the value is measured in days saved per well. When steering decisions are made automatically from downhole measurements, wellbore quality improves and connection times fall. Vendors can then price against footage delivered or time saved rather than software seats, which raises revenue per well substantially above a conventional service contract.
Drilling contractors and integrated service companies are the natural owners, since they already control the rig floor equipment that executes the instruction. Demand comes from operators drilling repetitive unconventional pads, where learning transfers quickly between wells. Reinforcement learning applied to steering, weight-on-bit and rotary speed control supports the model, while improved downhole telemetry rates make the correction loop fast enough to act within a single stand rather than after a survey.
Segment Analysis
By Technology: Machine Learning Dominates While Generative AI Scales Fastest
Machine Learning & Deep Learning held 46.0% of the AI in oil and gas market in 2026, because supervised and self-supervised models underpin seismic interpretation, facies classification, production forecasting and anomaly detection. Computer Vision followed at 20.0%, covering corrosion inspection, flare monitoring, personal protective equipment compliance and restricted-zone intrusion alerts. Reinforcement Learning & Control Optimization held 18.0%, concentrated in drilling parameter control and artificial lift tuning.
Generative AI & Large Language Models is the fastest-growing technology at a 28.9% CAGR through 2033 from 16.0% share. Growth reflects immediate utility against unstructured documentation and falling inference costs. The implication for the digital oilfield is a change in buyer: generative tools are bought by operations and engineering leaders with their own budgets, while classical machine learning purchases still route through subsurface or reliability functions.
By Application: Subsurface Interpretation Leads as Methane Detection Accelerates
Subsurface Interpretation & Reservoir Characterization led applications with 24.0% share in 2026, because seismic volumes are large, well labelled by historical interpretation, and the commercial consequence of a better prospect ranking is enormous. Predictive & Prescriptive Maintenance followed at 21.0%, Drilling Automation at 16.0%, Production Optimization at 15.0%, and health, safety and inspection monitoring at 13.0%.
Methane Detection & Emissions Quantification is the fastest-growing application at a 26.4% CAGR through 2033 from a 6.0% base, driven by measurement-based reporting duties and the volume of satellite and continuous sensor data requiring interpretation. Engineering Knowledge & Field Reporting assistance held 5.0%. The business implication is that compliance, rather than production uplift, is becoming the most reliable budget line for new artificial intelligence in oil and gas projects.
By Deployment: On-Premise Retains Scale While Edge Inference Grows Quickest
On-Premise deployment held 44.0% share in 2026, because operators keep subsurface and control-system data inside their own perimeter for security and contractual reasons. Cloud deployment reached 38.0%, favoured for seismic processing, large-scale training runs and corporate analytics where elastic compute matters more than latency. Many operators run a split estate, training centrally and scoring locally.
Edge deployment is the fastest-growing mode at a 24.1% CAGR through 2033 from 18.0% share. Pipeline security directives issued by the United States Transportation Security Administration restrict connectivity between operational and corporate networks, which pushes inference onto local hardware. Latency also matters: vision models watching a drill floor or a flare stack must act in milliseconds. The result is growing demand for compact models that run on ruggedised industrial controllers.
By Value Chain Stream: Upstream Holds the Budget While Midstream Expands Fastest
Upstream operations accounted for 58.0% of spending in 2026, reflecting the concentration of high-value decisions in exploration, drilling and reservoir management. A single improved well placement can repay an entire analytics programme, which makes upstream budget holders the least price-sensitive buyers. Downstream refining and petrochemicals held 25.0%, applying machine learning to unit yield optimisation, catalyst performance and turnaround planning.
Midstream is the fastest-growing stream at a 21.8% CAGR through 2033 from 17.0% share. Transmission and gathering operators face the sharpest methane detection obligations, the longest linear assets to inspect, and the strictest pipeline cybersecurity expectations. Vision-based right-of-way monitoring, leak classification and compressor station predictive maintenance are scaling quickly. The implication is that midstream is becoming a distinct buying centre rather than an extension of upstream procurement.
Geography Analysis
Which Region Leads the AI in Oil & Gas Market?
North America leads the AI in Oil & Gas market with 42.5% share in 2026, growing at an 18.4% CAGR through 2033. The United States dominates through unconventional drilling, where repeatable pad development generates the dense, comparable datasets that drilling automation and production optimisation models require. Canada contributes through oil sands operations and pipeline integrity programmes.
Regulation reinforces the lead. Environmental Protection Agency methane standards push operators toward measurement-based quantification, while Transportation Security Administration pipeline security directives shape where models may run. A deep vendor ecosystem, from oilfield service majors to cloud providers and specialist software firms, shortens deployment timelines. The main change ahead is a move from advisory dashboards to closed-loop control on routine, well-bounded tasks such as artificial lift optimisation and choke management.
Europe Prioritises Governed and Auditable AI Across Energy Operations
Europe held 18.0% of the market in 2026 and is forecast to grow at an 18.0% CAGR to 2033. Norway, the United Kingdom and the Netherlands account for most activity, concentrated in offshore production, subsea inspection and refinery optimisation. Offshore economics favour automation strongly, because reducing crew exposure and helicopter transfers carries both safety and cost benefits.
Governance shapes procurement more than elsewhere. Regulation (EU) 2024/1689 imposes documentation, logging and human oversight duties where a system is classified as high risk, so operators specify auditability at tender stage. Regulation (EU) 2024/1787 drives methane quantification work across production and import chains. The main change is consolidation of fragmented pilots into governed platforms with formal model registers, validation records and defined retraining approval paths.
Asia Pacific Builds AI Capacity Around Refining and National Exploration Programmes
Asia Pacific represented 19.5% of the market in 2026 with a projected 21.0% CAGR to 2033. China, India, Australia, Malaysia and Indonesia drive demand. The regional profile tilts toward downstream, because the area hosts a large and still-growing refining and petrochemical base where yield optimisation models deliver quick, measurable margin gains.
National oil companies are investing in exploration analytics to improve success rates in frontier basins, and liquefied natural gas operators in Australia apply predictive maintenance to large rotating equipment with very high downtime costs. Domestic cloud and semiconductor capability in China supports local model development. The clearest opportunity is drilling automation for onshore campaigns in India and China, where rig counts are rising and experienced directional drillers are scarce.
Latin America Applies AI Mainly to Deepwater Production and Pipeline Integrity
Latin America held 5.0% of the market in 2026 with a 19.0% CAGR forecast to 2033. Brazil leads by a wide margin through pre-salt deepwater development, where subsea equipment reliability and flow assurance justify advanced modelling. Argentina contributes through unconventional development in the Vaca Muerta formation, and Mexico and Colombia add refinery and pipeline applications.
Barriers are practical. Connectivity to remote fields is uneven, local data science talent is thin relative to demand, and procurement at state-controlled operators is slow and heavily documented. Currency volatility complicates multi-year software contracts. The main opportunity is subsea inspection: autonomous vehicles equipped with vision models can cut intervention vessel days, which are among the most expensive line items in deepwater operating budgets.
Which Region Is Growing Fastest in the AI in Oil & Gas Market?
Middle East & Africa is growing fastest in the AI in Oil & Gas market, at a 23.6% CAGR through 2033 from 15.0% share in 2026. National oil companies in Saudi Arabia, the United Arab Emirates, Qatar and Kuwait fund centralised digital programmes with multi-year budgets, and their integrated control centres give models unusually broad operational reach.
Scale helps: very large fields with standardised well designs produce consistent data, which improves model transfer between assets. Autonomous directional drilling and remote operations centres have moved past pilot stage in the Gulf. Barriers persist elsewhere, including limited connectivity and skills in parts of Africa, and ageing instrumentation that cannot supply the sampling rates models need. The main opportunity is emissions quantification tied to low-carbon export credentials for gas shipments.
Competitive Landscape
The AI in oil and gas market is moderately concentrated, with three distinct vendor groups competing for the same budgets. Oilfield service majors hold the strongest position in subsurface and drilling applications, because they own the measurement hardware, the historical interpretation archives and the rig-floor equipment that executes an automated instruction. Industrial automation and process control suppliers lead in refining, rotating equipment and safety monitoring, where models must sit inside existing control architectures. Cloud and foundation model providers supply the underlying compute and language capability, usually through the operator’s enterprise agreement rather than a direct oilfield contract. A fourth group of specialist software firms competes in narrow niches such as emissions detection and inspection vision.
Competition turns on domain validation evidence rather than raw model performance. Buyers ask how a model behaved on assets similar to theirs, how false positive rates were measured, and who signs off on retraining. Integration with existing control and historian systems is decisive, since a model that cannot read live process data is unusable. Pricing models vary widely, from per-seat subscriptions for generative assistants to outcome-linked arrangements tied to drilling days saved. New entrants typically arrive through a single high-value workflow, most often methane plume detection or visual inspection, then widen scope once trust is established.
Strategic moves across the sector centre on partnership rather than acquisition. Service companies pair domain data with external foundation models, automation suppliers embed inference directly in controllers and cameras, and cloud providers build energy-specific reference architectures that respect network segmentation requirements. Several vendors are investing in model evaluation tooling so customers can audit behaviour independently.
Strategic direction is converging on governance and edge capability. Vendors expect buyers to demand model registers, version control, documented validation and local inference, and they are building those capabilities into standard product rather than treating them as professional services work.
AI in Oil & Gas Industry Leaders
- SLB
- Halliburton Company
- Baker Hughes Company
- Honeywell International Inc.
- Microsoft Corporation
Recent Industry Developments
March 2024: The United States Environmental Protection Agency final methane standards for new and existing oil and natural gas sources were published in the Federal Register – they allow advanced measurement technologies in place of prescribed survey schedules, creating direct demand for detection models.
July 2024: Regulation (EU) 2024/1689, the European Union Artificial Intelligence Act, was published in the Official Journal – it introduced risk-tier classification, documentation and human oversight duties that now shape how operators specify systems at tender.
July 2024: NIST released the generative artificial intelligence profile of its Artificial Intelligence Risk Management Framework – it gave energy companies a recognised structure for assessing provenance, hallucination and access control before approving assistants.
August 2024: Regulation (EU) 2024/1787 on methane emissions reduction in the energy sector entered into force – its source-level measurement and verification duties converted methane quantification from an estimate into an auditable data processing task.
August 2026: The main body of obligations under the European Union Artificial Intelligence Act became applicable, including the high-risk classification regime – it set a hard compliance deadline for systems used in safety-relevant industrial settings.
AI in Oil & Gas Market Report Scope
| Metric | Value |
| Study Period | 2020–2033 |
| Market Size 2026 | US$ 4.4 Billion |
| Market Size 2033 | US$ 15.4 Billion |
| CAGR 2026–2033 | 19.6% |
| Absolute Dollar Opportunity | US$ 11.0 Billion |
| Largest Market | North America (42.5% share in 2026) |
| Fastest-Growing Market | Middle East & Africa (23.6% CAGR) |
| Market Concentration | Medium |
| Major Players | SLB, Halliburton Company, Baker Hughes Company, Honeywell International Inc. |
This report covers artificial intelligence models and autonomy applied across oil and gas operations, counting AI software licences, implementation and managed services, and AI embedded in equipment and instrumentation. Data platforms, historians and analytics infrastructure are covered separately. Excluded are general enterprise IT and non-AI automation. Base year is 2025, and the forecast period runs 2026 to 2033, expressed in US$ Billion.
AI in Oil & Gas Market Segmentation
Technology
- Machine Learning & Deep Learning
- Computer Vision
- Reinforcement Learning & Control Optimization
- Generative AI & Large Language Models
Application
- Subsurface Interpretation & Reservoir Characterization
- Predictive & Prescriptive Maintenance
- Drilling Automation
- Production Optimization
- Health, Safety and Inspection Monitoring
- Methane Detection & Emissions Quantification
- Engineering Knowledge & Field Reporting
Deployment
- On-Premise
- Cloud
- Edge
Value Chain Stream
- Upstream
- Midstream
- Downstream
Regions
- North America
- Europe
- Asia Pacific
- Latin America
- Middle East & Africa
- Executive Summary
- Global AI in Oil & Gas Market Snapshot
- Future Projections
- Key Report Takeaways
- Regional Snapshot
- Market Overview
- Market Definition and Report Scope
- Historical Trends 2020–2025
- Market Dynamics
- Drivers
- Methane Measurement Rules Create a Dedicated AI Workload in Plume Detection
- Technical Workforce Attrition Pushes Operators Toward Prescriptive Maintenance Models
- Restraints
- Validation and Liability Questions Stall AI Deployment in Safety-Critical Operations
- Scarce Labelled Failure Data Caps Model Accuracy Across Oil and Gas Assets
- Market Opportunities
- Generative Assistants for Technical Documentation Open a Seat-Based Revenue Pool
- Autonomous Directional Drilling Shifts Vendors Toward Outcome-Based Contracting
- Drivers
- Global AI in Oil & Gas Market Outlook, 2020–2033
- Global AI in Oil & Gas Market Outlook, by Technology, Value (US$ Billion), 2020–2033
- Machine Learning & Deep Learning
- Computer Vision
- Reinforcement Learning & Control Optimization
- Generative AI & Large Language Models
- Global AI in Oil & Gas Market Outlook, by Application, Value (US$ Billion), 2020–2033
- Subsurface Interpretation & Reservoir Characterization
- Predictive & Prescriptive Maintenance
- Drilling Automation
- Production Optimization
- Health, Safety and Inspection Monitoring
- Methane Detection & Emissions Quantification
- Engineering Knowledge & Field Reporting
- Global AI in Oil & Gas Market Outlook, by Deployment, Value (US$ Billion), 2020–2033
- On-Premise
- Cloud
- Edge
- Global AI in Oil & Gas Market Outlook, by Value Chain Stream, Value (US$ Billion), 2020–2033
- Upstream
- Midstream
- Downstream
- Global AI in Oil & Gas Market Outlook, by Region, Value (US$ Billion), 2020–2033
- North America
- Europe
- Asia Pacific
- Latin America
- Middle East & Africa
- Global AI in Oil & Gas Market Outlook, by Technology, Value (US$ Billion), 2020–2033
- North America AI in Oil & Gas Market Outlook, 2020–2033
- North America AI in Oil & Gas Market Outlook, by Technology, Value (US$ Billion), 2020–2033
- Machine Learning & Deep Learning
- Computer Vision
- Reinforcement Learning & Control Optimization
- Generative AI & Large Language Models
- North America AI in Oil & Gas Market Outlook, by Application, Value (US$ Billion), 2020–2033
- Subsurface Interpretation & Reservoir Characterization
- Predictive & Prescriptive Maintenance
- Drilling Automation
- Production Optimization
- Health, Safety and Inspection Monitoring
- Methane Detection & Emissions Quantification
- Engineering Knowledge & Field Reporting
- North America AI in Oil & Gas Market Outlook, by Deployment, Value (US$ Billion), 2020–2033
- On-Premise
- Cloud
- Edge
- North America AI in Oil & Gas Market Outlook, by Value Chain Stream, Value (US$ Billion), 2020–2033
- Upstream
- Midstream
- Downstream
- North America AI in Oil & Gas Market Outlook, by Country, Value (US$ Billion), 2020–2033
- United States AI in Oil & Gas Market Outlook, by Technology, 2020–2033
- United States AI in Oil & Gas Market Outlook, by Application, 2020–2033
- United States AI in Oil & Gas Market Outlook, by Deployment, 2020–2033
- United States AI in Oil & Gas Market Outlook, by Value Chain Stream, 2020–2033
- Canada AI in Oil & Gas Market Outlook, by Technology, 2020–2033
- Canada AI in Oil & Gas Market Outlook, by Application, 2020–2033
- Canada AI in Oil & Gas Market Outlook, by Deployment, 2020–2033
- Canada AI in Oil & Gas Market Outlook, by Value Chain Stream, 2020–2033
- North America AI in Oil & Gas Market Outlook, by Technology, Value (US$ Billion), 2020–2033
- Europe AI in Oil & Gas Market Outlook, 2020–2033
- Europe AI in Oil & Gas Market Outlook, by Technology, Value (US$ Billion), 2020–2033
- Machine Learning & Deep Learning
- Computer Vision
- Reinforcement Learning & Control Optimization
- Generative AI & Large Language Models
- Europe AI in Oil & Gas Market Outlook, by Application, Value (US$ Billion), 2020–2033
- Subsurface Interpretation & Reservoir Characterization
- Predictive & Prescriptive Maintenance
- Drilling Automation
- Production Optimization
- Health, Safety and Inspection Monitoring
- Methane Detection & Emissions Quantification
- Engineering Knowledge & Field Reporting
- Europe AI in Oil & Gas Market Outlook, by Deployment, Value (US$ Billion), 2020–2033
- On-Premise
- Cloud
- Edge
- Europe AI in Oil & Gas Market Outlook, by Value Chain Stream, Value (US$ Billion), 2020–2033
- Upstream
- Midstream
- Downstream
- Europe AI in Oil & Gas Market Outlook, by Country, Value (US$ Billion), 2020–2033
- Norway AI in Oil & Gas Market Outlook, by Technology, 2020–2033
- Norway AI in Oil & Gas Market Outlook, by Application, 2020–2033
- Norway AI in Oil & Gas Market Outlook, by Deployment, 2020–2033
- Norway AI in Oil & Gas Market Outlook, by Value Chain Stream, 2020–2033
- United Kingdom AI in Oil & Gas Market Outlook, by Technology, 2020–2033
- United Kingdom AI in Oil & Gas Market Outlook, by Application, 2020–2033
- United Kingdom AI in Oil & Gas Market Outlook, by Deployment, 2020–2033
- United Kingdom AI in Oil & Gas Market Outlook, by Value Chain Stream, 2020–2033
- Netherlands AI in Oil & Gas Market Outlook, by Technology, 2020–2033
- Netherlands AI in Oil & Gas Market Outlook, by Application, 2020–2033
- Netherlands AI in Oil & Gas Market Outlook, by Deployment, 2020–2033
- Netherlands AI in Oil & Gas Market Outlook, by Value Chain Stream, 2020–2033
- Europe AI in Oil & Gas Market Outlook, by Technology, Value (US$ Billion), 2020–2033
- Asia Pacific AI in Oil & Gas Market Outlook, 2020–2033
- Asia Pacific AI in Oil & Gas Market Outlook, by Technology, Value (US$ Billion), 2020–2033
- Machine Learning & Deep Learning
- Computer Vision
- Reinforcement Learning & Control Optimization
- Generative AI & Large Language Models
- Asia Pacific AI in Oil & Gas Market Outlook, by Application, Value (US$ Billion), 2020–2033
- Subsurface Interpretation & Reservoir Characterization
- Predictive & Prescriptive Maintenance
- Drilling Automation
- Production Optimization
- Health, Safety and Inspection Monitoring
- Methane Detection & Emissions Quantification
- Engineering Knowledge & Field Reporting
- Asia Pacific AI in Oil & Gas Market Outlook, by Deployment, Value (US$ Billion), 2020–2033
- On-Premise
- Cloud
- Edge
- Asia Pacific AI in Oil & Gas Market Outlook, by Value Chain Stream, Value (US$ Billion), 2020–2033
- Upstream
- Midstream
- Downstream
- Asia Pacific AI in Oil & Gas Market Outlook, by Country, Value (US$ Billion), 2020–2033
- China AI in Oil & Gas Market Outlook, by Technology, 2020–2033
- China AI in Oil & Gas Market Outlook, by Application, 2020–2033
- China AI in Oil & Gas Market Outlook, by Deployment, 2020–2033
- China AI in Oil & Gas Market Outlook, by Value Chain Stream, 2020–2033
- India AI in Oil & Gas Market Outlook, by Technology, 2020–2033
- India AI in Oil & Gas Market Outlook, by Application, 2020–2033
- India AI in Oil & Gas Market Outlook, by Deployment, 2020–2033
- India AI in Oil & Gas Market Outlook, by Value Chain Stream, 2020–2033
- Australia AI in Oil & Gas Market Outlook, by Technology, 2020–2033
- Australia AI in Oil & Gas Market Outlook, by Application, 2020–2033
- Australia AI in Oil & Gas Market Outlook, by Deployment, 2020–2033
- Australia AI in Oil & Gas Market Outlook, by Value Chain Stream, 2020–2033
- Malaysia AI in Oil & Gas Market Outlook, by Technology, 2020–2033
- Malaysia AI in Oil & Gas Market Outlook, by Application, 2020–2033
- Malaysia AI in Oil & Gas Market Outlook, by Deployment, 2020–2033
- Malaysia AI in Oil & Gas Market Outlook, by Value Chain Stream, 2020–2033
- Indonesia AI in Oil & Gas Market Outlook, by Technology, 2020–2033
- Indonesia AI in Oil & Gas Market Outlook, by Application, 2020–2033
- Indonesia AI in Oil & Gas Market Outlook, by Deployment, 2020–2033
- Indonesia AI in Oil & Gas Market Outlook, by Value Chain Stream, 2020–2033
- Asia Pacific AI in Oil & Gas Market Outlook, by Technology, Value (US$ Billion), 2020–2033
- Latin America AI in Oil & Gas Market Outlook, 2020–2033
- Latin America AI in Oil & Gas Market Outlook, by Technology, Value (US$ Billion), 2020–2033
- Machine Learning & Deep Learning
- Computer Vision
- Reinforcement Learning & Control Optimization
- Generative AI & Large Language Models
- Latin America AI in Oil & Gas Market Outlook, by Application, Value (US$ Billion), 2020–2033
- Subsurface Interpretation & Reservoir Characterization
- Predictive & Prescriptive Maintenance
- Drilling Automation
- Production Optimization
- Health, Safety and Inspection Monitoring
- Methane Detection & Emissions Quantification
- Engineering Knowledge & Field Reporting
- Latin America AI in Oil & Gas Market Outlook, by Deployment, Value (US$ Billion), 2020–2033
- On-Premise
- Cloud
- Edge
- Latin America AI in Oil & Gas Market Outlook, by Value Chain Stream, Value (US$ Billion), 2020–2033
- Upstream
- Midstream
- Downstream
- Latin America AI in Oil & Gas Market Outlook, by Country, Value (US$ Billion), 2020–2033
- Brazil AI in Oil & Gas Market Outlook, by Technology, 2020–2033
- Brazil AI in Oil & Gas Market Outlook, by Application, 2020–2033
- Brazil AI in Oil & Gas Market Outlook, by Deployment, 2020–2033
- Brazil AI in Oil & Gas Market Outlook, by Value Chain Stream, 2020–2033
- Argentina AI in Oil & Gas Market Outlook, by Technology, 2020–2033
- Argentina AI in Oil & Gas Market Outlook, by Application, 2020–2033
- Argentina AI in Oil & Gas Market Outlook, by Deployment, 2020–2033
- Argentina AI in Oil & Gas Market Outlook, by Value Chain Stream, 2020–2033
- Mexico AI in Oil & Gas Market Outlook, by Technology, 2020–2033
- Mexico AI in Oil & Gas Market Outlook, by Application, 2020–2033
- Mexico AI in Oil & Gas Market Outlook, by Deployment, 2020–2033
- Mexico AI in Oil & Gas Market Outlook, by Value Chain Stream, 2020–2033
- Colombia AI in Oil & Gas Market Outlook, by Technology, 2020–2033
- Colombia AI in Oil & Gas Market Outlook, by Application, 2020–2033
- Colombia AI in Oil & Gas Market Outlook, by Deployment, 2020–2033
- Colombia AI in Oil & Gas Market Outlook, by Value Chain Stream, 2020–2033
- Latin America AI in Oil & Gas Market Outlook, by Technology, Value (US$ Billion), 2020–2033
- Middle East & Africa AI in Oil & Gas Market Outlook, 2020–2033
- Middle East & Africa AI in Oil & Gas Market Outlook, by Technology, Value (US$ Billion), 2020–2033
- Machine Learning & Deep Learning
- Computer Vision
- Reinforcement Learning & Control Optimization
- Generative AI & Large Language Models
- Middle East & Africa AI in Oil & Gas Market Outlook, by Application, Value (US$ Billion), 2020–2033
- Subsurface Interpretation & Reservoir Characterization
- Predictive & Prescriptive Maintenance
- Drilling Automation
- Production Optimization
- Health, Safety and Inspection Monitoring
- Methane Detection & Emissions Quantification
- Engineering Knowledge & Field Reporting
- Middle East & Africa AI in Oil & Gas Market Outlook, by Deployment, Value (US$ Billion), 2020–2033
- On-Premise
- Cloud
- Edge
- Middle East & Africa AI in Oil & Gas Market Outlook, by Value Chain Stream, Value (US$ Billion), 2020–2033
- Upstream
- Midstream
- Downstream
- Middle East & Africa AI in Oil & Gas Market Outlook, by Country, Value (US$ Billion), 2020–2033
- Saudi Arabia AI in Oil & Gas Market Outlook, by Technology, 2020–2033
- Saudi Arabia AI in Oil & Gas Market Outlook, by Application, 2020–2033
- Saudi Arabia AI in Oil & Gas Market Outlook, by Deployment, 2020–2033
- Saudi Arabia AI in Oil & Gas Market Outlook, by Value Chain Stream, 2020–2033
- United Arab Emirates AI in Oil & Gas Market Outlook, by Technology, 2020–2033
- United Arab Emirates AI in Oil & Gas Market Outlook, by Application, 2020–2033
- United Arab Emirates AI in Oil & Gas Market Outlook, by Deployment, 2020–2033
- United Arab Emirates AI in Oil & Gas Market Outlook, by Value Chain Stream, 2020–2033
- Qatar AI in Oil & Gas Market Outlook, by Technology, 2020–2033
- Qatar AI in Oil & Gas Market Outlook, by Application, 2020–2033
- Qatar AI in Oil & Gas Market Outlook, by Deployment, 2020–2033
- Qatar AI in Oil & Gas Market Outlook, by Value Chain Stream, 2020–2033
- Kuwait AI in Oil & Gas Market Outlook, by Technology, 2020–2033
- Kuwait AI in Oil & Gas Market Outlook, by Application, 2020–2033
- Kuwait AI in Oil & Gas Market Outlook, by Deployment, 2020–2033
- Kuwait AI in Oil & Gas Market Outlook, by Value Chain Stream, 2020–2033
- Middle East & Africa AI in Oil & Gas Market Outlook, by Technology, Value (US$ Billion), 2020–2033
- Competitive Landscape
- Market Concentration and Industry Leaders
- Competitive Differentiation
- Strategic Moves and Market Direction
- Recent Industry Developments
- Company Profiles
- SLB
- Halliburton Company
- Baker Hughes Company
- Honeywell International Inc.
- ABB Ltd
- Siemens AG
- Emerson Electric Co.
- Microsoft Corporation
- International Business Machines Corporation
- Google LLC
- Amazon Web Services, Inc.
- NVIDIA Corporation
- Accenture plc
- C3.ai, Inc.
- Appendix
- Research Methodology
- Report Assumptions
- Acronyms and Abbreviations
Technology
- Machine Learning & Deep Learning
- Computer Vision
- Reinforcement Learning & Control Optimization
- Generative AI & Large Language Models
Application
- Subsurface Interpretation & Reservoir Characterization
- Predictive & Prescriptive Maintenance
- Drilling Automation
- Production Optimization
- Health, Safety and Inspection Monitoring
- Methane Detection & Emissions Quantification
- Engineering Knowledge & Field Reporting
Deployment
- On-Premise
- Cloud
- Edge
Value Chain Stream
- Upstream
- Midstream
- Downstream
Regions
- North America
- Europe
- Asia Pacific
- Latin America
- Middle East & Africa
Our Research Methodology
Considering the volatility of business today, traditional approaches to strategizing a game plan can be unfruitful if not detrimental. True ambiguity is no way to determine a forecast. A myriad of predetermined factors must be accounted for such as the degree of risk involved, the magnitude of circumstances, as well as conditions or consequences that are not known or unpredictable. To circumvent binary views that cast uncertainty, the application of market research intelligence to strategically posture, move, and enable actionable outcomes is necessary.
View Methodology
Quality Assured
Rigorous Validation Process

Confidentiality Assured
End-to-end Data Security

Custom Research Services
Tailored To Your Objectives
FAQs
The market is valued at US$ 4.4 billion in 2026, counting AI software, related services and artificial intelligence embedded in field equipment and instrumentation.
The market is projected to reach US$ 15.4 billion by 2033 at a 19.6% CAGR, an absolute opportunity of US$ 11.0 billion.
Subsurface Interpretation & Reservoir Characterization leads with 24.0% share in 2026, because seismic datasets are large, well labelled and commercially decisive.
Generative AI & Large Language Models grows fastest among technologies at 28.9%, while Methane Detection & Emissions Quantification leads applications at 26.4%.
North America holds 42.5% share in 2026, and the market is moderately concentrated across service majors, automation suppliers and cloud providers.
Related Reports
Power EPC Market Size, Share, Insights, Competitive Landscape, and Forecast 2026 to 2033
Power EPC Market is projected to rise from US$ 780.56 billion in 2026 to US$ 1,220.97 billion by 2033 at a 6.6% CAGR. Explore generation and project trends.
Port Electrification Market Size, Share, Insights, Competitive Landscape, and Forecast 2026 to 2033
Explore the port electrification market, valued at US$ 6.8 billion in 2026 and forecast to reach US$ 16.4 billion by 2033, growing at a 13.4% CAGR.
Polycrystalline Solar Cell Market Size, Share, Insights, Competitive Landscape, and Forecast 2026 to 2033
Explore the polycrystalline solar cell market, valued at US$ 5.4 billion in 2026 and projected to reach US$ 6.6 billion by 2033, growing at 2.9% CAGR.
Synchronous Condenser Market Size, Share, Insights, Competitive Landscape, and Forecast 2026 to 2033
The global synchronous condenser market is valued at US$1.20 billion in 2026, reaching US$1.50 billion by 2033, growing at a 3.2% CAGR
Water and Wastewater Treatment Market Size, Share, Insights, Competitive Landscape, and Forecast 2026 to 2033
Water and wastewater treatment market to reach US$ 508.0 billion by 2033 from US$ 345.0 billion in 2026 at a 5.7% CAGR. Explore trends, segments and regions.
Vehicle-to-Grid Technology Market Size, Share, Insights, Competitive Landscape, and Forecast 2026 to 2033
Explore the vehicle-to-grid technology market, forecast to reach US$6.9 billion by 2033 at 28.4% CAGR, with component, application and regional insights.