



LNG Carrier Market
LNG Carrier Market Size, Share, Insights, Competitive Landscape, and Forecast 2026 to 2033
LNG Carrier Market Size and Trend Analysis
What Is the Outlook for LNG Carrier Newbuilding Through 2033?
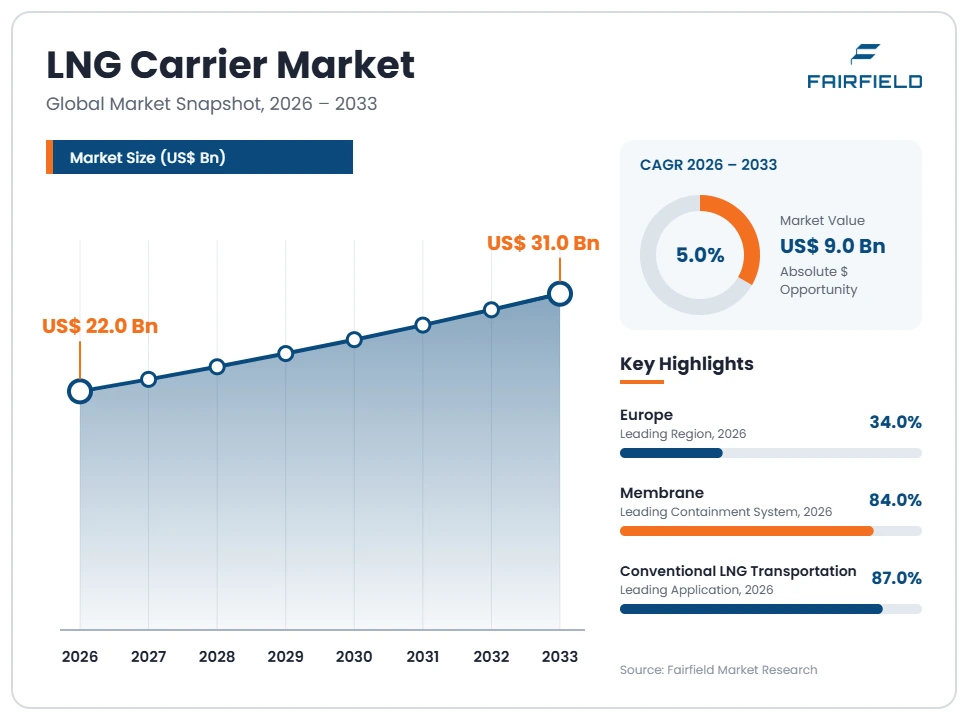
The global LNG carrier market size is expected to be valued at US$ 22.0 billion in 2026 and projected to reach US$ 31.0 billion by 2033, growing at a CAGR of 5.0% between 2026 and 2033.
This study sizes the market as the contract value of LNG carriers, including purpose-built and converted floating regasification tonnage, delivered from shipyards in each calendar year. It does not measure charter earnings or the market value of the trading fleet, which are far larger and move on different cycles. Between 2020 and 2025 delivered newbuild value rose at roughly 12.4% annually as a record ordering wave worked through the yards. Growth now moderates because berth capacity at qualified builders is finite, liquefaction final investment decisions set the ordering pace, and carbon intensity rules are reshaping replacement demand rather than adding volume.
Key Report Takeaways
- By Containment System: Membrane designs held 84% share in 2026, while Type C and other small-scale containment is projected to expand at an 8.1% CAGR through 2033, driven by coastal distribution and bunkering tonnage orders.
- By Vessel Size: Conventional 120,000–180,000 cubic metre vessels held 66% share in 2026, while Q-Flex and Q-Max tonnage is projected to grow at an 8.9% CAGR through 2033 on long-haul Middle Eastern export economics.
- By Propulsion: Two-stroke dual-fuel engines held 72% share in 2026, while alternative-fuel-ready and carbon capture configurations are projected to expand at a 12.6% CAGR through 2033 as owners hedge future fuel regulation.
- By Application: Conventional LNG transportation held 87% share in 2026, while LNG bunkering vessels are projected to grow at a 10.2% CAGR through 2033, supported by dual-fuel merchant fleet growth at major ports.
- By Geography: Europe held 34% share of contracted owner demand in 2026, while Middle East & Africa is projected to grow at a 7.6% CAGR through 2033 on national fleet expansion programmes.
Global LNG Carrier Market Trends and Insights
Drivers Impact Analysis
Two forces set the pace of LNG carrier ordering and delivery value over the forecast period.
| Driver | Impact on CAGR Forecast | Geographic Relevance | Impact Timeline |
| Liquefaction export capacity build-out and project sanctioning | High | North America, Middle East & Africa | Medium term (2–4 years) |
| Carbon intensity rules forcing replacement of steam turbine tonnage | High | Global | Long term (≥4 years) |
Liquefaction Project Sanctioning Sets the Pace of LNG Carrier Ordering
New export capacity, not general trade growth, determines how many carriers are ordered. Each liquefaction train requires a dedicated shipping solution contracted years before first cargo, so a final investment decision converts within months into tonnage commitments. Project developers and offtakers then fix long-term charters that underwrite the newbuild, which is why delivered carrier value tracks the export capacity curve closely rather than consumption.
The mechanism is contractual and physical. Capacity additions on the United States Gulf Coast and the expansion of Qatari production add long-haul voyages that consume far more ship days per tonne than regional trades. Atlantic basin cargoes moving to Asia need more vessels per million tonnes than intra-regional supply. Lenders require committed shipping before drawdown, so the shipping order is embedded in project financing rather than left to the spot market.
Carbon Intensity Rules Are Accelerating Replacement of Steam Turbine LNG Tonnage
Emissions regulation is converting an ageing fleet into firm newbuild demand. Steam turbine carriers burn substantially more fuel per cargo tonne-mile than modern two-stroke dual-fuel vessels, which pushes them toward poor ratings under the Carbon Intensity Indicator scheme and makes them progressively harder to charter. Charterers with their own emissions targets avoid them, so commercial obsolescence arrives well before structural life ends.
The cause is explicit and dated regulation. The Energy Efficiency Existing Ship Index and the Carbon Intensity Indicator took effect at the start of 2023 under MARPOL Annex VI, inclusion of shipping in the EU Emissions Trading System put a direct price on each tonne of carbon dioxide, and FuelEU Maritime sets a declining greenhouse gas intensity limit on energy used on board. Together these raise the operating cost gap between old and new tonnage every year, shortening economic life and pulling replacement orders forward.
Restraints Impact Analysis
Two constraints limit how quickly delivered carrier value can expand.
| Restraint | Impact on CAGR Forecast | Geographic Relevance | Impact Timeline |
| Shipyard berth capacity and membrane licence throughput limits | High | Asia Pacific | Medium term (2–4 years) |
| Charter rate volatility and investment timing risk for owners | High | Europe, North America, Asia Pacific | Short term (≤2 years) |
Shipyard Capacity Limits Cap How Many LNG Carriers Can Be Delivered
Capacity, not demand, is the binding constraint on delivered volume. A small number of yards in South Korea and China, with a limited Japanese presence, can build large gas carriers to the required standard. When their berths are full, delivery slots stretch several years ahead and additional orders raise prices rather than output. Delivered value therefore responds to ordering waves with a long lag.
The cause is specialised and hard to replicate. Membrane containment requires licensed insulation and cryogenic barrier installation by certified teams, and the welding, dock and cryogenic test facilities cannot be improvised. Skilled labour shortages at Korean yards have constrained throughput even with full orderbooks. Yards also allocate scarce berths across container, tanker and offshore work, choosing the highest-margin mix, which limits how much capacity LNG tonnage can command in any year.
Charter Rate Volatility Makes Speculative LNG Carrier Investment Difficult to Finance
Rate volatility suppresses uncommitted ordering. Spot earnings for large gas carriers can move from historic highs to levels below operating cost within a single year, driven by small mismatches between fleet supply and cargo availability. An owner committing a very large sum for delivery three or four years out cannot forecast the rate environment on arrival, so speculative orders are rare and the market depends on charter-backed commitments.
The underlying cause is structural inelasticity on both sides. Liquefaction capacity and vessel supply both arrive in large, indivisible steps after long lead times, so the fleet is rarely in balance. A delayed train or an early vessel delivery swings utilisation sharply. Banks price that risk into loan terms, demanding long charters with creditworthy counterparties, and without such cover the equity cost of a newbuild rises to levels most owners will not accept.
Market Opportunities
Two revenue pools sit outside the conventional long-haul newbuild programme.
Floating Regasification Conversions Open a Faster, Lower-Cost Revenue Pool
Converting existing carriers into floating storage and regasification units is a distinct and profitable revenue pool. Conversion delivers import capacity far faster than an onshore terminal and at a fraction of the cost, and it gives older steam turbine vessels a second economic life as largely stationary assets where fuel efficiency and carbon intensity matter much less than they do in trading service.
Conversion yards, topside regasification equipment suppliers and owners of mid-life tonnage can capture this pool, while national gas importers and utilities seeking rapid supply security create the demand. Energy security policy in Europe and fast-growing import demand in emerging Asian and African markets support continued activity. Because conversion scope is modular and schedules are short, the work also fits yards without the licensed membrane capability required for newbuilding, broadening the supplier base considerably.
Small-Scale and Bunkering Tonnage Creates a New Order Stream Outside Long-Haul Trades
Small-scale carriers and dedicated bunker vessels form an order stream that is largely independent of liquefaction project cycles. These ships serve coastal distribution, island supply, inland waterway terminals and ship-to-ship refuelling of dual-fuel merchant vessels. Unit values are modest, but order volumes are higher, construction is faster, and the work is accessible to mid-tier yards excluded from conventional carrier building.
Port authorities, bunker suppliers and regional gas distributors generate the demand, while shipowners operating dual-fuel container ships and car carriers create the underlying need. The growth of LNG-fuelled merchant tonnage requires bunkering infrastructure at major hubs, and emissions regulation on energy used on board makes gas bunkering commercially attractive. Type C containment suits these sizes, avoiding membrane licence constraints and shortening delivery schedules materially. Repeat orders from established bunker operators also give builders useful series production economics on standardised designs.
Segment Analysis
- By Containment System: Membrane Designs Dominate While Type C Tonnage Expands Fastest
Membrane containment holds 84% of the LNG carrier market in 2026. Its dominance rests on superior volumetric efficiency within a given hull, lower steel weight per cubic metre of cargo and canal transit compatibility, which together make it the default for conventional and large tonnage. Type C and other small-scale containment is the fastest-growing category at an 8.1% CAGR through 2033, because pressure-vessel tanks handle boil-off and partial filling far better on short, frequent voyages and suit bunkering and coastal distribution duty. Moss spherical designs remain in service and retain support for specific applications, including ice-class and some floating storage roles, but attract few new orders. The commercial implication is that membrane licence access remains a gatekeeper for conventional newbuilding, while small-scale demand can be served by a much wider group of shipbuilders.
- By Vessel Size: Conventional Carriers Lead While Q-Flex and Q-Max Tonnage Grows Fastest
Conventional vessels of 120,000 to 180,000 cubic metres account for 66% of market value in 2026. This size band is the trade standard because it fits the main import terminals, transits the Panama Canal in current specifications and matches typical cargo lot sizes. Q-Flex and Q-Max tonnage above 180,000 cubic metres is the fastest-growing band at an 8.9% CAGR through 2033, driven by Qatari fleet expansion where very large parcels on long, fixed routes deliver the lowest unit transport cost. Mid-size vessels between 40,000 and 120,000 cubic metres serve niche trades and constrained terminals. Small-scale tonnage below 40,000 cubic metres grows steadily on distribution duty. For shipyards, the size mix matters because the largest vessels occupy the biggest docks and crowd out other work.
- By Propulsion: Two-Stroke Dual-Fuel Leads as Alternative-Fuel-Ready Designs Accelerate
Two-stroke dual-fuel propulsion, covering high-pressure and low-pressure gas injection engines, holds 72% of the market in 2026. It is the standard specification because it cuts fuel consumption materially against earlier systems, reduces methane slip relative to four-stroke alternatives and improves ratings under the Carbon Intensity Indicator. Alternative-fuel-ready and carbon capture configurations form the fastest-growing propulsion category at a 12.6% CAGR through 2033, from a small base, as owners specify ammonia-ready arrangements, shaft generators, air lubrication and onboard capture readiness to protect future compliance. Tri-fuel diesel-electric vessels remain a large part of the trading fleet but attract limited new orders. Steam turbine propulsion is in managed decline. The implication is that specification complexity is rising, which favours yards and designers with deep engineering capacity.
- By Application: Conventional Transportation Leads While Bunkering Vessels Grow Quickest
Conventional LNG transportation represents 87% of delivered value in 2026, the overwhelming majority of the market. Long-haul cargo movement from export projects to import terminals is the reason the vessel class exists, and trade-linked newbuilding dominates every orderbook. LNG bunkering vessels are the fastest-growing application at a 10.2% CAGR through 2033, as the dual-fuel merchant fleet expands and ports compete to offer gas bunkering alongside conventional supply. Floating storage and regasification units remain a significant and strategically important application, delivered both as purpose-built newbuildings and as conversions of trading tonnage. Floating storage units form a smaller category used for peak shaving and transhipment. For builders, the practical implication is that non-trading applications now provide useful order flow when the conventional newbuild cycle turns down.
Geography Analysis
Regional shares in this report reflect the domicile of the contracting owner or charterer, not the country of construction. Construction is deliberately excluded as a basis because building capability is concentrated in a small group of Korean, Chinese and Japanese yards, which would reduce the regional picture to a single location and obscure where ownership, chartering and investment decisions are actually made.
- North America Shapes Demand Through Export Project Shipping Commitments
North America accounts for 15% of contracted owner demand in 2026. The United States is the decisive influence, not through ship ownership but through the volume of export capacity sanctioned on the Gulf Coast, which converts into long-term charter commitments that underwrite newbuildings. American project developers and portfolio players increasingly take vessels directly on long charter or through tonnage providers to control their own logistics. Canadian west coast export projects add Pacific-facing voyages with shorter transits to Asian buyers. The principal regional barrier is permitting and construction timetable risk on new trains, which delays the associated shipping commitments. The change to watch is the growing willingness of American offtakers to hold shipping positions directly, which gradually shifts contracted tonnage toward the region.
- Which Region Is Leading the LNG Carrier Market?
Europe leads the LNG carrier market with 34% of contracted owner demand in 2026, the largest regional position. Greek owners dominate independent gas shipping, supported by deep access to ship finance and decades of accumulated operating experience in the sector. Norwegian, Belgian, Spanish and United Kingdom owners and energy majors add substantial controlled tonnage, while European energy companies with global portfolios charter extensively to serve both domestic and Asian delivery points. Regional energy security policy after the loss of pipeline supply drove a durable increase in seaborne import dependence and floating regasification capacity. Regulatory exposure is also highest here, since the EU Emissions Trading System and FuelEU Maritime apply to voyages touching the region. The defining change is accelerating replacement of older tonnage by regionally domiciled owners.
- Asia Pacific Combines Shipbuilding Capability With Major Importer Ownership
Asia Pacific holds 30% of contracted owner demand in 2026 and remains the centre of construction capability for the vessel class. Japanese owners control large fleets built around long-term affreightment contracts with domestic utilities, and Japanese trading houses hold significant equity in tonnage. Chinese state-linked owners have expanded rapidly alongside domestic import growth and national fleet policy, while South Korean and Indian importers increasingly contract their own vessels rather than buying delivered cargoes. Regional importers in Taiwan and Thailand add steady charter demand. The main constraint is competition for yard slots against container and tanker orders during strong commercial cycles. The important regional change is the maturing of Chinese membrane construction capability, which adds genuine supply alternatives and tempers newbuilding price escalation.
- Latin America Builds Modest Ownership Around Import and Floating Regasification Needs
Latin America represents 4% of contracted owner demand in 2026, the smallest regional position. Brazil, Argentina, Chile, Mexico and the Dominican Republic account for most activity, and demand is weighted toward chartered floating storage and regasification capacity rather than owned trading tonnage. Seasonal and hydrology-driven power generation needs make flexible, short-term import solutions more attractive than long-term vessel ownership. Argentine export ambitions from unconventional gas resources could change that balance if liquefaction projects proceed, since export schemes require committed shipping. The main barriers are sovereign and counterparty credit risk, currency exposure on dollar-denominated charters and limited domestic ship finance. The clearest opportunity is charter-in of mid-life converted tonnage, which matches regional demand profiles without requiring newbuild capital commitments.
- Which Region Is Growing Fastest in the LNG Carrier Market?
Middle East & Africa is growing fastest in the LNG carrier market, at a 7.6% CAGR between 2026 and 2033 from a 17% share of contracted owner demand in 2026. Qatar is the principal driver, where a very large national fleet renewal and expansion programme is tied directly to production growth and long-haul delivery commitments. The United Arab Emirates and Oman add further owned and chartered tonnage linked to export volumes, while Nigeria, Mozambique, Egypt and Algeria contribute African export-linked shipping demand. National ownership is strategic, giving producers control over delivery economics rather than leaving them to third parties. Barriers include project delays, security exposure in parts of the region and dependence on a narrow group of qualified builders. The defining change is the scale of the committed national fleet programmes.
Competitive Landscape
The LNG carrier market is highly concentrated at every level of the supply chain. A small group of shipyards in South Korea and China, with limited Japanese participation, accounts for nearly all large carrier construction, because membrane containment, cryogenic testing and gas trial capability take years and substantial capital to establish. HD Hyundai Heavy Industries, Samsung Heavy Industries and Hanwha Ocean anchor Korean supply, while Hudong-Zhonghua Shipbuilding, Jiangnan Shipyard and other China State Shipbuilding Corporation units have built a durable second centre of capability. Concentration is reinforced upstream, where Gaztransport & Technigaz licenses the membrane containment technology used in most conventional vessels, and in propulsion, where a narrow set of engine designs dominates.
Competition is based on delivery slot availability, price, proven boil-off and fuel consumption performance against guarantees, financing support, and track record on cryogenic quality. Owners weigh schedule certainty heavily, because a missed delivery against a charter start date carries serious commercial consequences. New competitive pressure comes mainly from Chinese yards moving up the quality curve, from conversion yards targeting floating regasification work, and from equipment suppliers offering reliquefaction, air lubrication and onboard carbon capture packages that differentiate otherwise similar hulls.
Strategic activity centres on dock capacity allocation, serial-build standardisation to protect margins, localisation of cryogenic supply chains, and partnerships between yards, classification societies and engine designers to qualify alternative-fuel-ready specifications. These moves matter competitively because they determine who can promise a credible delivery date at an acceptable price during the next ordering wave.
Strategic direction across the sector points toward design standardisation, deeper vertical integration into containment and cargo handling equipment, and careful management of order intake to avoid the overcommitment that has damaged shipbuilders in previous cycles.
Recent Industry Developments
- January 2023: The Energy Efficiency Existing Ship Index and Carbon Intensity Indicator requirements under MARPOL Annex VI took effect – directly weakening the commercial position of steam turbine gas carriers and pulling replacement demand forward.
- July 2023: The International Maritime Organization adopted its revised strategy on reduction of greenhouse gas emissions from ships – setting the long-term decarbonisation trajectory that now shapes newbuild specification choices.
- January 2024: Maritime transport entered the EU Emissions Trading System on a phased basis – placing a direct carbon price on voyages touching the region and widening the operating cost gap between old and new tonnage.
- January 2025: FuelEU Maritime greenhouse gas intensity limits began to apply to energy used on board – reinforcing demand for dual-fuel propulsion and alternative-fuel-ready specifications.
- January 2016: The amended International Code for the Construction and Equipment of Ships Carrying Liquefied Gases in Bulk, the IGC Code, entered into force – establishing the containment, materials and safety baseline that every modern gas carrier design must meet.
Companies Covered in the Report
- HD Hyundai Heavy Industries
- Samsung Heavy Industries
- Hanwha Ocean
- Hudong-Zhonghua Shipbuilding
- Jiangnan Shipyard
- China State Shipbuilding Corporation
- Mitsubishi Shipbuilding
- Gaztransport & Technigaz
- Mitsui O.S.K. Lines
- NYK Line
- Nakilat
- Maran Gas Maritime
- Knutsen OAS Shipping
- Dynagas
- Excelerate Energy
LNG Carrier Market Report Scope
| Metric | Value |
| Study Period | 2020–2033 |
| Market Size 2026 | US$ 22.0 Billion |
| Market Size 2033 | US$ 31.0 Billion |
| CAGR 2026–2033 | 5.0% |
| Absolute Dollar Opportunity | US$ 9.0 Billion |
| Largest Market | Europe |
| Fastest-Growing Market | Middle East & Africa |
| Market Concentration | High |
| Major Players | HD Hyundai Heavy Industries, Samsung Heavy Industries, Hanwha Ocean, Hudong-Zhonghua Shipbuilding, Gaztransport & Technigaz |
LNG Carrier Market Segmentation
Containment System
- Membrane
- Moss spherical
- Type C and other small-scale containment
Vessel Size
- Small-scale (below 40,000 cubic metres)
- Mid-size (40,000–120,000 cubic metres)
- Conventional (120,000–180,000 cubic metres)
- Q-Flex and Q-Max (above 180,000 cubic metres)
Propulsion
- Two-stroke dual-fuel
- Tri-fuel diesel-electric
- Steam turbine
- Alternative-fuel-ready and carbon capture configurations
Application
- Conventional LNG transportation
- Floating storage and regasification units
- Floating storage units
- LNG bunkering vessels
Regions
- North America
- Europe
- Asia Pacific
- Latin America
- Middle East & Africa
- Executive Summary
- Global LNG Carrier Market Snapshot
- Future Projections
- Key Report Takeaways
- Regional Snapshot
- Market Overview
- Market Definition and Report Scope
- Historical Trends 2020–2025
- Market Dynamics
- Drivers
- Liquefaction Project Sanctioning Sets the Pace of LNG Carrier Ordering
- Carbon Intensity Rules Are Accelerating Replacement of Steam Turbine LNG Tonnage
- Restraints
- Shipyard Capacity Limits Cap How Many LNG Carriers Can Be Delivered
- Charter Rate Volatility Makes Speculative LNG Carrier Investment Difficult to Finance
- Market Opportunities
- Floating Regasification Conversions Open a Faster, Lower-Cost Revenue Pool
- Small-Scale and Bunkering Tonnage Creates a New Order Stream Outside Long-Haul Trades
- Drivers
- Global LNG Carrier Market Outlook, 2020–2033
- Global LNG Carrier Market Outlook, by Containment System, Value (US$ Billion), 2020–2033
- Membrane
- Moss spherical
- Type C and other small-scale containment
- Global LNG Carrier Market Outlook, by Vessel Size, Value (US$ Billion), 2020–2033
- Small-scale (below 40,000 cubic metres)
- Mid-size (40,000–120,000 cubic metres)
- Conventional (120,000–180,000 cubic metres)
- Q-Flex and Q-Max (above 180,000 cubic metres)
- Global LNG Carrier Market Outlook, by Propulsion, Value (US$ Billion), 2020–2033
- Two-stroke dual-fuel
- Tri-fuel diesel-electric
- Steam turbine
- Alternative-fuel-ready and carbon capture configurations
- Global LNG Carrier Market Outlook, by Application, Value (US$ Billion), 2020–2033
- Conventional LNG transportation
- Floating storage and regasification units
- Floating storage units
- LNG bunkering vessels
- Global LNG Carrier Market Outlook, by Region, Value (US$ Billion), 2020–2033
- North America
- Europe
- Asia Pacific
- Latin America
- Middle East & Africa
- Global LNG Carrier Market Outlook, by Containment System, Value (US$ Billion), 2020–2033
- North America LNG Carrier Market Outlook, 2020–2033
- North America LNG Carrier Market Outlook, by Containment System, Value (US$ Billion), 2020–2033
- Membrane
- Moss spherical
- Type C and other small-scale containment
- North America LNG Carrier Market Outlook, by Vessel Size, Value (US$ Billion), 2020–2033
- Small-scale (below 40,000 cubic metres)
- Mid-size (40,000–120,000 cubic metres)
- Conventional (120,000–180,000 cubic metres)
- Q-Flex and Q-Max (above 180,000 cubic metres)
- North America LNG Carrier Market Outlook, by Propulsion, Value (US$ Billion), 2020–2033
- Two-stroke dual-fuel
- Tri-fuel diesel-electric
- Steam turbine
- Alternative-fuel-ready and carbon capture configurations
- North America LNG Carrier Market Outlook, by Application, Value (US$ Billion), 2020–2033
- Conventional LNG transportation
- Floating storage and regasification units
- Floating storage units
- LNG bunkering vessels
- North America LNG Carrier Market Outlook, by Country, Value (US$ Billion), 2020–2033
- United States LNG Carrier Market Outlook, by Containment System, 2020–2033
- United States LNG Carrier Market Outlook, by Vessel Size, 2020–2033
- United States LNG Carrier Market Outlook, by Propulsion, 2020–2033
- United States LNG Carrier Market Outlook, by Application, 2020–2033
- Canada LNG Carrier Market Outlook, by Containment System, 2020–2033
- Canada LNG Carrier Market Outlook, by Vessel Size, 2020–2033
- Canada LNG Carrier Market Outlook, by Propulsion, 2020–2033
- Canada LNG Carrier Market Outlook, by Application, 2020–2033
- North America LNG Carrier Market Outlook, by Containment System, Value (US$ Billion), 2020–2033
- Europe LNG Carrier Market Outlook, 2020–2033
- Europe LNG Carrier Market Outlook, by Containment System, Value (US$ Billion), 2020–2033
- Membrane
- Moss spherical
- Type C and other small-scale containment
- Europe LNG Carrier Market Outlook, by Vessel Size, Value (US$ Billion), 2020–2033
- Small-scale (below 40,000 cubic metres)
- Mid-size (40,000–120,000 cubic metres)
- Conventional (120,000–180,000 cubic metres)
- Q-Flex and Q-Max (above 180,000 cubic metres)
- Europe LNG Carrier Market Outlook, by Propulsion, Value (US$ Billion), 2020–2033
- Two-stroke dual-fuel
- Tri-fuel diesel-electric
- Steam turbine
- Alternative-fuel-ready and carbon capture configurations
- Europe LNG Carrier Market Outlook, by Application, Value (US$ Billion), 2020–2033
- Conventional LNG transportation
- Floating storage and regasification units
- Floating storage units
- LNG bunkering vessels
- Europe LNG Carrier Market Outlook, by Country, Value (US$ Billion), 2020–2033
- Greece LNG Carrier Market Outlook, by Containment System, 2020–2033
- Greece LNG Carrier Market Outlook, by Vessel Size, 2020–2033
- Greece LNG Carrier Market Outlook, by Propulsion, 2020–2033
- Greece LNG Carrier Market Outlook, by Application, 2020–2033
- Norway LNG Carrier Market Outlook, by Containment System, 2020–2033
- Norway LNG Carrier Market Outlook, by Vessel Size, 2020–2033
- Norway LNG Carrier Market Outlook, by Propulsion, 2020–2033
- Norway LNG Carrier Market Outlook, by Application, 2020–2033
- Belgium LNG Carrier Market Outlook, by Containment System, 2020–2033
- Belgium LNG Carrier Market Outlook, by Vessel Size, 2020–2033
- Belgium LNG Carrier Market Outlook, by Propulsion, 2020–2033
- Belgium LNG Carrier Market Outlook, by Application, 2020–2033
- Spain LNG Carrier Market Outlook, by Containment System, 2020–2033
- Spain LNG Carrier Market Outlook, by Vessel Size, 2020–2033
- Spain LNG Carrier Market Outlook, by Propulsion, 2020–2033
- Spain LNG Carrier Market Outlook, by Application, 2020–2033
- United Kingdom LNG Carrier Market Outlook, by Containment System, 2020–2033
- United Kingdom LNG Carrier Market Outlook, by Vessel Size, 2020–2033
- United Kingdom LNG Carrier Market Outlook, by Propulsion, 2020–2033
- United Kingdom LNG Carrier Market Outlook, by Application, 2020–2033
- Europe LNG Carrier Market Outlook, by Containment System, Value (US$ Billion), 2020–2033
- Asia Pacific LNG Carrier Market Outlook, 2020–2033
- Asia Pacific LNG Carrier Market Outlook, by Containment System, Value (US$ Billion), 2020–2033
- Membrane
- Moss spherical
- Type C and other small-scale containment
- Asia Pacific LNG Carrier Market Outlook, by Vessel Size, Value (US$ Billion), 2020–2033
- Small-scale (below 40,000 cubic metres)
- Mid-size (40,000–120,000 cubic metres)
- Conventional (120,000–180,000 cubic metres)
- Q-Flex and Q-Max (above 180,000 cubic metres)
- Asia Pacific LNG Carrier Market Outlook, by Propulsion, Value (US$ Billion), 2020–2033
- Two-stroke dual-fuel
- Tri-fuel diesel-electric
- Steam turbine
- Alternative-fuel-ready and carbon capture configurations
- Asia Pacific LNG Carrier Market Outlook, by Application, Value (US$ Billion), 2020–2033
- Conventional LNG transportation
- Floating storage and regasification units
- Floating storage units
- LNG bunkering vessels
- Asia Pacific LNG Carrier Market Outlook, by Country, Value (US$ Billion), 2020–2033
- Japan LNG Carrier Market Outlook, by Containment System, 2020–2033
- Japan LNG Carrier Market Outlook, by Vessel Size, 2020–2033
- Japan LNG Carrier Market Outlook, by Propulsion, 2020–2033
- Japan LNG Carrier Market Outlook, by Application, 2020–2033
- China LNG Carrier Market Outlook, by Containment System, 2020–2033
- China LNG Carrier Market Outlook, by Vessel Size, 2020–2033
- China LNG Carrier Market Outlook, by Propulsion, 2020–2033
- China LNG Carrier Market Outlook, by Application, 2020–2033
- South Korea LNG Carrier Market Outlook, by Containment System, 2020–2033
- South Korea LNG Carrier Market Outlook, by Vessel Size, 2020–2033
- South Korea LNG Carrier Market Outlook, by Propulsion, 2020–2033
- South Korea LNG Carrier Market Outlook, by Application, 2020–2033
- India LNG Carrier Market Outlook, by Containment System, 2020–2033
- India LNG Carrier Market Outlook, by Vessel Size, 2020–2033
- India LNG Carrier Market Outlook, by Propulsion, 2020–2033
- India LNG Carrier Market Outlook, by Application, 2020–2033
- Taiwan LNG Carrier Market Outlook, by Containment System, 2020–2033
- Taiwan LNG Carrier Market Outlook, by Vessel Size, 2020–2033
- Taiwan LNG Carrier Market Outlook, by Propulsion, 2020–2033
- Taiwan LNG Carrier Market Outlook, by Application, 2020–2033
- Thailand LNG Carrier Market Outlook, by Containment System, 2020–2033
- Thailand LNG Carrier Market Outlook, by Vessel Size, 2020–2033
- Thailand LNG Carrier Market Outlook, by Propulsion, 2020–2033
- Thailand LNG Carrier Market Outlook, by Application, 2020–2033
- Asia Pacific LNG Carrier Market Outlook, by Containment System, Value (US$ Billion), 2020–2033
- Latin America LNG Carrier Market Outlook, 2020–2033
- Latin America LNG Carrier Market Outlook, by Containment System, Value (US$ Billion), 2020–2033
- Membrane
- Moss spherical
- Type C and other small-scale containment
- Latin America LNG Carrier Market Outlook, by Vessel Size, Value (US$ Billion), 2020–2033
- Small-scale (below 40,000 cubic metres)
- Mid-size (40,000–120,000 cubic metres)
- Conventional (120,000–180,000 cubic metres)
- Q-Flex and Q-Max (above 180,000 cubic metres)
- Latin America LNG Carrier Market Outlook, by Propulsion, Value (US$ Billion), 2020–2033
- Two-stroke dual-fuel
- Tri-fuel diesel-electric
- Steam turbine
- Alternative-fuel-ready and carbon capture configurations
- Latin America LNG Carrier Market Outlook, by Application, Value (US$ Billion), 2020–2033
- Conventional LNG transportation
- Floating storage and regasification units
- Floating storage units
- LNG bunkering vessels
- Latin America LNG Carrier Market Outlook, by Country, Value (US$ Billion), 2020–2033
- Brazil LNG Carrier Market Outlook, by Containment System, 2020–2033
- Brazil LNG Carrier Market Outlook, by Vessel Size, 2020–2033
- Brazil LNG Carrier Market Outlook, by Propulsion, 2020–2033
- Brazil LNG Carrier Market Outlook, by Application, 2020–2033
- Argentina LNG Carrier Market Outlook, by Containment System, 2020–2033
- Argentina LNG Carrier Market Outlook, by Vessel Size, 2020–2033
- Argentina LNG Carrier Market Outlook, by Propulsion, 2020–2033
- Argentina LNG Carrier Market Outlook, by Application, 2020–2033
- Chile LNG Carrier Market Outlook, by Containment System, 2020–2033
- Chile LNG Carrier Market Outlook, by Vessel Size, 2020–2033
- Chile LNG Carrier Market Outlook, by Propulsion, 2020–2033
- Chile LNG Carrier Market Outlook, by Application, 2020–2033
- Mexico LNG Carrier Market Outlook, by Containment System, 2020–2033
- Mexico LNG Carrier Market Outlook, by Vessel Size, 2020–2033
- Mexico LNG Carrier Market Outlook, by Propulsion, 2020–2033
- Mexico LNG Carrier Market Outlook, by Application, 2020–2033
- Dominican Republic LNG Carrier Market Outlook, by Containment System, 2020–2033
- Dominican Republic LNG Carrier Market Outlook, by Vessel Size, 2020–2033
- Dominican Republic LNG Carrier Market Outlook, by Propulsion, 2020–2033
- Dominican Republic LNG Carrier Market Outlook, by Application, 2020–2033
- Latin America LNG Carrier Market Outlook, by Containment System, Value (US$ Billion), 2020–2033
- Middle East & Africa LNG Carrier Market Outlook, 2020–2033
- Middle East & Africa LNG Carrier Market Outlook, by Containment System, Value (US$ Billion), 2020–2033
- Membrane
- Moss spherical
- Type C and other small-scale containment
- Middle East & Africa LNG Carrier Market Outlook, by Vessel Size, Value (US$ Billion), 2020–2033
- Small-scale (below 40,000 cubic metres)
- Mid-size (40,000–120,000 cubic metres)
- Conventional (120,000–180,000 cubic metres)
- Q-Flex and Q-Max (above 180,000 cubic metres)
- Middle East & Africa LNG Carrier Market Outlook, by Propulsion, Value (US$ Billion), 2020–2033
- Two-stroke dual-fuel
- Tri-fuel diesel-electric
- Steam turbine
- Alternative-fuel-ready and carbon capture configurations
- Middle East & Africa LNG Carrier Market Outlook, by Application, Value (US$ Billion), 2020–2033
- Conventional LNG transportation
- Floating storage and regasification units
- Floating storage units
- LNG bunkering vessels
- Middle East & Africa LNG Carrier Market Outlook, by Country, Value (US$ Billion), 2020–2033
- Qatar LNG Carrier Market Outlook, by Containment System, 2020–2033
- Qatar LNG Carrier Market Outlook, by Vessel Size, 2020–2033
- Qatar LNG Carrier Market Outlook, by Propulsion, 2020–2033
- Qatar LNG Carrier Market Outlook, by Application, 2020–2033
- United Arab Emirates LNG Carrier Market Outlook, by Containment System, 2020–2033
- United Arab Emirates LNG Carrier Market Outlook, by Vessel Size, 2020–2033
- United Arab Emirates LNG Carrier Market Outlook, by Propulsion, 2020–2033
- United Arab Emirates LNG Carrier Market Outlook, by Application, 2020–2033
- Oman LNG Carrier Market Outlook, by Containment System, 2020–2033
- Oman LNG Carrier Market Outlook, by Vessel Size, 2020–2033
- Oman LNG Carrier Market Outlook, by Propulsion, 2020–2033
- Oman LNG Carrier Market Outlook, by Application, 2020–2033
- Nigeria LNG Carrier Market Outlook, by Containment System, 2020–2033
- Nigeria LNG Carrier Market Outlook, by Vessel Size, 2020–2033
- Nigeria LNG Carrier Market Outlook, by Propulsion, 2020–2033
- Nigeria LNG Carrier Market Outlook, by Application, 2020–2033
- Mozambique LNG Carrier Market Outlook, by Containment System, 2020–2033
- Mozambique LNG Carrier Market Outlook, by Vessel Size, 2020–2033
- Mozambique LNG Carrier Market Outlook, by Propulsion, 2020–2033
- Mozambique LNG Carrier Market Outlook, by Application, 2020–2033
- Egypt LNG Carrier Market Outlook, by Containment System, 2020–2033
- Egypt LNG Carrier Market Outlook, by Vessel Size, 2020–2033
- Egypt LNG Carrier Market Outlook, by Propulsion, 2020–2033
- Egypt LNG Carrier Market Outlook, by Application, 2020–2033
- Algeria LNG Carrier Market Outlook, by Containment System, 2020–2033
- Algeria LNG Carrier Market Outlook, by Vessel Size, 2020–2033
- Algeria LNG Carrier Market Outlook, by Propulsion, 2020–2033
- Algeria LNG Carrier Market Outlook, by Application, 2020–2033
- Middle East & Africa LNG Carrier Market Outlook, by Containment System, Value (US$ Billion), 2020–2033
- Competitive Landscape
- Market Concentration and Industry Leaders
- Competitive Differentiation
- Strategic Moves and Market Direction
- Recent Industry Developments
- Company Profiles
- HD Hyundai Heavy Industries
- Samsung Heavy Industries
- Hanwha Ocean
- Hudong-Zhonghua Shipbuilding
- Jiangnan Shipyard
- China State Shipbuilding Corporation
- Mitsubishi Shipbuilding
- Gaztransport & Technigaz
- Mitsui O.S.K. Lines
- NYK Line
- Nakilat
- Maran Gas Maritime
- Knutsen OAS Shipping
- Dynagas
- Excelerate Energy
- Appendix
- Research Methodology
- Report Assumptions
- Acronyms and Abbreviations
Containment System
- Membrane
- Moss spherical
- Type C and other small-scale containment
Vessel Size
- Small-scale (below 40,000 cubic metres)
- Mid-size (40,000–120,000 cubic metres)
- Conventional (120,000–180,000 cubic metres)
- Q-Flex and Q-Max (above 180,000 cubic metres)
Propulsion
- Two-stroke dual-fuel
- Tri-fuel diesel-electric
- Steam turbine
- Alternative-fuel-ready and carbon capture configurations
Application
- Conventional LNG transportation
- Floating storage and regasification units
- Floating storage units
- LNG bunkering vessels
Regions
- North America
- Europe
- Asia Pacific
- Latin America
- Middle East & Africa
Our Research Methodology
Considering the volatility of business today, traditional approaches to strategizing a game plan can be unfruitful if not detrimental. True ambiguity is no way to determine a forecast. A myriad of predetermined factors must be accounted for such as the degree of risk involved, the magnitude of circumstances, as well as conditions or consequences that are not known or unpredictable. To circumvent binary views that cast uncertainty, the application of market research intelligence to strategically posture, move, and enable actionable outcomes is necessary.
View Methodology
Quality Assured
Rigorous Validation Process

Confidentiality Assured
End-to-end Data Security

Custom Research Services
Tailored To Your Objectives
FAQs
The LNG carrier market is valued at US$ 22.0 billion in 2026, measured as the contract value of vessels delivered from shipyards during the year.
The market is projected to reach US$ 31.0 billion by 2033 at a 5.0% CAGR, representing US$ 9.0 billion of absolute dollar opportunity.
Membrane containment leads with 84% share in 2026, due to better volumetric efficiency, lower steel weight per cubic metre and canal transit compatibility.
Alternative-fuel-ready and carbon capture configurations grow fastest at 12.6% CAGR, while Middle East & Africa expands quickest regionally at 7.6% CAGR.
Europe holds 34% of contracted owner demand in 2026, led by Greek independent owners and European energy companies with global portfolios.
Related Reports
Photovoltaic Glass Market Size, Share, Insights, Competitive Landscape, and Forecast 2026 to 2033
The global photovoltaic glass market is valued at US$21.6 billion in 2026, reaching US$42.4 billion by 2033, growing at a 10.1% CAGR
Oil and Gas Asset Integrity Management Services Market Size, Share, Insights, Competitive Landscape, and Forecast 2026 to 2033
The global oil and gas asset integrity management services market is valued at US$26.0 billion in 2026, reaching US$41.0 billion by 2033, growing at a 6.7% CAGR
Intelligent Pumps Market Size, Share, Insights, Competitive Landscape, and Forecast 2026 to 2033
The global intelligent pumps market is valued at US$10.8 billion in 2026, reaching US$19.6 billion by 2033, growing at an 8.9% CAGR
Automated Mooring Systems Market Size, Share, Insights, Competitive Landscape, and Forecast 2026 to 2033
The global automated mooring systems market is valued at US$0.5 billion in 2026, reaching US$1.1 billion by 2033, growing at an 11.9% CAGR
Toroidal Transformers Market Size, Share, Insights, Competitive Landscape, and Forecast 2026 to 2033
The global toroidal transformers market is valued at US$1.2 billion in 2026, reaching US$1.8 billion by 2033, growing at a 6.0% CAGR
Sustainable Alternative Fuels Market Size, Share, Insights, Competitive Landscape, and Forecast 2026 to 2033
The global sustainable alternative fuels market is valued at US$58.0 billion in 2026, reaching US$165.0 billion by 2033, growing at a 16.1% CAGR