



Oil and Gas Asset Integrity Management Services Market
Oil and Gas Asset Integrity Management Services Market Size, Share, Insights, Competitive Landscape, and Forecast 2026 to 2033
Oil and Gas Asset Integrity Management Services Market Size and Trend Analysis
What Is Driving Asset Integrity Spending in Oil and Gas?
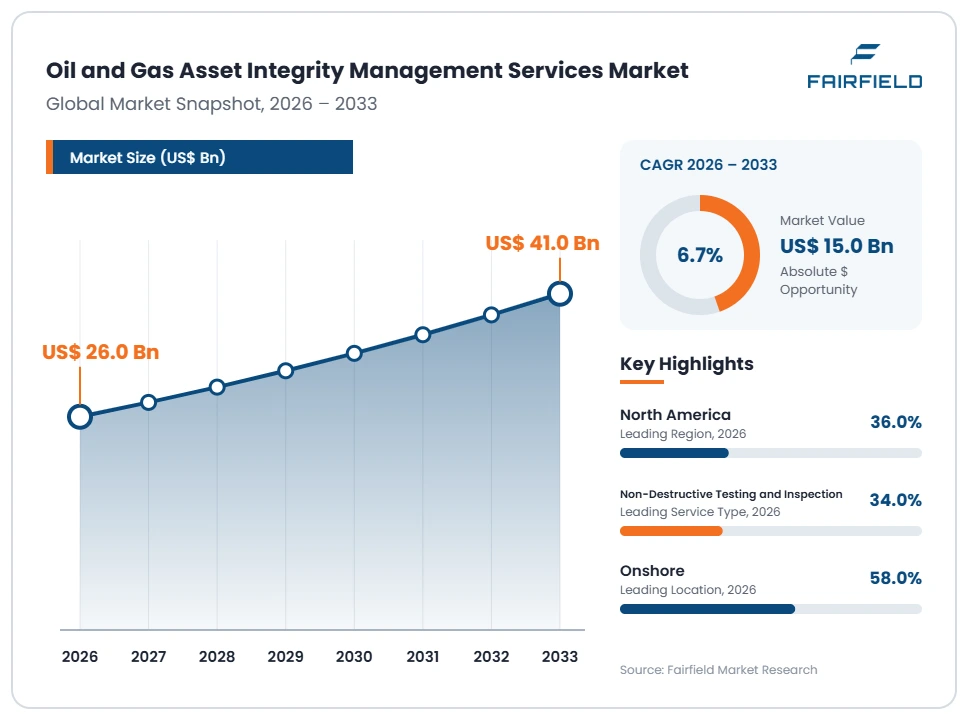
The global oil and gas asset integrity management services market size is expected to be valued at US$ 26.0 billion in 2026 and projected to reach US$ 41.0 billion by 2033, growing at a CAGR of 6.7% between 2026 and 2033.
Between 2020 and 2025 the market grew at roughly 4.1% annually, suppressed by the deferred maintenance that followed the 2020 price collapse and only partly recovered since. Three forces now lift the growth rate. Ageing production infrastructure is reaching or passing its original design life, which turns inspection into the evidence base for life extension decisions. Methane regulation has added a recurring leak detection and repair workload that did not previously exist. Risk-based inspection practice under API 580 and API 581 is spreading from refineries into upstream and midstream estates. The direction of travel is toward longer-term, data-led integrity contracts rather than discrete inspection campaigns.
Key Report Takeaways
- By Service Type: Non-destructive testing and inspection held 34% share in 2026, while pipeline integrity management and in-line inspection is projected to expand at an 8.1% CAGR through 2033, driven by transmission pipeline rulemaking and methane survey duties.
- By Location: Onshore services held 58% share in 2026, while offshore deepwater and subsea integrity is projected to grow at a 7.8% CAGR through 2033, as subsea infrastructure installed two decades ago reaches life extension review.
- By Asset Type: Upstream production facilities held 36% share in 2026, while midstream pipelines and terminals are projected to expand at a 7.6% CAGR through 2033, supported by new export infrastructure entering its first integrity cycles.
- By Inspection Method: Conventional manual inspection held 49% share in 2026, while remote and robotic inspection is projected to grow at an 11.4% CAGR through 2033, as drones and crawlers remove confined space and working-at-height exposure.
- By Geography: North America held 36% share in 2026, while Middle East & Africa is projected to grow at an 8.6% CAGR through 2033, driven by large brownfield upgrade and sour service programmes.
Global Oil and Gas Asset Integrity Management Services Market Trends and Insights
Drivers Impact Analysis
Two structural forces explain most of the forecast expansion in integrity service demand.
| Driver | Impact on CAGR Forecast | Geographic Relevance | Impact Timeline |
| Ageing assets and life extension beyond original design life | High | North America, Europe, Asia Pacific | Long term (≥4 years) |
| Methane regulation and mandatory leak detection and repair | High | North America, Europe, Middle East & Africa | Short term (≤2 years) |
Life Extension of Ageing Platforms and Plants Is Lifting Integrity Service Demand
Life extension has become the largest single source of integrity work. Operators facing a decision to decommission or keep producing need documented evidence of remaining wall thickness, fatigue life and structural capacity, and that evidence can only come from inspection and engineering assessment. The decision value is enormous relative to the survey cost, so integrity budgets are defended even when discretionary capital is cut.
The mechanism is physical degradation against a fixed original design basis. Platforms in the North Sea and Gulf of Mexico, refineries built decades ago and gathering systems in mature basins were designed for service lives now exhausted. Extending operation requires fitness-for-service assessment, corrosion rate monitoring and revalidated inspection plans built on API 510, API 570 and API 653 methodology. Regulators under the United Kingdom safety case regime and the EU Offshore Safety Directive expect that justification in writing before continued operation is accepted.
Methane Rules Are Creating a Recurring Leak Detection and Repair Workload
Methane regulation has created an entirely new, repeating revenue stream for inspection providers. Leak detection and repair duties require scheduled surveys of wells, compressor stations, terminals and processing facilities, with documented findings and verified repair within defined timeframes. Unlike turnaround inspection, this work recurs several times each year at every covered site, which converts a project business into an annuity.
The cause is explicit regulation rather than voluntary practice. The United States Environmental Protection Agency methane standards for new and existing oil and gas sources and the European Union methane regulation for the energy sector both specify survey frequency, detection technology performance and repair verification. Importers into the European Union face equivalence requirements that push the same obligations into producing countries. Optical gas imaging, laser-based detection and continuous monitoring all require qualified technicians and auditable data management, which favours established inspection contractors.
Restraints Impact Analysis
Two constraints cap how quickly integrity service revenue can convert from available scope.
| Restraint | Impact on CAGR Forecast | Geographic Relevance | Impact Timeline |
| Operator capital discipline and maintenance budget deferral | High | Global | Short term (≤2 years) |
| Shortage of certified inspection personnel | Medium | North America, Europe, Middle East & Africa | Long term (≥4 years) |
Operator Capital Discipline Keeps Integrity Budgets Under Continuous Pressure
Budget discipline limits realised demand even where technical need is clear. Operators under shareholder pressure to prioritise distributions over reinvestment treat maintenance and inspection as a controllable cost line. Scopes are trimmed, inspection intervals are stretched to the maximum the risk model permits, and turnarounds slip by a cycle. Service providers then compete for a smaller workload at lower rates, compressing margins across the sector.
The cost pressure is structural, not cyclical noise. Integrity work is labour-intensive, with rates that rise with certification level, and much of it requires the asset to be shut down. The production loss during a shutdown typically exceeds the inspection invoice by a wide margin, so the full cost of an inspection decision is dominated by deferred output. That calculation pushes operators toward the longest defensible interval and toward online and non-intrusive methods wherever a regulator will accept them.
Slow Qualification of Robotic Inspection Limits Substitution for Manual Methods
Qualification lag restrains the shift to remote and robotic inspection. Operators and regulators accept drone, crawler and remote visual data for screening, but are slower to accept it as the formal basis for a code inspection or a fitness-for-service decision. Until acceptance is routine, robotic surveys often supplement rather than replace manned entry, adding cost instead of removing it and weakening the efficiency case.
The cause is procedural and metrological. Code inspections under API 510, API 570 and API 653 rest on documented measurement accuracy, repeatability and inspector certification. Robotic platforms must demonstrate probability of detection, positional accuracy for thickness mapping and traceable calibration before a jurisdiction or authorised inspector will sign against them. Certification schemes for remote operators are still maturing, insurers remain cautious, and each operator typically runs its own qualification trials, which multiplies the cost of market entry for technology providers.
Market Opportunities
Two emerging revenue pools sit outside the traditional inspection scope.
Integrity Data Platforms and Analytics Open a Software-Led Revenue Pool
Integrity management software is becoming a distinct revenue pool alongside field services. Operators hold inspection records, corrosion loops, anomaly registers and repair histories across incompatible systems, and cannot easily prove compliance or prioritise spend. A hosted platform that consolidates this data, runs risk-based inspection calculations and schedules the next survey carries software margins and multi-year subscription revenue rather than day rates.
Inspection contractors and engineering consultancies are best placed to capture it, because the valuable asset is the historical data they already generate. The buying group is the corporate integrity authority rather than the site maintenance planner, which raises contract value and lengthens tenure. ISO 55000 asset management practice and risk-based inspection methodology under API 580 give the platform a recognised framework, and regulatory audit requirements make a single auditable record commercially necessary.
Integrity Services for Carbon Dioxide and Hydrogen Infrastructure Create New Scope
Repurposed and new carbon dioxide and hydrogen infrastructure opens an adjacent revenue pool with little incumbent competition. Dense-phase carbon dioxide pipelines, hydrogen blending in existing gas networks and depleted-reservoir storage all raise integrity questions that current inspection practice answers incompletely, including hydrogen embrittlement of line pipe, running ductile fracture behaviour and wellbore barrier performance under cyclic injection.
Operators of carbon capture hubs, gas transmission companies and storage developers create the demand, while established pipeline integrity and materials specialists are positioned to capture it. The work is attractive because qualification studies, material testing and baseline in-line inspection must be completed before operation, generating revenue ahead of any throughput. Regulatory frameworks for carbon dioxide transport and storage in the European Union and the United States require documented integrity management, which makes the spend non-discretionary for project sanction.
Segment Analysis
- By Service Type: Non-Destructive Testing Leads While Pipeline Integrity Work Accelerates
Non-destructive testing and inspection holds 34% of the oil and gas asset integrity management services market in 2026. Its lead comes from sheer volume, since ultrasonic thickness measurement, radiography and advanced eddy current are the measurement layer beneath nearly every other integrity activity. Pipeline integrity management and in-line inspection is the fastest-growing service at an 8.1% CAGR through 2033, driven by transmission pipeline rulemaking, higher inspection frequencies and the extension of smart pigging to previously unpiggable lines. Corrosion and erosion management remains a large service line, particularly in sour and high-carbon-dioxide service. Risk-based inspection and engineering assessment grows steadily as operators formalise interval setting. Structural and subsea integrity is smaller but technically demanding. The implication is that service breadth matters, because operators increasingly award bundled integrity contracts rather than separate inspection purchase orders.
- By Location: Onshore Work Dominates While Deepwater and Subsea Integrity Grows Faster
Onshore services account for 58% of market value in 2026, reflecting the volume of wells, gathering systems, processing plants, refineries and tank farms on land. Mobilisation is cheap, scopes are frequent, and regulatory inspection duties apply to very large installed populations. Offshore deepwater and subsea integrity grows fastest at a 7.8% CAGR through 2033. Subsea hardware installed in the late 1990s and 2000s is now reaching life extension review, flexible riser and umbilical degradation requires specialist assessment, and every inspection needs vessels or resident remotely operated vehicles at high day rates. Offshore shallow water sits between the two, dominated by mature platform estates. For providers, the commercial point is that offshore work contributes revenue and margin disproportionate to its activity count, so subsea capability protects pricing power.
- By Asset Type: Upstream Facilities Lead While Midstream Pipelines and Terminals Rise Fastest
Upstream production facilities represent 36% of demand in 2026, the leading asset category. Wellheads, separation trains, platforms and flowlines face the harshest service conditions, including sand erosion, hydrogen sulphide and high pressure, so they carry the densest inspection programmes. Midstream pipelines and terminals are expanding fastest at a 7.6% CAGR through 2033, because new export pipelines, liquefaction feedgas systems and storage terminals are entering their first baseline and re-inspection cycles, and because pipeline safety regulation is tightening. Downstream refineries and petrochemical plants remain a large, stable block anchored to turnaround schedules and pressure equipment codes. Storage tanks and terminals generate steady API 653 work tied to inspection intervals. The implication for providers is that midstream growth rewards in-line inspection fleets and pipeline engineering capability over plant-centred staffing models.
- By Inspection Method: Manual Inspection Still Leads as Remote and Robotic Methods Surge
Conventional manual inspection holds 49% of the market in 2026 because code-compliant measurement, authorised inspector sign-off and insurance acceptance still rest on direct human examination. Remote and robotic inspection is the fastest-growing method at an 11.4% CAGR through 2033. Drones survey flare stacks and tank roofs without scaffolding, crawlers carry out thickness mapping on live vessels, and remotely operated vehicles replace diver intervention subsea, removing confined space and working-at-height exposure that dominates integrity safety statistics. Rope access remains an efficient middle option for structural and external work. Integrity management software and analytics is the smallest category by revenue but the most strategically significant, since it determines where the field effort is directed. Providers investing in robotics must also fund the qualification evidence that makes the data acceptable.
Geography Analysis
- Which Region Is Leading the Oil and Gas Asset Integrity Management Services Market?
North America leads the oil and gas asset integrity management services market with 36% share in 2026, the largest regional position worldwide. The United States and Canada combine a very large installed base of wells, gathering systems, transmission pipelines, refineries and storage terminals with an unusually prescriptive regulatory environment. The Pipeline and Hazardous Materials Safety Administration sets integrity management duties for gas transmission and hazardous liquid lines, while Environmental Protection Agency methane standards add recurring leak detection and repair surveys. State regulators and insurers reinforce the requirement. Ageing midstream infrastructure in Texas, Oklahoma and Alberta, plus deepwater assets in the Gulf of Mexico, sustain high inspection intensity. The principal change ahead is the extension of in-line inspection and non-intrusive methods into gathering lines that historically escaped formal integrity programmes.
- Europe Anchors Demand Through Offshore Safety Case and Verification Regimes
Europe holds 19% of the market in 2026, with demand concentrated in the United Kingdom, Norway, the Netherlands and Germany. The defining feature is a goal-setting safety regime rather than prescriptive inspection rules. Operators must justify continued operation through a safety case and maintain verification of safety-critical elements by an independent competent person, which guarantees recurring third-party integrity work. The Offshore Safety Directive 2013/30/EU embedded that model across member states. North Sea platforms operating well beyond original design life make this the most life-extension-intensive region in the world. Refinery rationalisation and declining upstream output are genuine headwinds on volume. The offsetting change is repurposing of platforms, pipelines and depleted reservoirs for carbon dioxide transport and storage, which brings new qualification and baseline inspection scope.
- Asia Pacific Integrity Demand Tracks Refining Capacity and Gas Infrastructure
Asia Pacific accounts for 18% of the market in 2026 and grows at an above-average rate through 2033. China, India, Australia, Malaysia and Indonesia drive the activity. The regional profile is weighted toward downstream and midstream assets, because large refining and petrochemical complexes built over the past two decades are entering mid-life inspection cycles with substantial pressure equipment populations. Australian LNG trains and offshore gas facilities sustain specialist structural and subsea work, while Malaysian and Indonesian shallow-water platforms face extensive life extension decisions. Domestic service capacity has grown quickly, which keeps day rates competitive and limits revenue per inspection. The important regional change is the gradual adoption of formal risk-based inspection practice by national oil companies, which raises service intensity per asset over time.
- Latin America Integrity Spending Concentrates in Deepwater and Mature Onshore Fields
Latin America represents 7% of the market in 2026, an emerging but technically demanding position. Brazil, Mexico, Argentina and Colombia dominate demand. Brazilian pre-salt developments create high-value subsea and flexible riser integrity work, where sour service and long tiebacks require specialist assessment rather than routine survey. Mexican onshore and shallow-water assets carry heavy corrosion management needs after long periods of deferred maintenance, and Argentine unconventional development is building new gathering and processing infrastructure. The main barriers are currency volatility, uneven regulatory enforcement between countries, payment risk on national oil company contracts and a shortage of locally certified inspectors. The clearest opportunity is long-term framework agreements that bundle inspection, engineering assessment and data management for operators rebuilding integrity programmes from a weak base.
- Which Region Is Growing Fastest in the Oil and Gas Asset Integrity Management Services Market?
Middle East & Africa is growing fastest in the oil and gas asset integrity management services market, at an 8.6% CAGR between 2026 and 2033 from a 20% share in 2026. Saudi Arabia, the United Arab Emirates, Qatar, Kuwait, Iraq, Nigeria and Angola drive the expansion. Three causes stand out. Very large brownfield estates built from the 1970s onward now need systematic life extension. Sour and high-carbon-dioxide service in regional gas developments demands intensive corrosion management and material selection review. Major gas processing and export expansion creates baseline inspection scope on new assets. Barriers include security exposure in parts of West Africa, extreme ambient conditions and heavy localisation requirements. The defining change is national oil company insistence on in-country service capability, which is reshaping how contracts are structured.
Competitive Landscape
The oil and gas asset integrity management services market is fragmented. Global testing, inspection and certification groups hold meaningful but far from dominant positions, and the long tail consists of regional non-destructive testing houses, rope access specialists, corrosion consultancies and in-line inspection operators. Fragmentation persists because much of the work is locally delivered, labour-intensive and awarded on regional framework agreements. SGS SA, Bureau Veritas, DNV, Applus+ and Intertek Group plc compete alongside engineering contractors such as Wood plc and Aker Solutions, equipment-linked providers including Baker Hughes and Oceaneering International, and pipeline inspection specialists such as ROSEN Group, NDT Global and T.D. Williamson.
Competition turns on inspector certification depth, regulatory recognition in the relevant jurisdiction, health and safety record, mobilisation speed and the ability to hold a long-term framework without rate escalation. Data quality is becoming a differentiator in its own right, because operators now buy an auditable integrity record rather than a survey report. New entrants arrive mainly from technology: robotics developers, continuous corrosion monitoring suppliers and analytics firms that attack narrow segments of the workflow.
Strategic activity concentrates on consolidation of regional inspection firms by larger groups seeking geographic coverage, partnerships between inspection contractors and robotics or sensor developers, and investment in digital integrity platforms that lock in multi-year relationships. These moves matter because they shift the basis of competition away from day rates toward retained data and embedded workflow, which is far harder for a competitor to displace at the next tender.
Strategic direction across the sector points toward outcome-based integrity contracts, in-country value commitments in national oil company markets, and the deliberate extension of capability into carbon dioxide, hydrogen and other energy transition infrastructure.
Recent Industry Developments
- March 2024: The United States Environmental Protection Agency methane standards for new and existing oil and natural gas sources were published in the Federal Register – creating a recurring, auditable leak detection and repair inspection workload across producing assets.
- August 2024: The European Union methane regulation for the energy sector entered into force – extending measurement, reporting and leak detection duties to importers as well as domestic operators.
- 2024: The International Organization for Standardization published the revised ISO 55001 asset management standard – giving integrity programmes a recognised management system framework for audit and certification.
- August 2022: The Pipeline and Hazardous Materials Safety Administration published its gas transmission pipeline final rule on repair criteria, integrity management improvements and management of change – widening formal integrity obligations across the transmission network.
- 2015: The United Kingdom safety case and offshore safety directive regulations came into force, implementing Directive 2013/30/EU – embedding independent verification of safety-critical elements into offshore integrity budgets.
Companies Covered in the Report
- SGS SA
- Bureau Veritas
- DNV
- Applus+
- Mistras Group
- Intertek Group plc
- TÜV SÜD
- Wood plc
- Aker Solutions
- Oceaneering International
- Baker Hughes
- ROSEN Group
- NDT Global
- T.D. Williamson
Oil and Gas Asset Integrity Management Services Market Report Scope
| Metric | Value |
| Study Period | 2020–2033 |
| Market Size 2026 | US$ 26.0 Billion |
| Market Size 2033 | US$ 41.0 Billion |
| CAGR 2026–2033 | 6.7% |
| Absolute Dollar Opportunity | US$ 15.0 Billion |
| Largest Market | North America |
| Fastest-Growing Market | Middle East & Africa |
| Market Concentration | Low |
| Major Players | SGS SA, Bureau Veritas, DNV, Applus+, Mistras Group |
Oil and Gas Asset Integrity Management Services Market Segmentation
Service Type
- Non-destructive testing and inspection
- Corrosion and erosion management
- Risk-based inspection and engineering assessment
- Pipeline integrity management and in-line inspection
- Structural and subsea integrity
Location
- Onshore
- Offshore shallow water
- Offshore deepwater and subsea
Asset Type
- Upstream production facilities
- Midstream pipelines and terminals
- Downstream refineries and petrochemical plants
- Storage tanks and terminals
Inspection Method
- Conventional manual inspection
- Rope access
- Remote and robotic inspection
- Integrity management software and analytics
Regions
- North America
- Europe
- Asia Pacific
- Latin America
- Middle East & Africa
- Executive Summary
- Global Oil and Gas Asset Integrity Management Services Market Snapshot
- Future Projections
- Key Report Takeaways
- Regional Snapshot
- Market Overview
- Market Definition and Report Scope
- Historical Trends 2020–2025
- Market Dynamics
- Drivers
- Life Extension of Ageing Platforms and Plants Is Lifting Integrity Service Demand
- Methane Rules Are Creating a Recurring Leak Detection and Repair Workload
- Restraints
- Operator Capital Discipline Keeps Integrity Budgets Under Continuous Pressure
- Slow Qualification of Robotic Inspection Limits Substitution for Manual Methods
- Market Opportunities
- Integrity Data Platforms and Analytics Open a Software-Led Revenue Pool
- Integrity Services for Carbon Dioxide and Hydrogen Infrastructure Create New Scope
- Drivers
- Global Oil and Gas Asset Integrity Management Services Market Outlook, 2020–2033
- Global Oil and Gas Asset Integrity Management Services Market Outlook, by Service Type, Value (US$ Billion), 2020–2033
- Non-destructive testing and inspection
- Corrosion and erosion management
- Risk-based inspection and engineering assessment
- Pipeline integrity management and in-line inspection
- Structural and subsea integrity
- Global Oil and Gas Asset Integrity Management Services Market Outlook, by Location, Value (US$ Billion), 2020–2033
- Onshore
- Offshore shallow water
- Offshore deepwater and subsea
- Global Oil and Gas Asset Integrity Management Services Market Outlook, by Asset Type, Value (US$ Billion), 2020–2033
- Upstream production facilities
- Midstream pipelines and terminals
- Downstream refineries and petrochemical plants
- Storage tanks and terminals
- Global Oil and Gas Asset Integrity Management Services Market Outlook, by Inspection Method, Value (US$ Billion), 2020–2033
- Conventional manual inspection
- Rope access
- Remote and robotic inspection
- Integrity management software and analytics
- Global Oil and Gas Asset Integrity Management Services Market Outlook, by Region, Value (US$ Billion), 2020–2033
- North America
- Europe
- Asia Pacific
- Latin America
- Middle East & Africa
- Global Oil and Gas Asset Integrity Management Services Market Outlook, by Service Type, Value (US$ Billion), 2020–2033
- North America Oil and Gas Asset Integrity Management Services Market Outlook, 2020–2033
- North America Oil and Gas Asset Integrity Management Services Market Outlook, by Service Type, Value (US$ Billion), 2020–2033
- Non-destructive testing and inspection
- Corrosion and erosion management
- Risk-based inspection and engineering assessment
- Pipeline integrity management and in-line inspection
- Structural and subsea integrity
- North America Oil and Gas Asset Integrity Management Services Market Outlook, by Location, Value (US$ Billion), 2020–2033
- Onshore
- Offshore shallow water
- Offshore deepwater and subsea
- North America Oil and Gas Asset Integrity Management Services Market Outlook, by Asset Type, Value (US$ Billion), 2020–2033
- Upstream production facilities
- Midstream pipelines and terminals
- Downstream refineries and petrochemical plants
- Storage tanks and terminals
- North America Oil and Gas Asset Integrity Management Services Market Outlook, by Inspection Method, Value (US$ Billion), 2020–2033
- Conventional manual inspection
- Rope access
- Remote and robotic inspection
- Integrity management software and analytics
- North America Oil and Gas Asset Integrity Management Services Market Outlook, by Country, Value (US$ Billion), 2020–2033
- United States Oil and Gas Asset Integrity Management Services Market Outlook, by Service Type, 2020–2033
- United States Oil and Gas Asset Integrity Management Services Market Outlook, by Location, 2020–2033
- United States Oil and Gas Asset Integrity Management Services Market Outlook, by Asset Type, 2020–2033
- United States Oil and Gas Asset Integrity Management Services Market Outlook, by Inspection Method, 2020–2033
- Canada Oil and Gas Asset Integrity Management Services Market Outlook, by Service Type, 2020–2033
- Canada Oil and Gas Asset Integrity Management Services Market Outlook, by Location, 2020–2033
- Canada Oil and Gas Asset Integrity Management Services Market Outlook, by Asset Type, 2020–2033
- Canada Oil and Gas Asset Integrity Management Services Market Outlook, by Inspection Method, 2020–2033
- North America Oil and Gas Asset Integrity Management Services Market Outlook, by Service Type, Value (US$ Billion), 2020–2033
- Europe Oil and Gas Asset Integrity Management Services Market Outlook, 2020–2033
- Europe Oil and Gas Asset Integrity Management Services Market Outlook, by Service Type, Value (US$ Billion), 2020–2033
- Non-destructive testing and inspection
- Corrosion and erosion management
- Risk-based inspection and engineering assessment
- Pipeline integrity management and in-line inspection
- Structural and subsea integrity
- Europe Oil and Gas Asset Integrity Management Services Market Outlook, by Location, Value (US$ Billion), 2020–2033
- Onshore
- Offshore shallow water
- Offshore deepwater and subsea
- Europe Oil and Gas Asset Integrity Management Services Market Outlook, by Asset Type, Value (US$ Billion), 2020–2033
- Upstream production facilities
- Midstream pipelines and terminals
- Downstream refineries and petrochemical plants
- Storage tanks and terminals
- Europe Oil and Gas Asset Integrity Management Services Market Outlook, by Inspection Method, Value (US$ Billion), 2020–2033
- Conventional manual inspection
- Rope access
- Remote and robotic inspection
- Integrity management software and analytics
- Europe Oil and Gas Asset Integrity Management Services Market Outlook, by Country, Value (US$ Billion), 2020–2033
- United Kingdom Oil and Gas Asset Integrity Management Services Market Outlook, by Service Type, 2020–2033
- United Kingdom Oil and Gas Asset Integrity Management Services Market Outlook, by Location, 2020–2033
- United Kingdom Oil and Gas Asset Integrity Management Services Market Outlook, by Asset Type, 2020–2033
- United Kingdom Oil and Gas Asset Integrity Management Services Market Outlook, by Inspection Method, 2020–2033
- Norway Oil and Gas Asset Integrity Management Services Market Outlook, by Service Type, 2020–2033
- Norway Oil and Gas Asset Integrity Management Services Market Outlook, by Location, 2020–2033
- Norway Oil and Gas Asset Integrity Management Services Market Outlook, by Asset Type, 2020–2033
- Norway Oil and Gas Asset Integrity Management Services Market Outlook, by Inspection Method, 2020–2033
- Netherlands Oil and Gas Asset Integrity Management Services Market Outlook, by Service Type, 2020–2033
- Netherlands Oil and Gas Asset Integrity Management Services Market Outlook, by Location, 2020–2033
- Netherlands Oil and Gas Asset Integrity Management Services Market Outlook, by Asset Type, 2020–2033
- Netherlands Oil and Gas Asset Integrity Management Services Market Outlook, by Inspection Method, 2020–2033
- Germany Oil and Gas Asset Integrity Management Services Market Outlook, by Service Type, 2020–2033
- Germany Oil and Gas Asset Integrity Management Services Market Outlook, by Location, 2020–2033
- Germany Oil and Gas Asset Integrity Management Services Market Outlook, by Asset Type, 2020–2033
- Germany Oil and Gas Asset Integrity Management Services Market Outlook, by Inspection Method, 2020–2033
- Europe Oil and Gas Asset Integrity Management Services Market Outlook, by Service Type, Value (US$ Billion), 2020–2033
- Asia Pacific Oil and Gas Asset Integrity Management Services Market Outlook, 2020–2033
- Asia Pacific Oil and Gas Asset Integrity Management Services Market Outlook, by Service Type, Value (US$ Billion), 2020–2033
- Non-destructive testing and inspection
- Corrosion and erosion management
- Risk-based inspection and engineering assessment
- Pipeline integrity management and in-line inspection
- Structural and subsea integrity
- Asia Pacific Oil and Gas Asset Integrity Management Services Market Outlook, by Location, Value (US$ Billion), 2020–2033
- Onshore
- Offshore shallow water
- Offshore deepwater and subsea
- Asia Pacific Oil and Gas Asset Integrity Management Services Market Outlook, by Asset Type, Value (US$ Billion), 2020–2033
- Upstream production facilities
- Midstream pipelines and terminals
- Downstream refineries and petrochemical plants
- Storage tanks and terminals
- Asia Pacific Oil and Gas Asset Integrity Management Services Market Outlook, by Inspection Method, Value (US$ Billion), 2020–2033
- Conventional manual inspection
- Rope access
- Remote and robotic inspection
- Integrity management software and analytics
- Asia Pacific Oil and Gas Asset Integrity Management Services Market Outlook, by Country, Value (US$ Billion), 2020–2033
- China Oil and Gas Asset Integrity Management Services Market Outlook, by Service Type, 2020–2033
- China Oil and Gas Asset Integrity Management Services Market Outlook, by Location, 2020–2033
- China Oil and Gas Asset Integrity Management Services Market Outlook, by Asset Type, 2020–2033
- China Oil and Gas Asset Integrity Management Services Market Outlook, by Inspection Method, 2020–2033
- India Oil and Gas Asset Integrity Management Services Market Outlook, by Service Type, 2020–2033
- India Oil and Gas Asset Integrity Management Services Market Outlook, by Location, 2020–2033
- India Oil and Gas Asset Integrity Management Services Market Outlook, by Asset Type, 2020–2033
- India Oil and Gas Asset Integrity Management Services Market Outlook, by Inspection Method, 2020–2033
- Australia Oil and Gas Asset Integrity Management Services Market Outlook, by Service Type, 2020–2033
- Australia Oil and Gas Asset Integrity Management Services Market Outlook, by Location, 2020–2033
- Australia Oil and Gas Asset Integrity Management Services Market Outlook, by Asset Type, 2020–2033
- Australia Oil and Gas Asset Integrity Management Services Market Outlook, by Inspection Method, 2020–2033
- Malaysia Oil and Gas Asset Integrity Management Services Market Outlook, by Service Type, 2020–2033
- Malaysia Oil and Gas Asset Integrity Management Services Market Outlook, by Location, 2020–2033
- Malaysia Oil and Gas Asset Integrity Management Services Market Outlook, by Asset Type, 2020–2033
- Malaysia Oil and Gas Asset Integrity Management Services Market Outlook, by Inspection Method, 2020–2033
- Indonesia Oil and Gas Asset Integrity Management Services Market Outlook, by Service Type, 2020–2033
- Indonesia Oil and Gas Asset Integrity Management Services Market Outlook, by Location, 2020–2033
- Indonesia Oil and Gas Asset Integrity Management Services Market Outlook, by Asset Type, 2020–2033
- Indonesia Oil and Gas Asset Integrity Management Services Market Outlook, by Inspection Method, 2020–2033
- Asia Pacific Oil and Gas Asset Integrity Management Services Market Outlook, by Service Type, Value (US$ Billion), 2020–2033
- Latin America Oil and Gas Asset Integrity Management Services Market Outlook, 2020–2033
- Latin America Oil and Gas Asset Integrity Management Services Market Outlook, by Service Type, Value (US$ Billion), 2020–2033
- Non-destructive testing and inspection
- Corrosion and erosion management
- Risk-based inspection and engineering assessment
- Pipeline integrity management and in-line inspection
- Structural and subsea integrity
- Latin America Oil and Gas Asset Integrity Management Services Market Outlook, by Location, Value (US$ Billion), 2020–2033
- Onshore
- Offshore shallow water
- Offshore deepwater and subsea
- Latin America Oil and Gas Asset Integrity Management Services Market Outlook, by Asset Type, Value (US$ Billion), 2020–2033
- Upstream production facilities
- Midstream pipelines and terminals
- Downstream refineries and petrochemical plants
- Storage tanks and terminals
- Latin America Oil and Gas Asset Integrity Management Services Market Outlook, by Inspection Method, Value (US$ Billion), 2020–2033
- Conventional manual inspection
- Rope access
- Remote and robotic inspection
- Integrity management software and analytics
- Latin America Oil and Gas Asset Integrity Management Services Market Outlook, by Country, Value (US$ Billion), 2020–2033
- Brazil Oil and Gas Asset Integrity Management Services Market Outlook, by Service Type, 2020–2033
- Brazil Oil and Gas Asset Integrity Management Services Market Outlook, by Location, 2020–2033
- Brazil Oil and Gas Asset Integrity Management Services Market Outlook, by Asset Type, 2020–2033
- Brazil Oil and Gas Asset Integrity Management Services Market Outlook, by Inspection Method, 2020–2033
- Mexico Oil and Gas Asset Integrity Management Services Market Outlook, by Service Type, 2020–2033
- Mexico Oil and Gas Asset Integrity Management Services Market Outlook, by Location, 2020–2033
- Mexico Oil and Gas Asset Integrity Management Services Market Outlook, by Asset Type, 2020–2033
- Mexico Oil and Gas Asset Integrity Management Services Market Outlook, by Inspection Method, 2020–2033
- Argentina Oil and Gas Asset Integrity Management Services Market Outlook, by Service Type, 2020–2033
- Argentina Oil and Gas Asset Integrity Management Services Market Outlook, by Location, 2020–2033
- Argentina Oil and Gas Asset Integrity Management Services Market Outlook, by Asset Type, 2020–2033
- Argentina Oil and Gas Asset Integrity Management Services Market Outlook, by Inspection Method, 2020–2033
- Colombia Oil and Gas Asset Integrity Management Services Market Outlook, by Service Type, 2020–2033
- Colombia Oil and Gas Asset Integrity Management Services Market Outlook, by Location, 2020–2033
- Colombia Oil and Gas Asset Integrity Management Services Market Outlook, by Asset Type, 2020–2033
- Colombia Oil and Gas Asset Integrity Management Services Market Outlook, by Inspection Method, 2020–2033
- Latin America Oil and Gas Asset Integrity Management Services Market Outlook, by Service Type, Value (US$ Billion), 2020–2033
- Middle East & Africa Oil and Gas Asset Integrity Management Services Market Outlook, 2020–2033
- Middle East & Africa Oil and Gas Asset Integrity Management Services Market Outlook, by Service Type, Value (US$ Billion), 2020–2033
- Non-destructive testing and inspection
- Corrosion and erosion management
- Risk-based inspection and engineering assessment
- Pipeline integrity management and in-line inspection
- Structural and subsea integrity
- Middle East & Africa Oil and Gas Asset Integrity Management Services Market Outlook, by Location, Value (US$ Billion), 2020–2033
- Onshore
- Offshore shallow water
- Offshore deepwater and subsea
- Middle East & Africa Oil and Gas Asset Integrity Management Services Market Outlook, by Asset Type, Value (US$ Billion), 2020–2033
- Upstream production facilities
- Midstream pipelines and terminals
- Downstream refineries and petrochemical plants
- Storage tanks and terminals
- Middle East & Africa Oil and Gas Asset Integrity Management Services Market Outlook, by Inspection Method, Value (US$ Billion), 2020–2033
- Conventional manual inspection
- Rope access
- Remote and robotic inspection
- Integrity management software and analytics
- Middle East & Africa Oil and Gas Asset Integrity Management Services Market Outlook, by Country, Value (US$ Billion), 2020–2033
- Saudi Arabia Oil and Gas Asset Integrity Management Services Market Outlook, by Service Type, 2020–2033
- Saudi Arabia Oil and Gas Asset Integrity Management Services Market Outlook, by Location, 2020–2033
- Saudi Arabia Oil and Gas Asset Integrity Management Services Market Outlook, by Asset Type, 2020–2033
- Saudi Arabia Oil and Gas Asset Integrity Management Services Market Outlook, by Inspection Method, 2020–2033
- United Arab Emirates Oil and Gas Asset Integrity Management Services Market Outlook, by Service Type, 2020–2033
- United Arab Emirates Oil and Gas Asset Integrity Management Services Market Outlook, by Location, 2020–2033
- United Arab Emirates Oil and Gas Asset Integrity Management Services Market Outlook, by Asset Type, 2020–2033
- United Arab Emirates Oil and Gas Asset Integrity Management Services Market Outlook, by Inspection Method, 2020–2033
- Qatar Oil and Gas Asset Integrity Management Services Market Outlook, by Service Type, 2020–2033
- Qatar Oil and Gas Asset Integrity Management Services Market Outlook, by Location, 2020–2033
- Qatar Oil and Gas Asset Integrity Management Services Market Outlook, by Asset Type, 2020–2033
- Qatar Oil and Gas Asset Integrity Management Services Market Outlook, by Inspection Method, 2020–2033
- Kuwait Oil and Gas Asset Integrity Management Services Market Outlook, by Service Type, 2020–2033
- Kuwait Oil and Gas Asset Integrity Management Services Market Outlook, by Location, 2020–2033
- Kuwait Oil and Gas Asset Integrity Management Services Market Outlook, by Asset Type, 2020–2033
- Kuwait Oil and Gas Asset Integrity Management Services Market Outlook, by Inspection Method, 2020–2033
- Iraq Oil and Gas Asset Integrity Management Services Market Outlook, by Service Type, 2020–2033
- Iraq Oil and Gas Asset Integrity Management Services Market Outlook, by Location, 2020–2033
- Iraq Oil and Gas Asset Integrity Management Services Market Outlook, by Asset Type, 2020–2033
- Iraq Oil and Gas Asset Integrity Management Services Market Outlook, by Inspection Method, 2020–2033
- Nigeria Oil and Gas Asset Integrity Management Services Market Outlook, by Service Type, 2020–2033
- Nigeria Oil and Gas Asset Integrity Management Services Market Outlook, by Location, 2020–2033
- Nigeria Oil and Gas Asset Integrity Management Services Market Outlook, by Asset Type, 2020–2033
- Nigeria Oil and Gas Asset Integrity Management Services Market Outlook, by Inspection Method, 2020–2033
- Angola Oil and Gas Asset Integrity Management Services Market Outlook, by Service Type, 2020–2033
- Angola Oil and Gas Asset Integrity Management Services Market Outlook, by Location, 2020–2033
- Angola Oil and Gas Asset Integrity Management Services Market Outlook, by Asset Type, 2020–2033
- Angola Oil and Gas Asset Integrity Management Services Market Outlook, by Inspection Method, 2020–2033
- Middle East & Africa Oil and Gas Asset Integrity Management Services Market Outlook, by Service Type, Value (US$ Billion), 2020–2033
- Competitive Landscape
- Market Concentration and Industry Leaders
- Competitive Differentiation
- Strategic Moves and Market Direction
- Recent Industry Developments
- Company Profiles
- SGS SA
- Bureau Veritas
- DNV
- Applus+
- Mistras Group
- Intertek Group plc
- TÜV SÜD
- Wood plc
- Aker Solutions
- Oceaneering International
- Baker Hughes
- ROSEN Group
- NDT Global
- T.D. Williamson
- Appendix
- Research Methodology
- Report Assumptions
- Acronyms and Abbreviations
Service Type
- Non-destructive testing and inspection
- Corrosion and erosion management
- Risk-based inspection and engineering assessment
- Pipeline integrity management and in-line inspection
- Structural and subsea integrity
Location
- Onshore
- Offshore shallow water
- Offshore deepwater and subsea
Asset Type
- Upstream production facilities
- Midstream pipelines and terminals
- Downstream refineries and petrochemical plants
- Storage tanks and terminals
Inspection Method
- Conventional manual inspection
- Rope access
- Remote and robotic inspection
- Integrity management software and analytics
Regions
- North America
- Europe
- Asia Pacific
- Latin America
- Middle East & Africa
Our Research Methodology
Considering the volatility of business today, traditional approaches to strategizing a game plan can be unfruitful if not detrimental. True ambiguity is no way to determine a forecast. A myriad of predetermined factors must be accounted for such as the degree of risk involved, the magnitude of circumstances, as well as conditions or consequences that are not known or unpredictable. To circumvent binary views that cast uncertainty, the application of market research intelligence to strategically posture, move, and enable actionable outcomes is necessary.
View Methodology
Quality Assured
Rigorous Validation Process

Confidentiality Assured
End-to-end Data Security

Custom Research Services
Tailored To Your Objectives
FAQs
The market is valued at US$ 26.0 billion in 2026, covering inspection, corrosion management, pipeline integrity and engineering assessment services for producing hydrocarbon assets worldwide.
The market is projected to reach US$ 41.0 billion by 2033 at a 6.7% CAGR, representing US$ 15.0 billion of absolute dollar opportunity over the period.
Non-destructive testing and inspection leads with 34% share in 2026, because it provides the measurement layer underpinning nearly every other integrity activity.
Remote and robotic inspection grows fastest at 11.4% CAGR, while Middle East & Africa is the fastest-expanding region at 8.6% CAGR through 2033.
North America holds 36% share in 2026, supported by a vast installed asset base and prescriptive pipeline safety and methane regulation.
Related Reports
Photovoltaic Glass Market Size, Share, Insights, Competitive Landscape, and Forecast 2026 to 2033
The global photovoltaic glass market is valued at US$21.6 billion in 2026, reaching US$42.4 billion by 2033, growing at a 10.1% CAGR
LNG Carrier Market Size, Share, Insights, Competitive Landscape, and Forecast 2026 to 2033
The global LNG carrier market is valued at US$22.0 billion in 2026, reaching US$31.0 billion by 2033, growing at a 5.0% CAGR
Intelligent Pumps Market Size, Share, Insights, Competitive Landscape, and Forecast 2026 to 2033
The global intelligent pumps market is valued at US$10.8 billion in 2026, reaching US$19.6 billion by 2033, growing at an 8.9% CAGR
Automated Mooring Systems Market Size, Share, Insights, Competitive Landscape, and Forecast 2026 to 2033
The global automated mooring systems market is valued at US$0.5 billion in 2026, reaching US$1.1 billion by 2033, growing at an 11.9% CAGR
Toroidal Transformers Market Size, Share, Insights, Competitive Landscape, and Forecast 2026 to 2033
The global toroidal transformers market is valued at US$1.2 billion in 2026, reaching US$1.8 billion by 2033, growing at a 6.0% CAGR
Sustainable Alternative Fuels Market Size, Share, Insights, Competitive Landscape, and Forecast 2026 to 2033
The global sustainable alternative fuels market is valued at US$58.0 billion in 2026, reaching US$165.0 billion by 2033, growing at a 16.1% CAGR