



Photovoltaic Glass Market
Photovoltaic Glass Market Size, Share, Insights, Competitive Landscape, and Forecast 2026 to 2033
Photovoltaic Glass Market Size and Trend Analysis
What Is Driving Photovoltaic Glass Demand to 2033?
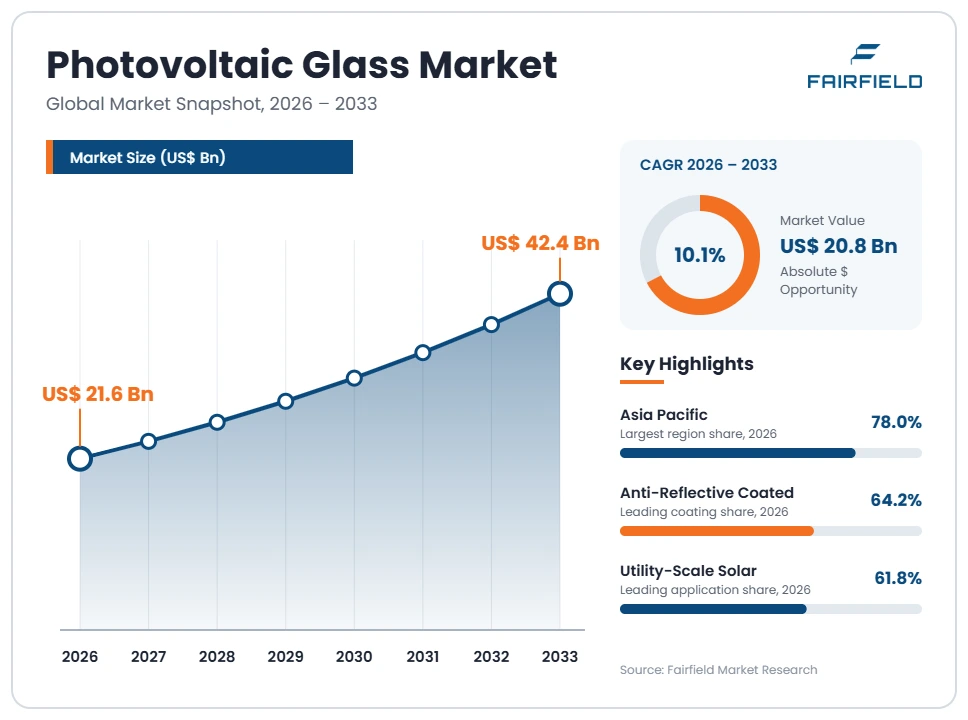
The global Photovoltaic Glass market size is expected to be valued at US$ 21.6 billion in 2026 and projected to reach US$ 42.4 billion by 2033, growing at a CAGR of 10.1% between 2026 and 2033.
The market grew from roughly US$ 8.9 billion in 2020 to US$ 19.4 billion in 2025, a historical CAGR near 16.9%, though that revenue growth was uneven because glass prices fell sharply in the later years. Values here measure solar glass consumed in module and building-integrated photovoltaic production, not finished module value. Two technical shifts dominate the outlook. Bifacial glass-glass construction replaces polymer backsheets with a second pane, roughly doubling glass area per module. Thinner panes and anti-reflective and anti-soiling coatings add value per square metre. Volume growth will therefore outpace revenue growth, because unit prices remain under heavy competitive pressure.
Key Report Takeaways
- By Product Type: Tempered Patterned Front Glass held 56.3% share in 2026, while Thin Back Glass is projected to expand at a 13.1% CAGR through 2033, as glass-glass bifacial construction displaces polymer backsheets in utility projects.
- By Thickness: 3.2 mm and above held 48.9% share in 2026, while glass below 2.0 mm is projected to expand at a 14.4% CAGR through 2033, because thinner panes cut module weight and furnace glass consumption per watt.
- By Coating: Anti-Reflective Coated glass held 64.2% share in 2026, while Anti-Soiling and Dual-Function Coated glass is projected to expand at a 15.3% CAGR through 2033, driven by desert installations where soiling losses are severe.
- By Application: Utility-Scale Solar held 61.8% share in 2026, while Building-Integrated Photovoltaics is projected to expand at a 13.6% CAGR through 2033, supported by zero-emission building rules that reward on-site generation.
- By Geography: Asia Pacific held 78% share in 2026, while Middle East & Africa is projected to expand at a 14.6% CAGR through 2033, from a small base of new module and glass capacity in the Gulf states.
Global Photovoltaic Glass Market Trends and Insights
Drivers Impact Analysis
Growth in this materials market is driven more by module architecture than by shipment volume alone.
| Driver | Impact on CAGR Forecast | Geographic Relevance | Impact Timeline |
| Shift to bifacial glass-glass module construction | High | Asia Pacific, Middle East & Africa | Long term (≥4 years) |
| Durability and safety qualification requirements for modules | Medium | Europe, North America | Medium term (2–4 years) |
Bifacial Glass-Glass Construction Doubles Glass Area per Module
The move to glass-glass bifacial modules is the single clearest structural driver, because it changes how much glass each module needs. A conventional module uses one glass pane and a polymer backsheet. A glass-glass module uses two panes, so glass area per module roughly doubles. Solar glass demand is therefore growing faster than module shipments, even when shipment growth slows.
The mechanism is technical and economic. Bifacial cells capture reflected light on the rear face, lifting energy yield on high-albedo ground without extra land. Glass encapsulation also resists moisture ingress and ultraviolet degradation better than polymer, which supports the long performance warranties utility buyers demand and the damp heat and ultraviolet sequences in IEC 61215. Trackers in desert and snow-affected sites gain most. As a result, glass-glass has become the default construction for new utility-scale tenders.
Durability and Safety Qualification Raises the Technical Bar for Solar Glass
Module qualification requirements pull demand toward higher-specification glass, which supports value even when prices fall. Buyers and lenders require modules that pass recognised design qualification and safety testing, and glass properties determine whether a module survives those sequences. That pushes module makers toward low-iron, well-tempered, dimensionally consistent panes and away from marginal suppliers.
The underlying mechanism sits in the test regimes. IEC 61215 covers design qualification and type approval through thermal cycling, damp heat, humidity freeze, mechanical load and hail impact, while IEC 61730 addresses construction and safety qualification. Glass thickness, tempering quality, iron content and coating adhesion all affect those outcomes. Hail resistance in particular has become a procurement issue for insurers in North America, driving thicker or better-tempered front glass on exposed utility projects despite the weight penalty.
Restraints Impact Analysis
Two commercial realities constrain the revenue, as distinct from the volume, of this market.
| Restraint | Impact on CAGR Forecast | Geographic Relevance | Impact Timeline |
| Severe overcapacity and price collapse across the photovoltaic chain | High | Asia Pacific, Europe | Short term (≤2 years) |
| Dual certification burden for building-integrated photovoltaic glass | Medium | Europe, North America | Medium term (2–4 years) |
Overcapacity and Price Collapse Compress Solar Glass Margins
The photovoltaic value chain entered a deep overcapacity cycle, and solar glass has not escaped it. Polysilicon, wafer, cell and module prices fell well below the production cost of many manufacturers, and module makers passed that pressure straight to component suppliers. Glass producers responded by idling furnaces, delaying new lines and selling at or below cash cost, which caps revenue growth even as shipped square metres rise.
The cost structure explains the severity. A float or rolled solar glass furnace runs continuously for years and cannot be throttled economically, so operators defend volume rather than price. Scale is the only durable defence: the largest lines achieve far lower unit costs through daily melt capacity, energy integration and captive raw material supply. That dynamic concentrates production, squeezes smaller producers out and makes capacity discipline, not demand, the main determinant of pricing.
Dual Certification for Building-Integrated Glass Slows Facade Adoption
Building-integrated photovoltaic glass must satisfy two separate regulatory worlds at once, and that genuinely slows adoption. A facade panel is both an electrical generator and a construction product. It must meet module design qualification and safety requirements, and simultaneously meet structural, fire, impact, fall-protection and weathertightness requirements for glazing in buildings. Each market adds national variations, so a product certified in one country often cannot be sold directly in another.
The cost falls on testing and project risk, not on the glass itself. Laminated safety construction, fire classification, wind and impact load testing and system warranties add expense and months of lead time. Architects also need bespoke sizes, colours and transparency levels, which conflicts with the standard formats that make module glass cheap. Approval responsibility between the facade contractor and the electrical contractor frequently remains unclear.
Market Opportunities
Two revenue pools sit outside the commoditised supply of standard front glass to large module factories.
Coated Glass for High-Soiling and High-Albedo Sites Opens a Premium Product Pool
Functional coatings are the most accessible premium revenue pool in solar glass, because they raise price per square metre without requiring new furnace capacity. Anti-reflective coatings already lift module output by a measurable margin. Anti-soiling, easy-clean and dual-function coatings go further by reducing cleaning frequency and the yield loss that dust causes between washes. On large desert plants, cleaning water and labour are real operating costs, so the payback is quick and quantifiable.
Independent power producers and engineering, procurement and construction contractors in the Gulf, North Africa, India, Chile and Australia create this demand, because soiling losses there are severe. Coating specialists and glass producers with in-line coating capability can capture it, since the technology sits at the end of the glass line rather than in the melt.
Localised Glass Capacity Outside China Creates a Policy-Backed Supply Opportunity
Building solar glass capacity close to new module factories outside China is an emerging revenue pool created by industrial policy rather than by cost advantage. Glass is heavy, fragile and expensive to ship relative to its value, so a module plant far from its glass supply carries a logistics and inventory penalty. Where governments subsidise local module assembly, a nearby glass line becomes economically defensible even at sub-scale volumes.
Module manufacturers establishing plants in India, the United States, Türkiye and the Gulf are the demand side. The European Union Net-Zero Industry Act sets domestic manufacturing capacity objectives for clean technologies, and India supports local content through its approved manufacturer listing. Established glass groups with furnace engineering capability are best placed to capture this, often through joint ventures with module makers.
Segment Analysis
- By Product Type: Tempered Patterned Front Glass Leads as Thin Back Glass Scales Rapidly
Tempered Patterned Front Glass held 56.3% of value in 2026, because every crystalline silicon module needs a front pane and low-iron patterned glass remains the standard choice. The rolled, textured surface traps light, low iron content raises transmission, and thermal tempering delivers the mechanical and hail resistance that IEC 61215 sequences demand.
Thin Back Glass is growing fastest at a 13.1% CAGR to 2033. Panes of 2.0 mm and below are replacing polymer backsheets in glass-glass bifacial modules, where the rear pane must transmit light and keep module weight manageable. Transparent conductive oxide coated glass serves thin-film production, while laminated building-integrated photovoltaic glass is the smallest but highest-value line.
The business implication is a shift in product mix: producers that can run thin, low-breakage lines at high yield capture the fastest-growing volume, while standard front glass becomes an increasingly commoditised base load.
- By Thickness: Thicker Panes Still Dominate While Sub-2.0 mm Glass Grows Quickest
Glass of 3.2 mm and above held 48.9% share in 2026, reflecting the installed standard for single-glass front sheets on utility and commercial modules. Thicker panes give mechanical load and hail performance margin, which matters for insurers and for projects in hail-exposed parts of North America and Australia.
Glass below 2.0 mm is expanding fastest at a 14.4% CAGR. Glass-glass modules typically use two thin panes rather than one thick one, which keeps module weight within handling and racking limits while improving moisture resistance. Thinner glass also consumes less batch material per square metre, which lowers energy use per unit of furnace output and supports cost reduction when prices are under pressure.
For producers, thin glass raises breakage risk in tempering and handling, so yield control becomes the main determinant of profitability in this segment.
- By Coating: Anti-Reflective Dominates as Anti-Soiling and Dual-Function Coatings Accelerate
Anti-Reflective Coated glass accounted for 64.2% of 2026 value and is effectively standard on front sheets, because a porous silica coating raises light transmission by a meaningful margin at very low incremental cost. The payback is immediate in extra energy yield, so module makers specify it almost universally on crystalline silicon products.
Anti-Soiling and Dual-Function Coated glass is the fastest-growing coating line at a 15.3% CAGR. Dust accumulation in arid regions causes substantial annual yield loss, and water for cleaning is scarce and expensive in exactly those locations. Hydrophilic and hydrophobic coating chemistries that combine anti-reflective and anti-soiling behaviour are moving from pilot supply into mainstream desert procurement.
Uncoated glass persists mainly in thin-film back glass and in cost-driven tenders, and its share continues to decline steadily across the forecast period.
- By Application: Utility-Scale Solar Leads While Building-Integrated Photovoltaics Grows Fastest
Utility-Scale Solar consumed 61.8% of photovoltaic glass value in 2026, because large ground-mounted plants account for the majority of annual module demand worldwide. Utility buyers also adopted bifacial glass-glass construction first, so this application drives the largest share of incremental glass area as well as the largest base.
Building-Integrated Photovoltaics is the fastest-growing application at a 13.6% CAGR to 2033. The recast building energy rules in the European Union, which require new buildings to be zero-emission and encourage solar-ready construction, are pulling photovoltaic glass into facades, skylights, canopies and balustrades. Semi-transparent and coloured laminated products command far higher prices per square metre than module front glass.
Commercial, industrial and residential rooftop applications sit between these poles, with rooftop demand favouring lighter, thinner laminates and higher aesthetic standards.
Geography Analysis
- North America Pairs Module Reshoring With Limited Local Glass Supply
North America held 7% of the market in 2026 and is forecast to grow at a 13.2% CAGR, the second fastest of the five regions. The United States has added substantial module assembly capacity under federal manufacturing incentives, but domestic solar glass production remains very limited, so most panes are still imported. That gap is the defining feature of the region.
Policy is the main driver. Domestic content incentives, tariff measures and project finance rules reward locally sourced components, which creates a clear commercial case for new glass lines. Barriers are real: furnace capital cost, permitting timelines, energy prices and the scarcity of experienced rolled-glass operators. Hail resistance requirements from insurers are also pushing specification toward thicker or better-tempered front glass on exposed utility projects in this region.
- Europe Prioritises Building-Integrated Glass and Supply Chain Resilience
Europe accounted for 9% of the market in 2026 with a 7.4% CAGR, the slowest growth of the five regions. Domestic production is modest and concentrated in a small number of specialised lines, and several European module and glass projects have struggled against imported product priced below their cost base. Demand, however, remains substantial because installation volumes are high.
The region’s distinguishing feature is product mix rather than scale. Germany, Italy, Spain, the Netherlands and Switzerland lead building-integrated applications, where coloured, semi-transparent and architecturally sized laminates command premium prices. The Net-Zero Industry Act sets domestic manufacturing capacity objectives, and ecodesign work on photovoltaic modules is expected to add carbon footprint and circularity criteria that favour regionally produced glass.
- Which Region Is Leading the Photovoltaic Glass Market?
Asia Pacific is leading the photovoltaic glass market with 78% share in 2026 and a 9.9% CAGR to 2033. China alone accounts for the overwhelming majority of global solar glass output, supported by very large daily-melt furnaces, captive quartz sand and soda ash supply, integrated logistics with nearby module plants, and electricity and gas costs that few other locations match.
Scale is the reason leadership is so entrenched. The biggest producers operate lines many times the size of a typical architectural glass furnace, which drives unit costs below the reach of sub-scale competitors. India is the clearest change in the region, building domestic patterned glass capacity behind local content rules, while Vietnam, Malaysia and Thailand host module assembly that consumes imported and locally produced panes.
- Latin America Builds Demand Through Large Solar Pipelines Rather Than Local Production
Latin America represented 2% of the market in 2026 and is projected to grow at a 10.5% CAGR. Brazil, Chile, Mexico and Colombia drive volumes through strong utility and distributed generation pipelines, with Brazil standing out for the scale of its rooftop segment. Almost all glass arrives inside imported modules, so local consumption rarely translates into local manufacturing value.
The barriers are structural: limited soda ash and high-purity silica processing, costly industrial energy in some markets, and import regimes that have historically favoured finished modules over components. High-altitude and high-albedo sites in the Atacama region offer a genuine opportunity for bifacial glass-glass modules and anti-soiling coatings, where measured yield gains justify the premium specification.
- Which Region Is Growing Fastest in the Photovoltaic Glass Market?
Middle East & Africa is growing fastest in the photovoltaic glass market, at a 14.6% CAGR between 2026 and 2033, from a 4% share in 2026. The base is small, which exaggerates the rate, but the underlying activity is genuine. Saudi Arabia, the United Arab Emirates, Egypt, Oman and Morocco are commissioning very large solar programmes and are actively pursuing local module and component manufacturing.
Low-cost energy, cheap industrial land and state-backed industrial strategies make furnace investment credible in the Gulf. Barriers include a shallow pool of specialised glass technicians, dependence on imported coating equipment and exposure to single-customer project pipelines. The clearest regional opportunity is anti-soiling coated glass, since desert dust imposes heavy yield losses and cleaning water is scarce and costly.
Competitive Landscape
The photovoltaic glass market is highly concentrated. A small number of China-based producers supply the majority of global patterned solar glass, and the two largest groups together hold a share that no other manufacturer approaches. Concentration arose from furnace economics rather than from technology barriers: solar glass lines are capital-intensive, must run continuously, and reward daily melt capacity, captive raw materials and proximity to module factories. The overcapacity cycle reinforced this structure, because sustained prices below cash cost removed sub-scale producers and delayed greenfield entrants outside the leading cluster.
Competition is fought primarily on cost per square metre, yield and reliability of supply. Low iron content and high light transmission are expected rather than differentiating. Where vendors do differentiate, it is through coating performance, consistency of thin glass at low breakage rates, hail and mechanical load margin, and the ability to deliver qualified product to a module plant on short lead times. A second competitive layer exists in building-integrated glass, where architectural glass groups compete on colour, transparency, size, fire classification and facade system integration rather than on commodity cost.
Strategic activity concentrates on capacity discipline in the core market and selective diversification at the edges. Producers have idled or delayed furnace capacity to protect pricing, pushed product mix toward thinner panes and coated grades, and pursued joint ventures that place glass supply next to new module plants outside the established cluster. Architectural glass groups have moved in the opposite direction, treating photovoltaic glass as an extension of facade and specialty glazing rather than as a commodity line.
Strategic direction is converging on cost resilience and qualification depth, with carbon footprint of production emerging as a differentiator in tenders.
Recent Industry Developments
- June 2024: The Net-Zero Industry Act, Regulation (EU) 2024/1735, entered into force in the European Union – it sets domestic manufacturing capacity objectives for solar technologies and introduces non-price criteria in public auctions, improving the case for regional glass supply.
- July 2024: The Ecodesign for Sustainable Products Regulation, Regulation (EU) 2024/1781, entered into force – photovoltaic modules sit in the first working plan, so carbon footprint, durability and circularity rules will reach module glass specification.
- April 2024: India reinstated the Approved List of Models and Manufacturers requirement for solar modules in government-supported projects – it directed demand to domestically assembled modules and strengthened the case for local patterned glass capacity.
- June 2024: The two-year United States tariff moratorium on solar cells and modules from four Asian exporting countries expired – restored antidumping and countervailing duty exposure accelerated module assembly onshoring and raised interest in domestic component supply.
Companies Covered in the Report
- Xinyi Solar Holdings
- Flat Glass Group
- Saint-Gobain
- AGC Inc.
- Borosil Renewables
- CSG Holding
- Irico Group New Energy
- Almaden
- NSG Group
- Sisecam
- Guardian Glass
- Onyx Solar
- Interfloat Corporation
- Targray
Photovoltaic Glass Market Report Scope
| Metric | Value |
| Study Period | 2020–2033 |
| Market Size 2026 | US$ 21.6 Billion |
| Market Size 2033 | US$ 42.4 Billion |
| CAGR 2026–2033 | 10.1% |
| Absolute Dollar Opportunity | US$ 20.8 Billion |
| Largest Market | Asia Pacific (78% share in 2026) |
| Fastest-Growing Market | Middle East & Africa (14.6% CAGR) |
| Market Concentration | High |
| Major Players | Xinyi Solar Holdings, Flat Glass Group, Saint-Gobain, AGC Inc., Borosil Renewables |
Photovoltaic Glass Market Segmentation
Product Type
- Tempered Patterned Front Glass
- Thin Back Glass
- Transparent Conductive Oxide Coated Glass
- Laminated Building-Integrated Photovoltaic Glass
Thickness
- 3.2 mm and Above
- 2.0 mm to 2.5 mm
- Below 2.0 mm
Coating
- Anti-Reflective Coated
- Anti-Soiling and Dual-Function Coated
- Uncoated
Application
- Utility-Scale Solar
- Commercial and Industrial Rooftop
- Residential Rooftop
- Building-Integrated Photovoltaics
Regions
- North America
- Europe
- Asia Pacific
- Latin America
- Middle East & Africa
- Executive Summary
- Global Photovoltaic Glass Market Snapshot
- Future Projections
- Key Report Takeaways
- Regional Snapshot
- Market Overview
- Market Definition and Report Scope
- Historical Trends 2020–2025
- Market Dynamics
- Drivers
- Bifacial Glass-Glass Construction Doubles Glass Area per Module
- Durability and Safety Qualification Raises the Technical Bar for Solar Glass
- Restraints
- Overcapacity and Price Collapse Compress Solar Glass Margins
- Dual Certification for Building-Integrated Glass Slows Facade Adoption
- Market Opportunities
- Coated Glass for High-Soiling and High-Albedo Sites Opens a Premium Product Pool
- Localised Glass Capacity Outside China Creates a Policy-Backed Supply Opportunity
- Drivers
- Global Photovoltaic Glass Market Outlook, 2020–2033
- Global Photovoltaic Glass Market Outlook, by Product Type, Value (US$ Billion), 2020–2033
- Tempered Patterned Front Glass
- Thin Back Glass
- Transparent Conductive Oxide Coated Glass
- Laminated Building-Integrated Photovoltaic Glass
- Global Photovoltaic Glass Market Outlook, by Thickness, Value (US$ Billion), 2020–2033
- 3.2 mm and Above
- 2.0 mm to 2.5 mm
- Below 2.0 mm
- Global Photovoltaic Glass Market Outlook, by Coating, Value (US$ Billion), 2020–2033
- Anti-Reflective Coated
- Anti-Soiling and Dual-Function Coated
- Uncoated
- Global Photovoltaic Glass Market Outlook, by Application, Value (US$ Billion), 2020–2033
- Utility-Scale Solar
- Commercial and Industrial Rooftop
- Residential Rooftop
- Building-Integrated Photovoltaics
- Global Photovoltaic Glass Market Outlook, by Region, Value (US$ Billion), 2020–2033
- North America
- Europe
- Asia Pacific
- Latin America
- Middle East & Africa
- Global Photovoltaic Glass Market Outlook, by Product Type, Value (US$ Billion), 2020–2033
- North America Photovoltaic Glass Market Outlook, 2020–2033
- North America Photovoltaic Glass Market Outlook, by Product Type, Value (US$ Billion), 2020–2033
- Tempered Patterned Front Glass
- Thin Back Glass
- Transparent Conductive Oxide Coated Glass
- Laminated Building-Integrated Photovoltaic Glass
- North America Photovoltaic Glass Market Outlook, by Thickness, Value (US$ Billion), 2020–2033
- 3.2 mm and Above
- 2.0 mm to 2.5 mm
- Below 2.0 mm
- North America Photovoltaic Glass Market Outlook, by Coating, Value (US$ Billion), 2020–2033
- Anti-Reflective Coated
- Anti-Soiling and Dual-Function Coated
- Uncoated
- North America Photovoltaic Glass Market Outlook, by Application, Value (US$ Billion), 2020–2033
- Utility-Scale Solar
- Commercial and Industrial Rooftop
- Residential Rooftop
- Building-Integrated Photovoltaics
- North America Photovoltaic Glass Market Outlook, by Country, Value (US$ Billion), 2020–2033
- United States Photovoltaic Glass Market Outlook, by Product Type, 2020–2033
- United States Photovoltaic Glass Market Outlook, by Thickness, 2020–2033
- United States Photovoltaic Glass Market Outlook, by Coating, 2020–2033
- United States Photovoltaic Glass Market Outlook, by Application, 2020–2033
- North America Photovoltaic Glass Market Outlook, by Product Type, Value (US$ Billion), 2020–2033
- Europe Photovoltaic Glass Market Outlook, 2020–2033
- Europe Photovoltaic Glass Market Outlook, by Product Type, Value (US$ Billion), 2020–2033
- Tempered Patterned Front Glass
- Thin Back Glass
- Transparent Conductive Oxide Coated Glass
- Laminated Building-Integrated Photovoltaic Glass
- Europe Photovoltaic Glass Market Outlook, by Thickness, Value (US$ Billion), 2020–2033
- 3.2 mm and Above
- 2.0 mm to 2.5 mm
- Below 2.0 mm
- Europe Photovoltaic Glass Market Outlook, by Coating, Value (US$ Billion), 2020–2033
- Anti-Reflective Coated
- Anti-Soiling and Dual-Function Coated
- Uncoated
- Europe Photovoltaic Glass Market Outlook, by Application, Value (US$ Billion), 2020–2033
- Utility-Scale Solar
- Commercial and Industrial Rooftop
- Residential Rooftop
- Building-Integrated Photovoltaics
- Europe Photovoltaic Glass Market Outlook, by Country, Value (US$ Billion), 2020–2033
- Germany Photovoltaic Glass Market Outlook, by Product Type, 2020–2033
- Germany Photovoltaic Glass Market Outlook, by Thickness, 2020–2033
- Germany Photovoltaic Glass Market Outlook, by Coating, 2020–2033
- Germany Photovoltaic Glass Market Outlook, by Application, 2020–2033
- Italy Photovoltaic Glass Market Outlook, by Product Type, 2020–2033
- Italy Photovoltaic Glass Market Outlook, by Thickness, 2020–2033
- Italy Photovoltaic Glass Market Outlook, by Coating, 2020–2033
- Italy Photovoltaic Glass Market Outlook, by Application, 2020–2033
- Spain Photovoltaic Glass Market Outlook, by Product Type, 2020–2033
- Spain Photovoltaic Glass Market Outlook, by Thickness, 2020–2033
- Spain Photovoltaic Glass Market Outlook, by Coating, 2020–2033
- Spain Photovoltaic Glass Market Outlook, by Application, 2020–2033
- Netherlands Photovoltaic Glass Market Outlook, by Product Type, 2020–2033
- Netherlands Photovoltaic Glass Market Outlook, by Thickness, 2020–2033
- Netherlands Photovoltaic Glass Market Outlook, by Coating, 2020–2033
- Netherlands Photovoltaic Glass Market Outlook, by Application, 2020–2033
- Switzerland Photovoltaic Glass Market Outlook, by Product Type, 2020–2033
- Switzerland Photovoltaic Glass Market Outlook, by Thickness, 2020–2033
- Switzerland Photovoltaic Glass Market Outlook, by Coating, 2020–2033
- Switzerland Photovoltaic Glass Market Outlook, by Application, 2020–2033
- Europe Photovoltaic Glass Market Outlook, by Product Type, Value (US$ Billion), 2020–2033
- Asia Pacific Photovoltaic Glass Market Outlook, 2020–2033
- Asia Pacific Photovoltaic Glass Market Outlook, by Product Type, Value (US$ Billion), 2020–2033
- Tempered Patterned Front Glass
- Thin Back Glass
- Transparent Conductive Oxide Coated Glass
- Laminated Building-Integrated Photovoltaic Glass
- Asia Pacific Photovoltaic Glass Market Outlook, by Thickness, Value (US$ Billion), 2020–2033
- 3.2 mm and Above
- 2.0 mm to 2.5 mm
- Below 2.0 mm
- Asia Pacific Photovoltaic Glass Market Outlook, by Coating, Value (US$ Billion), 2020–2033
- Anti-Reflective Coated
- Anti-Soiling and Dual-Function Coated
- Uncoated
- Asia Pacific Photovoltaic Glass Market Outlook, by Application, Value (US$ Billion), 2020–2033
- Utility-Scale Solar
- Commercial and Industrial Rooftop
- Residential Rooftop
- Building-Integrated Photovoltaics
- Asia Pacific Photovoltaic Glass Market Outlook, by Country, Value (US$ Billion), 2020–2033
- China Photovoltaic Glass Market Outlook, by Product Type, 2020–2033
- China Photovoltaic Glass Market Outlook, by Thickness, 2020–2033
- China Photovoltaic Glass Market Outlook, by Coating, 2020–2033
- China Photovoltaic Glass Market Outlook, by Application, 2020–2033
- India Photovoltaic Glass Market Outlook, by Product Type, 2020–2033
- India Photovoltaic Glass Market Outlook, by Thickness, 2020–2033
- India Photovoltaic Glass Market Outlook, by Coating, 2020–2033
- India Photovoltaic Glass Market Outlook, by Application, 2020–2033
- Vietnam Photovoltaic Glass Market Outlook, by Product Type, 2020–2033
- Vietnam Photovoltaic Glass Market Outlook, by Thickness, 2020–2033
- Vietnam Photovoltaic Glass Market Outlook, by Coating, 2020–2033
- Vietnam Photovoltaic Glass Market Outlook, by Application, 2020–2033
- Malaysia Photovoltaic Glass Market Outlook, by Product Type, 2020–2033
- Malaysia Photovoltaic Glass Market Outlook, by Thickness, 2020–2033
- Malaysia Photovoltaic Glass Market Outlook, by Coating, 2020–2033
- Malaysia Photovoltaic Glass Market Outlook, by Application, 2020–2033
- Thailand Photovoltaic Glass Market Outlook, by Product Type, 2020–2033
- Thailand Photovoltaic Glass Market Outlook, by Thickness, 2020–2033
- Thailand Photovoltaic Glass Market Outlook, by Coating, 2020–2033
- Thailand Photovoltaic Glass Market Outlook, by Application, 2020–2033
- Asia Pacific Photovoltaic Glass Market Outlook, by Product Type, Value (US$ Billion), 2020–2033
- Latin America Photovoltaic Glass Market Outlook, 2020–2033
- Latin America Photovoltaic Glass Market Outlook, by Product Type, Value (US$ Billion), 2020–2033
- Tempered Patterned Front Glass
- Thin Back Glass
- Transparent Conductive Oxide Coated Glass
- Laminated Building-Integrated Photovoltaic Glass
- Latin America Photovoltaic Glass Market Outlook, by Thickness, Value (US$ Billion), 2020–2033
- 3.2 mm and Above
- 2.0 mm to 2.5 mm
- Below 2.0 mm
- Latin America Photovoltaic Glass Market Outlook, by Coating, Value (US$ Billion), 2020–2033
- Anti-Reflective Coated
- Anti-Soiling and Dual-Function Coated
- Uncoated
- Latin America Photovoltaic Glass Market Outlook, by Application, Value (US$ Billion), 2020–2033
- Utility-Scale Solar
- Commercial and Industrial Rooftop
- Residential Rooftop
- Building-Integrated Photovoltaics
- Latin America Photovoltaic Glass Market Outlook, by Country, Value (US$ Billion), 2020–2033
- Brazil Photovoltaic Glass Market Outlook, by Product Type, 2020–2033
- Brazil Photovoltaic Glass Market Outlook, by Thickness, 2020–2033
- Brazil Photovoltaic Glass Market Outlook, by Coating, 2020–2033
- Brazil Photovoltaic Glass Market Outlook, by Application, 2020–2033
- Chile Photovoltaic Glass Market Outlook, by Product Type, 2020–2033
- Chile Photovoltaic Glass Market Outlook, by Thickness, 2020–2033
- Chile Photovoltaic Glass Market Outlook, by Coating, 2020–2033
- Chile Photovoltaic Glass Market Outlook, by Application, 2020–2033
- Mexico Photovoltaic Glass Market Outlook, by Product Type, 2020–2033
- Mexico Photovoltaic Glass Market Outlook, by Thickness, 2020–2033
- Mexico Photovoltaic Glass Market Outlook, by Coating, 2020–2033
- Mexico Photovoltaic Glass Market Outlook, by Application, 2020–2033
- Colombia Photovoltaic Glass Market Outlook, by Product Type, 2020–2033
- Colombia Photovoltaic Glass Market Outlook, by Thickness, 2020–2033
- Colombia Photovoltaic Glass Market Outlook, by Coating, 2020–2033
- Colombia Photovoltaic Glass Market Outlook, by Application, 2020–2033
- Latin America Photovoltaic Glass Market Outlook, by Product Type, Value (US$ Billion), 2020–2033
- Middle East & Africa Photovoltaic Glass Market Outlook, 2020–2033
- Middle East & Africa Photovoltaic Glass Market Outlook, by Product Type, Value (US$ Billion), 2020–2033
- Tempered Patterned Front Glass
- Thin Back Glass
- Transparent Conductive Oxide Coated Glass
- Laminated Building-Integrated Photovoltaic Glass
- Middle East & Africa Photovoltaic Glass Market Outlook, by Thickness, Value (US$ Billion), 2020–2033
- 3.2 mm and Above
- 2.0 mm to 2.5 mm
- Below 2.0 mm
- Middle East & Africa Photovoltaic Glass Market Outlook, by Coating, Value (US$ Billion), 2020–2033
- Anti-Reflective Coated
- Anti-Soiling and Dual-Function Coated
- Uncoated
- Middle East & Africa Photovoltaic Glass Market Outlook, by Application, Value (US$ Billion), 2020–2033
- Utility-Scale Solar
- Commercial and Industrial Rooftop
- Residential Rooftop
- Building-Integrated Photovoltaics
- Middle East & Africa Photovoltaic Glass Market Outlook, by Country, Value (US$ Billion), 2020–2033
- Saudi Arabia Photovoltaic Glass Market Outlook, by Product Type, 2020–2033
- Saudi Arabia Photovoltaic Glass Market Outlook, by Thickness, 2020–2033
- Saudi Arabia Photovoltaic Glass Market Outlook, by Coating, 2020–2033
- Saudi Arabia Photovoltaic Glass Market Outlook, by Application, 2020–2033
- United Arab Emirates Photovoltaic Glass Market Outlook, by Product Type, 2020–2033
- United Arab Emirates Photovoltaic Glass Market Outlook, by Thickness, 2020–2033
- United Arab Emirates Photovoltaic Glass Market Outlook, by Coating, 2020–2033
- United Arab Emirates Photovoltaic Glass Market Outlook, by Application, 2020–2033
- Egypt Photovoltaic Glass Market Outlook, by Product Type, 2020–2033
- Egypt Photovoltaic Glass Market Outlook, by Thickness, 2020–2033
- Egypt Photovoltaic Glass Market Outlook, by Coating, 2020–2033
- Egypt Photovoltaic Glass Market Outlook, by Application, 2020–2033
- Oman Photovoltaic Glass Market Outlook, by Product Type, 2020–2033
- Oman Photovoltaic Glass Market Outlook, by Thickness, 2020–2033
- Oman Photovoltaic Glass Market Outlook, by Coating, 2020–2033
- Oman Photovoltaic Glass Market Outlook, by Application, 2020–2033
- Morocco Photovoltaic Glass Market Outlook, by Product Type, 2020–2033
- Morocco Photovoltaic Glass Market Outlook, by Thickness, 2020–2033
- Morocco Photovoltaic Glass Market Outlook, by Coating, 2020–2033
- Morocco Photovoltaic Glass Market Outlook, by Application, 2020–2033
- Middle East & Africa Photovoltaic Glass Market Outlook, by Product Type, Value (US$ Billion), 2020–2033
- Competitive Landscape
- Market Concentration and Industry Leaders
- Competitive Differentiation
- Strategic Moves and Market Direction
- Recent Industry Developments
- Company Profiles
- Xinyi Solar Holdings
- Flat Glass Group
- Saint-Gobain
- AGC Inc.
- Borosil Renewables
- CSG Holding
- Irico Group New Energy
- Almaden
- NSG Group
- Sisecam
- Guardian Glass
- Onyx Solar
- Interfloat Corporation
- Targray
- Appendix
- Research Methodology
- Report Assumptions
- Acronyms and Abbreviations
Product Type
- Tempered Patterned Front Glass
- Thin Back Glass
- Transparent Conductive Oxide Coated Glass
- Laminated Building-Integrated Photovoltaic Glass
Thickness
- 3.2 mm and Above
- 2.0 mm to 2.5 mm
- Below 2.0 mm
Coating
- Anti-Reflective Coated
- Anti-Soiling and Dual-Function Coated
- Uncoated
Application
- Utility-Scale Solar
- Commercial and Industrial Rooftop
- Residential Rooftop
- Building-Integrated Photovoltaics
Regions
- North America
- Europe
- Asia Pacific
- Latin America
- Middle East & Africa
Our Research Methodology
Considering the volatility of business today, traditional approaches to strategizing a game plan can be unfruitful if not detrimental. True ambiguity is no way to determine a forecast. A myriad of predetermined factors must be accounted for such as the degree of risk involved, the magnitude of circumstances, as well as conditions or consequences that are not known or unpredictable. To circumvent binary views that cast uncertainty, the application of market research intelligence to strategically posture, move, and enable actionable outcomes is necessary.
View Methodology
Quality Assured
Rigorous Validation Process

Confidentiality Assured
End-to-end Data Security

Custom Research Services
Tailored To Your Objectives
FAQs
The photovoltaic glass market is valued at US$ 21.6 billion in 2026, measured as solar glass consumed in module and building-integrated photovoltaic production worldwide.
The market is projected to reach US$ 42.4 billion by 2033 at a 10.1% CAGR, an absolute dollar opportunity of US$ 20.8 billion.
Tempered Patterned Front Glass leads with 56.3% share in 2026, since every crystalline silicon module requires a low-iron patterned front pane.
Anti-Soiling and Dual-Function Coated glass grows fastest at a 15.3% CAGR, followed by thin back glass below 2.0 mm at 14.4%.
Asia Pacific dominates with 78% share in 2026, because very large furnaces, captive raw materials and nearby module plants give unmatched unit costs.
Related Reports
Floating Storage and Regasification Unit Market Size, Share, Insights, Competitive Landscape, and Forecast 2026 to 2033
Floating storage and regasification unit market to grow from US$8.96 Bn in 2026 to US$13.92 Bn by 2033 at 6.5% CAGR. Explore types, mooring and regions.
Floating Solar Market Size, Share, Insights, Competitive Landscape, and Forecast 2026 to 2033
Floating solar market to grow from US$1.60 Bn in 2026 to US$4.02 Bn by 2033 at 14.1% CAGR. Explore capacities, products, locations and regional trends.
Offshore Grid Connection Solutions Market Size, Share, Insights, Competitive Landscape, and Forecast 2026 to 2033
Offshore grid connection solutions market to reach US$ 5.71 billion by 2033 at a 6.7% CAGR. Explore HVDC, subsea cables, applications and regional trends.
Nickel Hydrogen Batteries Market Size, Share, Insights, Competitive Landscape, and Forecast 2026 to 2033
Nickel hydrogen batteries market to reach US$11.85 billion by 2033 at 13.7% CAGR, driven by hybrid vehicles and stationary energy storage.
Landing String Equipment Market Size, Share, Insights, Competitive Landscape, and Forecast 2026 to 2033
Explore the landing string equipment market, reaching US$ 0.80 billion by 2033 at 6.6% CAGR, with component, technology and regional insights.
Fuel Cell Market Size, Share, Insights, Competitive Landscape, and Forecast 2026 to 2033
Fuel cell market to reach US$ 21.6 billion by 2033 at 17.0% CAGR. Explore technologies, applications, regions and key companies.