



Shale Gas Market
Shale Gas Market Size, Share, Insights, Competitive Landscape, and Forecast 2026 to 2033
Report Overview
Shale Gas Market Size and Trend Analysis
How Fast Is the Shale Gas Market Growing?
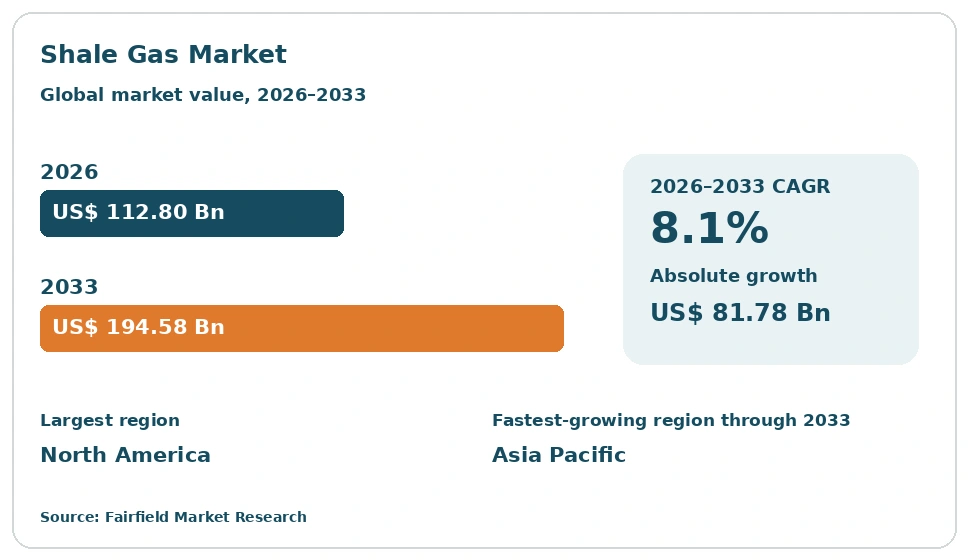
The global shale gas market size is expected to be valued at US$ 112.80 billion in 2026 and projected to reach US$ 194.58 billion by 2033, growing at a CAGR of 8.1% between 2026 and 2033.
Between 2020 and 2025, the market grew at a CAGR of about 8.3%, rising from roughly US$ 70 billion to US$ 104.35 billion, as low prices and drilling cuts in 2020 gave way to strong demand, a price spike in 2022, and rapid growth in liquefied natural gas exports from the United States. The shale gas market covers natural gas produced from fine-grained sedimentary rock with low permeability, using horizontal drilling and hydraulic fracturing to release gas trapped in the rock. Major basins include the Marcellus, Utica, Haynesville, and Permian in the United States, the Montney in Canada, Vaca Muerta in Argentina, and the Sichuan Basin in China. Shale gas is used for power generation, industry, homes, chemicals, and export. In 2025, China produced more than 27 billion cubic meters of shale gas.
Key Report Takeaways
- By Technology: Hydraulic Fracturing held about 58% share in 2025, while Horizontal Drilling is projected to expand at an 8.9% CAGR through 2033, driven by longer laterals, multi-well pads, and better drilling efficiency in major basins.
- By Application: Power Generation held about 36% share in 2025, while Industrial is projected to expand at an 8.7% CAGR through 2033, driven by chemical feedstock, fertilizer, and new manufacturing demand close to low-cost gas supply.
- By Gas Type: Dry Gas held about 60% share in 2025, while Associated Gas is projected to expand at an 8.6% CAGR through 2033, driven by rising oil-directed shale drilling that also produces large gas volumes.
- By Region: North America held about 72% share in 2025, while Asia Pacific is projected to expand at a 10.4% CAGR through 2033, driven by rapid shale development in China and new exploration in Australia and India.
Global Shale Gas Market Trends and Insights
Drivers Impact Analysis
Two drivers carry the strongest influence on shale gas market demand during the forecast period.
| Driver | Impact on CAGR Forecast | Geographic Relevance | Impact Timeline |
| Liquefied natural gas export growth | High | North America, Asia Pacific, Europe | Long term (≥4 years) |
| Rising power demand from data centers and coal replacement | High | Global | Medium term (2-4 years) |
LNG Exports Are Driving the Shale Gas Market
Liquefied natural gas export growth is the strongest driver of the shale gas market. Shale gas now supplies buyers around the world.
The mechanism is the large build-out of export terminals in Louisiana and Texas. The United States became the largest exporter of liquefied natural gas, and several new plants are starting up or expanding through the forecast period, each needing billions of cubic feet of feed gas per day. Most of this gas comes from the Haynesville, Permian, and Marcellus shales. Europe turned to these supplies after reducing pipeline imports from Russia, and buyers in Japan, South Korea, China, and India are signing long-term contracts. Japanese companies such as Mitsubishi and JERA are even buying shale fields directly. These trends support long-term production growth.
Power Demand Is Expanding the Shale Gas Market
Rising power demand from data centers and coal replacement is expanding the shale gas market. Electricity use is growing again in many countries.
The cause is new demand from data centers, artificial intelligence computing, electric vehicles, and factory construction. Gas-fired power plants can be built quickly, run around the clock, and back up wind and solar output, so utilities in the United States are planning many new gas plants. Several technology companies are signing direct gas power deals for data center campuses. Countries such as China and India are also using more gas to replace coal and cut air pollution. Shale gas offers low prices and large reserves, making it the main source for this new demand. These trends raise long-term gas consumption across power, industry, and new digital infrastructure.
Restraints Impact Analysis
Two restraints limit how quickly the shale gas market grows.
| Restraint | Impact on CAGR Forecast | Geographic Relevance | Impact Timeline |
| Environmental concerns and fracking bans | High | Europe, Latin America, Middle East & Africa | Long term (≥4 years) |
| Price volatility and pipeline constraints | Medium | North America | Short term (≤2 years) |
Environmental Concerns Slow the Shale Gas Market
Environmental concerns and fracking bans slow the shale gas market. Many people oppose fracking near their homes.
The problem is that hydraulic fracturing uses large amounts of water, sand, and chemicals, and it can cause water contamination risks, small earthquakes, truck traffic, and methane leaks. Methane is a powerful greenhouse gas, so leaks reduce the climate benefit of switching from coal to gas. Several countries in Europe, including France, Germany, and the United Kingdom, have banned or paused fracking, and some regions in other parts of the world have done the same. New methane rules in the United States and the European Union add monitoring and reporting costs. Climate policies that favor renewable energy may also reduce gas demand in the long term. These issues slow shale development outside North America.
Price Volatility Restricts the Shale Gas Market
Price volatility and pipeline constraints restrict the shale gas market. Gas prices can change quickly.
The constraint is that shale producers can raise output fast, which often leads to oversupply and low prices. In 2020 and again in 2023 and 2024, low gas prices forced producers to cut drilling and delay well completions. Prices then rose sharply when demand recovered or supply was disrupted. Pipeline shortages also limit growth, because new lines out of the Marcellus and Permian face permitting delays and legal challenges, which can trap gas in producing regions and push local prices very low. Weather, storage levels, and export plant outages add further uncertainty. Higher costs for steel, labor, and services can also squeeze margins when prices fall. These swings make investment planning harder for producers and service companies.
Market Opportunities
New Shale Basins Open a Fast-Growth Revenue Pool
New shale basins outside North America open a fast-growth revenue pool. Large shale resources remain undeveloped.
The opportunity comes from countries with big shale resources that are starting to develop them. Argentina is expanding gas output from Vaca Muerta and planning export terminals, while China keeps growing production in the Sichuan Basin with new deep and ultra-deep wells. Saudi Arabia is developing the large Jafurah unconventional gas field, and Australia is exploring the Beetaloo Basin. India and Algeria also hold large resources. These countries need drilling rigs, fracturing fleets, sand, chemicals, and expertise, creating demand for service companies and partners. Governments in several of these countries are offering better fiscal terms to attract investment. Companies that bring proven shale technology and lower-cost methods can win long contracts in these new basins.
Cleaner Production Creates a Growth Revenue Pool
Cleaner, lower-emission shale production creates a growth revenue pool. Buyers increasingly want gas with a smaller carbon footprint.
The opportunity reflects growing demand for certified low-methane gas from utilities and importers in Europe and Asia Pacific. Producers are investing in leak detection with drones, satellites, and sensors, replacing gas-powered equipment with electric versions, and using electric fracturing fleets powered by field gas. Water recycling reduces freshwater use and truck traffic, and carbon capture can store carbon dioxide removed from gas. Some new shale projects in Louisiana already include carbon capture from the start. Producers that can prove low emissions can sell gas at a premium and win long-term contracts. Service companies offering electric fleets, water recycling, and monitoring tools also benefit from steady demand as rules tighten.
Segment Analysis
By Technology: Hydraulic Fracturing Leads While Horizontal Drilling Grows Fastest
Hydraulic Fracturing held about 58% share in 2025. It pumps water, sand, and chemicals at high pressure into shale rock to create cracks that let gas flow to the well. Almost every shale well needs fracturing, and newer methods use more stages, more sand, and better designs to raise output per well.
Horizontal Drilling is the fastest-growing technology, expanding at an 8.9% CAGR through 2033. Wells turn sideways inside the shale layer and can run three miles or more, contacting far more rock than vertical wells. Multi-well pads drill many wells from one site, lowering costs and surface impact. Vertical drilling and acidizing form other segments. For the market, horizontal drilling growth improves productivity and lowers cost per unit of gas.
By Application: Power Generation Leads While Industrial Grows Fastest
Power Generation held about 36% share in 2025. Gas-fired power plants use shale gas to produce electricity for homes, businesses, and data centers, and they back up wind and solar power. Low gas prices helped replace many coal plants in the United States, and this demand keeps growing.
Industrial is the fastest-growing application, expanding at an 8.7% CAGR through 2033. Chemical plants use shale gas and its liquids to make ethylene, ammonia, fertilizers, methanol, and plastics, while steel, glass, and cement plants use gas for heat. Residential, Commercial, and Transportation form other applications, with gas used for heating, cooking, and truck and ship fuel. For the market, industrial growth reflects new factories built close to low-cost gas supply.
By Gas Type: Dry Gas Leads While Associated Gas Grows Fastest
Dry Gas held about 60% share in 2025. It comes mainly from gas-focused shales such as the Marcellus and Haynesville, which produce mostly methane with few liquids. These basins supply export terminals and power plants and have large reserves.
Associated Gas is the fastest-growing gas type, expanding at an 8.6% CAGR through 2033. It is produced alongside oil in shale plays such as the Permian, Eagle Ford, and Vaca Muerta, where oil drilling also brings up large gas volumes. New pipelines are carrying more of this gas to export terminals. Wet gas containing ethane, propane, and butane forms another segment that supplies chemical plants. For the market, associated gas growth adds supply even when gas prices are low.
Geography Analysis
Which Region Is Leading the Shale Gas Market?
North America is leading the shale gas market with about 72% share in 2025. The United States is the world’s largest shale gas producer, with major output from the Marcellus, Utica, Haynesville, and Permian basins, and it is also the largest exporter of liquefied natural gas. New export terminals and data center power demand are raising gas use. Canada produces shale gas from the Montney and Duvernay and is building export terminals on the west coast. Mexico imports large volumes of shale gas by pipeline. Key barriers include pipeline delays and price swings. One change shaping the region is foreign buyers acquiring shale assets.
Europe Shapes the Shale Gas Market Through Imports and Policy
Europe is a small shale gas producer but a major buyer of shale-based liquefied natural gas. France, Germany, the Netherlands, and the United Kingdom have banned or paused fracking because of public opposition, earthquake risks, and climate goals, while Poland and Ukraine tested shale wells with limited results. After cutting pipeline imports from Russia, the region built new import terminals and now buys large volumes of gas from the United States. New methane rules for imports will affect suppliers. Key barriers include fracking bans and climate policies. One opportunity is long-term contracts for certified low-emission gas.
Which Region Is Growing Fastest in the Shale Gas Market?
Asia Pacific is the fastest-growing shale gas market, expanding at a 10.4% CAGR through 2033. China produced more than 27 billion cubic meters of shale gas in 2025, led by China National Petroleum Corporation and Sinopec in the Sichuan Basin, and it is drilling deeper wells to raise output. Australia is exploring the Beetaloo Basin, and India is assessing shale resources in several basins. Japan and South Korea buy shale-based liquefied natural gas from the United States. Key barriers include difficult geology, water shortages, and high drilling costs. One change shaping the region is rising investment in deep shale technology.
Latin America Grows the Shale Gas Market Through Vaca Muerta
Latin America is a growing shale gas market led by Argentina. The Vaca Muerta formation is one of the world’s largest shale resources, and companies such as YPF, TotalEnergies, Pan American Energy, and Tecpetrol are increasing production. Argentina has moved from importing gas to exporting it to Chile and Brazil, and it is planning floating export terminals. Mexico has large shale resources but relies on cheap pipeline imports. Colombia has debated fracking pilots. Key barriers include pipeline limits, economic instability, and policy changes. One opportunity is new pipelines and liquefied natural gas exports from Argentina.
Middle East & Africa Builds the Shale Gas Market Through Unconventional Gas
Middle East & Africa is an emerging shale gas market. Saudi Arabia is developing the Jafurah field, one of the largest unconventional gas projects outside North America, to supply power plants and industry and free up oil for export. The United Arab Emirates and Oman are also developing unconventional gas. Algeria holds very large shale resources, while South Africa has studied the Karoo Basin. Key barriers include water scarcity, high costs, and local opposition in some countries. Gas from these projects is mainly used for power and petrochemicals. One opportunity is technology partnerships with experienced shale producers and service companies.
Competitive Landscape
The shale gas market is moderately fragmented. ExxonMobil, Chevron, EQT Corporation, Expand Energy, and China National Petroleum Corporation are leading players, while Sinopec, ConocoPhillips, Coterra Energy, Antero Resources, Range Resources, Shell, and YPF compete strongly. In the United States, large independent producers dominate gas-focused basins, while major oil companies lead associated gas output in the Permian. State-owned companies control most shale production in China and Argentina. Service companies such as SLB, Halliburton, and Baker Hughes supply drilling and fracturing.
Companies compete on cost per unit of gas, well productivity, reserve quality, pipeline access, and links to export terminals and power buyers. Scale matters because larger producers can drill longer laterals, share infrastructure, and negotiate better service prices. Producers also compete on emissions performance, as buyers in Europe and Asia Pacific increasingly prefer certified low-methane gas.
Strategic moves show how competition is changing. In January 2026, Mitsubishi Corporation agreed to buy Aethon Energy’s Haynesville business for US$ 5.2 billion. In February 2026, JERA completed a US$ 1.5 billion purchase of full ownership in a Haynesville asset. The same month, China reported record shale gas output. These moves show Asian buyers securing supply directly and shale growing outside North America.
Three themes shape vendor strategy. First, producers are consolidating to gain scale and lower costs. Second, they are linking production to liquefied natural gas exports and data center power demand through long-term contracts. Third, they are investing in methane monitoring, electric fracturing fleets, and carbon capture to meet buyer and regulatory expectations.
Shale Gas Market Industry Leaders
- ExxonMobil
- Chevron
- EQT Corporation
- Expand Energy
- China National Petroleum Corporation
Recent Industry Developments
- February 2026: JERA completed a US$ 1.5 billion purchase of full ownership in the South Mansfield Haynesville shale asset in Louisiana - secures feed gas for its liquefied natural gas contracts in the shale gas market.
- February 2026: China reported record 2025 natural gas output, with shale gas production above 27 billion cubic meters - shows rapid shale growth in Asia Pacific.
- January 2026: Mitsubishi Corporation agreed to acquire Aethon Energy’s Haynesville shale gas business, producing about 2.1 billion cubic feet per day, for US$ 5.2 billion - marks direct Asian investment in United States shale.
Companies Covered in the Report
- ExxonMobil
- Chevron
- EQT Corporation
- Expand Energy
- China National Petroleum Corporation
- Sinopec
- ConocoPhillips
- Coterra Energy
- Antero Resources
- Range Resources
- Shell
- YPF
Shale Gas Market Report Scope
This report covers the shale gas market, including natural gas produced from shale formations using hydraulic fracturing, horizontal drilling, vertical drilling, and other technologies, supplying power generation, industrial, residential, commercial, and transportation applications, across dry gas, associated gas, and wet gas. The base year is 2025, and the forecast period runs from 2026 to 2033. All values are expressed in US$ Billion.
| Technology | Hydraulic Fracturing, Horizontal Drilling, Vertical Drilling, Others |
| Application | Power Generation, Industrial, Residential, Commercial, Transportation |
| Gas Type | Dry Gas, Associated Gas, Wet Gas |
| Regions | North America, Europe, Asia Pacific, Latin America, Middle East & Africa |
1. Executive Summary
1.1 Shale Gas Market Snapshot
1.2 Future Projections
1.3 Key Market Trends
1.4 Regional Snapshot
2. Market Overview
2.1 Market Definition and Report Scope
2.2 Historical Market Trends
2.3 Market Dynamics
2.3.1 Drivers
2.3.1.1 LNG Exports Are Driving the Shale Gas Market
2.3.1.2 Power Demand Is Expanding the Shale Gas Market
2.3.2 Restraints
2.3.2.1 Environmental Concerns Slow the Shale Gas Market
2.3.2.2 Price Volatility Restricts the Shale Gas Market
2.3.3 Market Opportunities
2.3.3.1 New Shale Basins Open a Fast-Growth Revenue Pool
2.3.3.2 Cleaner Production Creates a Growth Revenue Pool
3. Global Shale Gas Market Outlook, 2020–2033
3.1 Global Shale Gas Market Outlook, by Technology, Value (US$ Billion), 2020–2033
3.1.1 Hydraulic Fracturing
3.1.2 Horizontal Drilling
3.1.3 Vertical Drilling
3.1.4 Others
3.2 Global Shale Gas Market Outlook, by Application, Value (US$ Billion), 2020–2033
3.2.1 Power Generation
3.2.2 Industrial
3.2.3 Residential
3.2.4 Commercial
3.2.5 Transportation
3.3 Global Shale Gas Market Outlook, by Gas Type, Value (US$ Billion), 2020–2033
3.3.1 Dry Gas
3.3.2 Associated Gas
3.3.3 Wet Gas
3.4 Global Shale Gas Market Outlook, by Region, Value (US$ Billion), 2020–2033
3.4.1 North America
3.4.2 Europe
3.4.3 Asia Pacific
3.4.4 Latin America
3.4.5 Middle East & Africa
4. North America Shale Gas Market Outlook, 2020–2033
4.1 North America Shale Gas Market Outlook, by Technology, Value (US$ Billion), 2020–2033
4.1.1 Hydraulic Fracturing
4.1.2 Horizontal Drilling
4.1.3 Vertical Drilling
4.1.4 Others
4.2 North America Shale Gas Market Outlook, by Application, Value (US$ Billion), 2020–2033
4.2.1 Power Generation
4.2.2 Industrial
4.2.3 Residential
4.2.4 Commercial
4.2.5 Transportation
4.3 North America Shale Gas Market Outlook, by Gas Type, Value (US$ Billion), 2020–2033
4.3.1 Dry Gas
4.3.2 Associated Gas
4.3.3 Wet Gas
4.4 North America Shale Gas Market Outlook, by Country, Value (US$ Billion), 2020–2033
4.4.1 United States Shale Gas Market Outlook, by Technology, 2020–2033
4.4.2 United States Shale Gas Market Outlook, by Application, 2020–2033
4.4.3 United States Shale Gas Market Outlook, by Gas Type, 2020–2033
4.4.4 Canada Shale Gas Market Outlook, by Technology, 2020–2033
4.4.5 Canada Shale Gas Market Outlook, by Application, 2020–2033
4.4.6 Canada Shale Gas Market Outlook, by Gas Type, 2020–2033
4.4.7 Mexico Shale Gas Market Outlook, by Technology, 2020–2033
4.4.8 Mexico Shale Gas Market Outlook, by Application, 2020–2033
4.4.9 Mexico Shale Gas Market Outlook, by Gas Type, 2020–2033
5. Europe Shale Gas Market Outlook, 2020–2033
5.1 Europe Shale Gas Market Outlook, by Technology, Value (US$ Billion), 2020–2033
5.1.1 Hydraulic Fracturing
5.1.2 Horizontal Drilling
5.1.3 Vertical Drilling
5.1.4 Others
5.2 Europe Shale Gas Market Outlook, by Application, Value (US$ Billion), 2020–2033
5.2.1 Power Generation
5.2.2 Industrial
5.2.3 Residential
5.2.4 Commercial
5.2.5 Transportation
5.3 Europe Shale Gas Market Outlook, by Gas Type, Value (US$ Billion), 2020–2033
5.3.1 Dry Gas
5.3.2 Associated Gas
5.3.3 Wet Gas
5.4 Europe Shale Gas Market Outlook, by Country, Value (US$ Billion), 2020–2033
5.4.1 France Shale Gas Market Outlook, by Technology, 2020–2033
5.4.2 France Shale Gas Market Outlook, by Application, 2020–2033
5.4.3 France Shale Gas Market Outlook, by Gas Type, 2020–2033
5.4.4 Germany Shale Gas Market Outlook, by Technology, 2020–2033
5.4.5 Germany Shale Gas Market Outlook, by Application, 2020–2033
5.4.6 Germany Shale Gas Market Outlook, by Gas Type, 2020–2033
5.4.7 Netherlands Shale Gas Market Outlook, by Technology, 2020–2033
5.4.8 Netherlands Shale Gas Market Outlook, by Application, 2020–2033
5.4.9 Netherlands Shale Gas Market Outlook, by Gas Type, 2020–2033
5.4.10 United Kingdom Shale Gas Market Outlook, by Technology, 2020–2033
5.4.11 United Kingdom Shale Gas Market Outlook, by Application, 2020–2033
5.4.12 United Kingdom Shale Gas Market Outlook, by Gas Type, 2020–2033
5.4.13 Poland Shale Gas Market Outlook, by Technology, 2020–2033
5.4.14 Poland Shale Gas Market Outlook, by Application, 2020–2033
5.4.15 Poland Shale Gas Market Outlook, by Gas Type, 2020–2033
5.4.16 Russia Shale Gas Market Outlook, by Technology, 2020–2033
5.4.17 Russia Shale Gas Market Outlook, by Application, 2020–2033
5.4.18 Russia Shale Gas Market Outlook, by Gas Type, 2020–2033
5.4.19 United States Shale Gas Market Outlook, by Technology, 2020–2033
5.4.20 United States Shale Gas Market Outlook, by Application, 2020–2033
5.4.21 United States Shale Gas Market Outlook, by Gas Type, 2020–2033
6. Asia Pacific Shale Gas Market Outlook, 2020–2033
6.1 Asia Pacific Shale Gas Market Outlook, by Technology, Value (US$ Billion), 2020–2033
6.1.1 Hydraulic Fracturing
6.1.2 Horizontal Drilling
6.1.3 Vertical Drilling
6.1.4 Others
6.2 Asia Pacific Shale Gas Market Outlook, by Application, Value (US$ Billion), 2020–2033
6.2.1 Power Generation
6.2.2 Industrial
6.2.3 Residential
6.2.4 Commercial
6.2.5 Transportation
6.3 Asia Pacific Shale Gas Market Outlook, by Gas Type, Value (US$ Billion), 2020–2033
6.3.1 Dry Gas
6.3.2 Associated Gas
6.3.3 Wet Gas
6.4 Asia Pacific Shale Gas Market Outlook, by Country, Value (US$ Billion), 2020–2033
6.4.1 China Shale Gas Market Outlook, by Technology, 2020–2033
6.4.2 China Shale Gas Market Outlook, by Application, 2020–2033
6.4.3 China Shale Gas Market Outlook, by Gas Type, 2020–2033
6.4.4 Australia Shale Gas Market Outlook, by Technology, 2020–2033
6.4.5 Australia Shale Gas Market Outlook, by Application, 2020–2033
6.4.6 Australia Shale Gas Market Outlook, by Gas Type, 2020–2033
6.4.7 India Shale Gas Market Outlook, by Technology, 2020–2033
6.4.8 India Shale Gas Market Outlook, by Application, 2020–2033
6.4.9 India Shale Gas Market Outlook, by Gas Type, 2020–2033
6.4.10 Japan Shale Gas Market Outlook, by Technology, 2020–2033
6.4.11 Japan Shale Gas Market Outlook, by Application, 2020–2033
6.4.12 Japan Shale Gas Market Outlook, by Gas Type, 2020–2033
6.4.13 South Korea Shale Gas Market Outlook, by Technology, 2020–2033
6.4.14 South Korea Shale Gas Market Outlook, by Application, 2020–2033
6.4.15 South Korea Shale Gas Market Outlook, by Gas Type, 2020–2033
6.4.16 United States Shale Gas Market Outlook, by Technology, 2020–2033
6.4.17 United States Shale Gas Market Outlook, by Application, 2020–2033
6.4.18 United States Shale Gas Market Outlook, by Gas Type, 2020–2033
7. Latin America Shale Gas Market Outlook, 2020–2033
7.1 Latin America Shale Gas Market Outlook, by Technology, Value (US$ Billion), 2020–2033
7.1.1 Hydraulic Fracturing
7.1.2 Horizontal Drilling
7.1.3 Vertical Drilling
7.1.4 Others
7.2 Latin America Shale Gas Market Outlook, by Application, Value (US$ Billion), 2020–2033
7.2.1 Power Generation
7.2.2 Industrial
7.2.3 Residential
7.2.4 Commercial
7.2.5 Transportation
7.3 Latin America Shale Gas Market Outlook, by Gas Type, Value (US$ Billion), 2020–2033
7.3.1 Dry Gas
7.3.2 Associated Gas
7.3.3 Wet Gas
7.4 Latin America Shale Gas Market Outlook, by Country, Value (US$ Billion), 2020–2033
7.4.1 Argentina Shale Gas Market Outlook, by Technology, 2020–2033
7.4.2 Argentina Shale Gas Market Outlook, by Application, 2020–2033
7.4.3 Argentina Shale Gas Market Outlook, by Gas Type, 2020–2033
7.4.4 Chile Shale Gas Market Outlook, by Technology, 2020–2033
7.4.5 Chile Shale Gas Market Outlook, by Application, 2020–2033
7.4.6 Chile Shale Gas Market Outlook, by Gas Type, 2020–2033
7.4.7 Brazil Shale Gas Market Outlook, by Technology, 2020–2033
7.4.8 Brazil Shale Gas Market Outlook, by Application, 2020–2033
7.4.9 Brazil Shale Gas Market Outlook, by Gas Type, 2020–2033
7.4.10 Mexico Shale Gas Market Outlook, by Technology, 2020–2033
7.4.11 Mexico Shale Gas Market Outlook, by Application, 2020–2033
7.4.12 Mexico Shale Gas Market Outlook, by Gas Type, 2020–2033
7.4.13 Colombia Shale Gas Market Outlook, by Technology, 2020–2033
7.4.14 Colombia Shale Gas Market Outlook, by Application, 2020–2033
7.4.15 Colombia Shale Gas Market Outlook, by Gas Type, 2020–2033
8. Middle East & Africa Shale Gas Market Outlook, 2020–2033
8.1 Middle East & Africa Shale Gas Market Outlook, by Technology, Value (US$ Billion), 2020–2033
8.1.1 Hydraulic Fracturing
8.1.2 Horizontal Drilling
8.1.3 Vertical Drilling
8.1.4 Others
8.2 Middle East & Africa Shale Gas Market Outlook, by Application, Value (US$ Billion), 2020–2033
8.2.1 Power Generation
8.2.2 Industrial
8.2.3 Residential
8.2.4 Commercial
8.2.5 Transportation
8.3 Middle East & Africa Shale Gas Market Outlook, by Gas Type, Value (US$ Billion), 2020–2033
8.3.1 Dry Gas
8.3.2 Associated Gas
8.3.3 Wet Gas
8.4 Middle East & Africa Shale Gas Market Outlook, by Country, Value (US$ Billion), 2020–2033
8.4.1 Saudi Arabia Shale Gas Market Outlook, by Technology, 2020–2033
8.4.2 Saudi Arabia Shale Gas Market Outlook, by Application, 2020–2033
8.4.3 Saudi Arabia Shale Gas Market Outlook, by Gas Type, 2020–2033
8.4.4 United Arab Emirates Shale Gas Market Outlook, by Technology, 2020–2033
8.4.5 United Arab Emirates Shale Gas Market Outlook, by Application, 2020–2033
8.4.6 United Arab Emirates Shale Gas Market Outlook, by Gas Type, 2020–2033
8.4.7 Oman Shale Gas Market Outlook, by Technology, 2020–2033
8.4.8 Oman Shale Gas Market Outlook, by Application, 2020–2033
8.4.9 Oman Shale Gas Market Outlook, by Gas Type, 2020–2033
8.4.10 Algeria Shale Gas Market Outlook, by Technology, 2020–2033
8.4.11 Algeria Shale Gas Market Outlook, by Application, 2020–2033
8.4.12 Algeria Shale Gas Market Outlook, by Gas Type, 2020–2033
8.4.13 South Africa Shale Gas Market Outlook, by Technology, 2020–2033
8.4.14 South Africa Shale Gas Market Outlook, by Application, 2020–2033
8.4.15 South Africa Shale Gas Market Outlook, by Gas Type, 2020–2033
9. Competitive Landscape
9.1 Shale Gas Market Industry Leaders
9.2 Recent Industry Developments
9.3 Company Profiles
9.3.1 ExxonMobil
9.3.2 Chevron
9.3.3 EQT Corporation
9.3.4 Expand Energy
9.3.5 China National Petroleum Corporation
9.3.6 Sinopec
9.3.7 ConocoPhillips
9.3.8 Coterra Energy
9.3.9 Antero Resources
9.3.10 Range Resources
9.3.11 Shell
9.3.12 YPF
10. Appendix
10.1 Research Methodology
10.2 Report Assumptions
10.3 Acronyms and Abbreviations
| Technology | Hydraulic Fracturing, Horizontal Drilling, Vertical Drilling, Others |
| Application | Power Generation, Industrial, Residential, Commercial, Transportation |
| Gas Type | Dry Gas, Associated Gas, Wet Gas |
| Regions | North America, Europe, Asia Pacific, Latin America, Middle East & Africa |
Our Research Methodology
Considering the volatility of business today, traditional approaches to strategizing a game plan can be unfruitful if not detrimental. True ambiguity is no way to determine a forecast. A myriad of predetermined factors must be accounted for such as the degree of risk involved, the magnitude of circumstances, as well as conditions or consequences that are not known or unpredictable. To circumvent binary views that cast uncertainty, the application of market research intelligence to strategically posture, move, and enable actionable outcomes is necessary.
View Methodology
Quality Assured
Rigorous Validation Process

Confidentiality Assured
End-to-end Data Security

Custom Research Services
Tailored To Your Objectives
FAQs
The shale gas market is valued at US$ 112.80 billion in 2026, led by hydraulic fracturing, power generation, and North America.
The market is projected to reach US$ 194.58 billion by 2033, growing at an 8.1% CAGR and adding US$ 81.78 billion.
Industrial is growing fastest at an 8.7% CAGR through 2033, driven by chemical feedstock, fertilizer, and manufacturing near low-cost gas supply.
Asia Pacific is growing fastest at a 10.4% CAGR through 2033, driven by deep shale development in China and new exploration elsewhere.
North America holds the largest share at about 72% in 2025, supported by major United States basins and liquefied natural gas exports.
Related Reports
Bunker Fuel Market Size, Share, Insights, Competitive Landscape, and Forecast 2026 to 2033
Explore the bunker fuel market outlook for 2026–2033, covering fuel types, vessels, sellers, regional trends, and leading companies.
Bus HVAC Systems Market Size, Share, Insights, Competitive Landscape, and Forecast 2026 to 2033
Explore the bus HVAC systems market outlook for 2026–2033, covering bus types, propulsion, cooling capacity, regional trends, and leading companies.
Frameless Solar Panels Market Size, Share, Insights, Competitive Landscape, and Forecast 2026 to 2033
Explore the frameless solar panels market outlook for 2026–2033, with cell technologies, mounting trends, regional demand, and competitive insights.
Building Energy Management Systems Market Size, Share, Insights, Competitive Landscape, and Forecast 2026 to 2033
Explore the building energy management systems market outlook for 2026–2033, with component trends, deployment insights, regions, and key suppliers.
Fuel Management System Market Size, Share, Insights, Competitive Landscape, and Forecast 2026 to 2033
The global fuel management system market is valued at US$21.4 billion in 2026, reaching US$38.6 billion by 2033, growing at an 8.8% CAGR
Oil Immersed Current Transformer Market Size, Share, Insights, Competitive Landscape, and Forecast 2026 to 2033
The oil immersed current transformer market is projected to grow from US$2.4 billion in 2026 to US$3.6 billion by 2033 at a 6.0% CAGR.