Global Textile Chemicals Market: Comprehensive Strategic Analysis
Executive Summary & Key Highlights
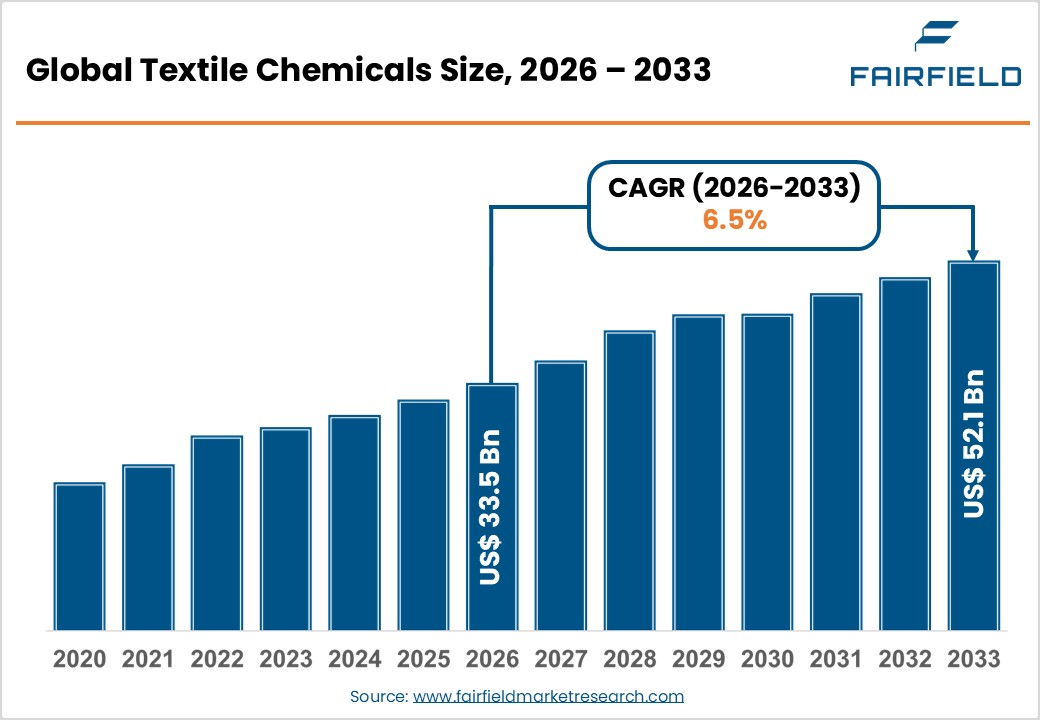
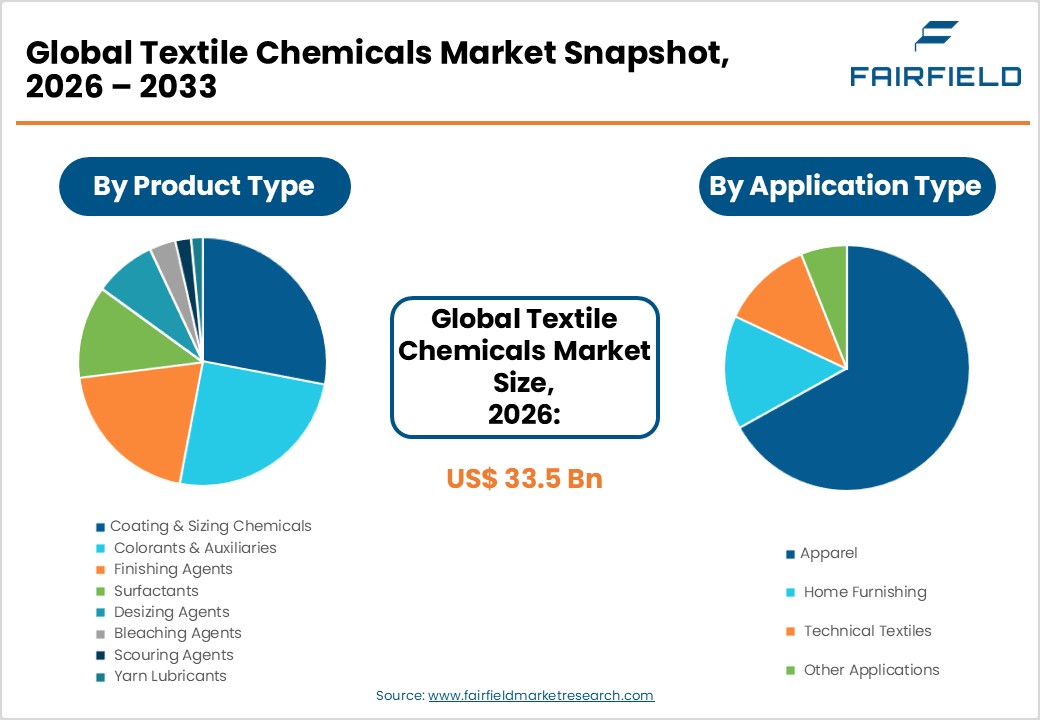
- The global textile chemicals market size is likely to be valued at USD 33.5 billion in 2026 and is expected to reach USD 52.1 billion by 2033, growing at a CAGR of 6.50% during the forecast period from 2026 to 2033.
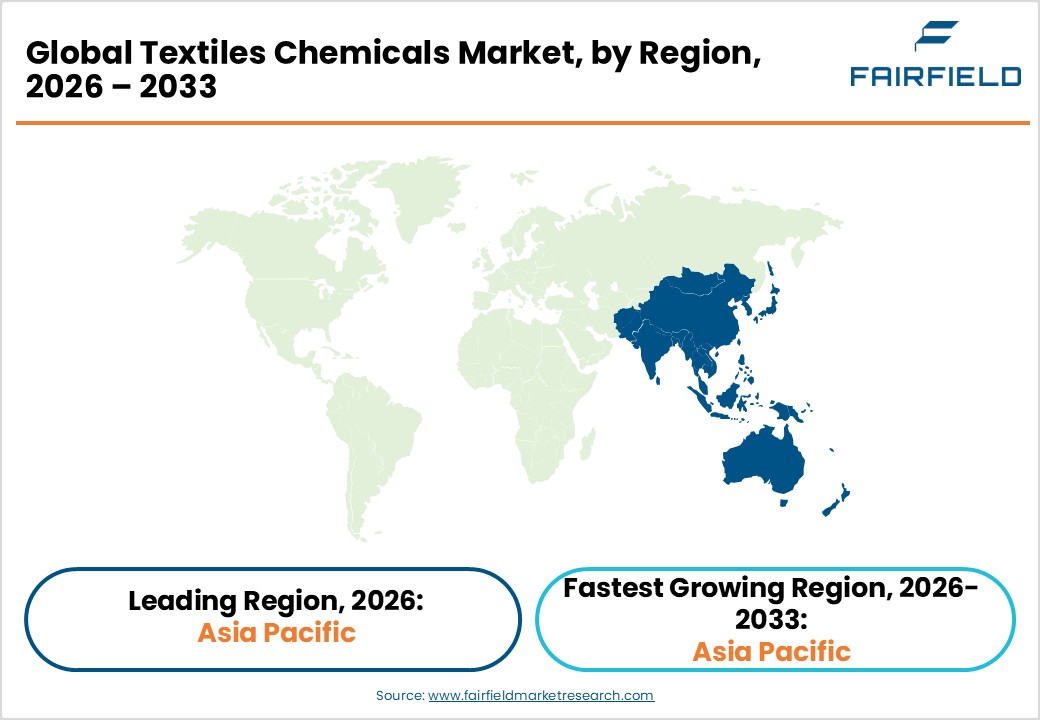
- Asia Pacific leads the global Textile Chemicals market with approximately 57.6% share, driven by China, India, and ASEAN's dominant textile manufacturing base and growing export volumes.
- North America is the fastest-growing region, fueled by reshoring of technical textile production, strict EPA regulations fostering green chemical innovation, and strong military textile procurement.
- The Apparel segment commands approximately 46% of market share by application, driven by massive global garment production volumes and increasing demand for functional, performance-oriented fabrics.
- Coating chemicals are the fastest-growing product segment, propelled by surging demand for water repellent, flame-retardant, and antimicrobial coatings in technical and protective textiles.
- The accelerating shift toward sustainable textiles presents a major opportunity, with brands mandating eco-certified inputs, creating substantial demand for bio-based and REACH-compliant chemical formulations.
Market Dynamics: Drivers, Restraints, and Opportunities Analysis
Market Growth Drivers
- Surging Demand for Functional and Technical Textiles
The global technical textiles industry has witnessed sustained expansion, driven by growing applications in medical, automotive, construction, and defense sectors. According to the Indian Ministry of Textiles, the global technical textiles market is projected to grow at a significant pace, with India alone targeting USD 40 billion in technical textiles production by 2030-31. This sector demands specialized chemicals such as flame retardants, antimicrobial agents, water repellents, and UV stabilizers. The rising penetration of smart and performance fabrics in sportswear, protective clothing, and medical textiles directly amplifies demand for advanced textile chemicals. Furthermore, the growing adoption of nonwoven textiles is projected to be a high-growth sub-sector globally, further reinforcing sustained demand for textile chemical inputs.
- Rapid Expansion of the Global Apparel Industry
The global apparel market remains a cornerstone driver for textile chemicals consumption. The World Trade Organization (WTO) reported that global textile and clothing exports exceeded USD 900 billion in recent years, reflecting the sheer volume of fabric processed annually. Each meter of fabric undergoes multiple chemical treatment stages, pretreatment, dyeing, and finishing, each consuming diverse chemicals. The rise of fast fashion and the associated rapid turnover of garment production significantly amplifies aggregate chemical consumption. Moreover, with major apparel brands sourcing increasingly from South and Southeast Asia, the demand for textile chemicals in these regions is poised for accelerated growth, creating favorable conditions for market participants to expand operations and product offerings.
Market Restraints
- Stringent Environmental Regulations on Chemical Discharge
The textile dyeing and finishing sector is one of the largest contributors to industrial water pollution globally. The European Chemicals Agency (ECHA) and REACH regulations have placed strict restrictions on hazardous substances such as azo dyes, formaldehyde, and perfluorinated compounds (PFCs) used in textile processing. Compliance with these regulations necessitates costly reformulation and R&D investment. For small and medium-sized manufacturers, particularly in developing economies, meeting these standards imposes significant operational burdens. Non-compliance risks include product bans, export restrictions, and reputational damage, all of which constrain market growth and raise the cost structure for textile chemical producers globally.
- Volatility in Raw Material Prices
Textile chemicals are predominantly derived from petrochemical feedstocks, including benzene, ethylene, and propylene. Fluctuations in crude oil prices driven by geopolitical tensions, supply chain disruptions, and OPEC+ policy decisions directly impact the cost of producing surfactants, finishing agents, and other core textile chemicals. According to the International Energy Agency (IEA), energy and petrochemical price volatility remains a structural challenge. These price swings compress margins for chemical manufacturers, disrupt long-term pricing agreements with textile mills, and ultimately dampen investment in new product development. This raw material dependency represents a persistent restraint on stable market growth.
Market Opportunities
- Growing Adoption of Sustainable and Bio-Based Textile Chemicals
The global sustainability movement is reshaping the textile chemicals landscape, presenting a transformative opportunity for innovation-driven companies. The European Union's Green Deal and the Sustainable Apparel Coalition's Higg Index are pushing brands to adopt eco-certified chemicals across their supply chains. Bio-based surfactants, enzyme-based desizing agents, and waterless dyeing technologies are gaining rapid traction. Companies such as Archroma have already launched entire portfolios of sustainable chemical solutions branded under their EarthColors® line. The market for green chemicals in textiles is expected to expand as brands like H&M, Zara, and Patagonia increasingly mandate the use of bluesign®-certified chemicals, offering a high-growth opportunity for suppliers who align with these sustainability standards.
- Expansion of Coating Chemicals in Technical and Protective Textiles
The rapid rise of technical textiles, particularly in geotextiles, medical textiles, and protective workwear presents a compelling opportunity for textile coating chemical manufacturers. The U.S. Department of Labor has increasingly reinforced occupational safety standards, driving demand for flame-retardant and chemical-resistant coated textiles. Globally, the construction and infrastructure boom particularly in India under the National Infrastructure Pipeline (NIP) worth USD 1.4 trillion is fueling demand for geotextiles treated with specialized coating chemicals. Furthermore, the COVID-19 pandemic legacy has cemented demand for antimicrobial and antiviral-coated medical textiles, creating a durable new end-use segment for coating chemical innovations.
Segmentation Analysis: Category-Wise Strategic Assessment
- By Process Analysis
The Pretreatment process segment holds the leading share in the Textile Chemicals market by process, accounting for approximately 42% of the total market. Pretreatment is an indispensable first step in textile manufacturing, encompassing bleaching, desizing, and scouring to prepare raw fibers for dyeing and finishing. The universal applicability of pretreatment chemicals across all textile types natural fibers such as cotton and wool, as well as synthetic blends ensures consistently high demand. According to the Textile Institute International, over 80% of all woven and knitted fabrics undergo at least one form of pretreatment. The growing scale of textile production in Asia Pacific, combined with the increasing adoption of continuous processing technologies, reinforces pretreatment's dominant share in the overall process-based segmentation.
- By Product Analysis
Among all product categories, Colorants & Auxiliaries represent the dominant segment, holding approximately 28% of the total product-based market share. Colorants including reactive dyes, disperse dyes, vat dyes, and pigments are essential for virtually all end-use textile applications. Auxiliaries such as leveling agents, fixing agents, and dispersants are critical co-inputs that ensure uniform color application and washing fastness. The Society of Dyers and Colourists (SDC) estimates that the global textile dye market consumes hundreds of thousands of metric tons of colorants annually. The consistent expansion of the apparel sector, rising demand for vibrant and durable colors in home furnishings, and the proliferation of digital textile printing technologies collectively underpin the segment's leadership position.
- By Application Analysis
The Apparel segment dominates the Textile Chemicals market by application, commanding approximately 46% of the total market share. Apparel manufacturing is the single largest consumer of textile chemicals, engaging the full spectrum of chemical treatments from pretreatment and dyeing to finishing and functional coating. The Food and Agriculture Organization of the United Nations (FAO) reports that global cotton production a key raw material for the apparel segment consistently exceeds 25 million metric tons annually, underscoring the massive scale of fabric processing involved. The rise of performance apparel, athleisure, and sustainable fashion has further increased the complexity and quantity of chemical inputs required per garment, reinforcing the segment's commanding position in the overall application landscape.
Regional Market Assessment: Strategic Geography Analysis
- North America Textile Chemicals Trends
North America is the fastest-growing regional market for textile chemicals, propelled by strong domestic demand for technical and high-performance textiles and a well-established regulatory framework that incentivizes innovation. The U.S. Environmental Protection Agency (EPA) enforces stringent standards under the Clean Water Act and Toxic Substances Control Act (TSCA), which have driven investment in next-generation, low-impact chemical formulations. The U.S. textile and apparel industry supports over 500,000 jobs, with government initiatives like the Made in America initiative boosting reshoring activity.
The Defense Logistics Agency (DLA) of the U.S. government procures large volumes of flame-retardant and chemical-resistant textiles for military applications, fueling consistent demand for specialty textile chemicals. Additionally, Canada's growing sustainable fashion ecosystem and substantial investments in bio-based chemical R&D by companies such as Evonik Industries and The Lubrizol Corporation are creating new avenues for market growth. The region's innovation ecosystem, characterized by active university-industry partnerships and federal R&D funding, positions North America as a critical hub for next-generation textile chemical development.
- Europe Textile Chemicals Trends
Europe remains a pivotal market for textile chemicals, driven by a sophisticated regulatory environment and a strong emphasis on sustainable textile production. The EU's REACH regulation and the European Green Deal have fundamentally reshaped the chemical procurement strategies of textile manufacturers across Germany, France, Italy, Spain, and the U.K. Germany is particularly notable as a hub for high-value technical textiles and automotive fabrics, where premium coating and finishing chemicals are in high demand.
The U.K. post-Brexit has maintained alignment with EU chemical standards while exploring bilateral trade agreements that may introduce competitive pricing opportunities. France's luxury fashion sector drives steady demand for specialty dyestuffs and softeners, while Spain and Italy serve as important production hubs. The European Chemicals Agency (ECHA) continues to expand its SVHC (Substances of Very High Concern) list, necessitating ongoing R&D investment from chemical suppliers. This regulatory harmonization, while challenging, also creates competitive moats for compliant European chemical manufacturers.
- Asia Pacific Textile Chemicals Trends
Asia Pacific is the undisputed leader in the global Textile Chemicals market, accounting for approximately 57.6% of the total market share. The region's dominance is anchored by its massive textile manufacturing base, with China, India, Bangladesh, Vietnam, and Indonesia collectively producing the majority of the world's apparel and home textiles. China alone accounted for approximately 38% of global textile fiber consumption, according to the International Cotton Advisory Committee (ICAC), driving enormous volumes of dyeing, finishing, and pretreatment chemicals.
India's Production Linked Incentive (PLI) Scheme for Textiles is accelerating investment in man-made fiber and technical textile production, creating new demand pools for specialty chemicals. Vietnam and Bangladesh have emerged as high-growth textile hubs as global brands diversify supply chains away from China. ASEAN nations' favorable trade agreements with the EU and U.S. further stimulate textile export volumes, amplifying regional chemical demand. The proliferation of local chemical manufacturers in India and China also enables competitive pricing, further reinforcing Asia Pacific's market leadership.
Competitive Landscape: Market Structure and Strategic Positioning
The global Textile Chemicals market is moderately consolidated, with a mix of multinational chemical conglomerates and specialized regional players. Global leaders such as BASF SE, Archroma, Huntsman International, Evonik Industries, and Solvay S.A. dominate through extensive product portfolios, global distribution networks, and sustained R&D investment. These companies differentiate through proprietary formulations, sustainability certifications, and value-added technical services to textile mills. Strategically, leading players are pursuing acquisitions, capacity expansions in Asia Pacific, and collaboration with apparel brands to develop certified sustainable chemical solutions. The market also witnesses growing competition from agile regional manufacturers in India and China that compete on price, challenging the margins of global players in commodity chemical segments.
Key Players
- Archroma
- Dow
- BASF SE
- AB Enzymes
- Kemira Oyj
- Kiri Industries Ltd.
- BioTex Malaysia
- Ethox Chemicals, LLC
- Evonik Industries AG
- Fibro Chem, LLC
- German Chemicals Ltd.
- Govi N.V.
- Huntsman International LLC
- OMNOVA Solutions Inc.
- Omya United Chemicals
- Organic Dyes and Pigments
- Resil Chemicals Pvt. Ltd.
- LANXESS
- The Lubrizol Corporation
- Solvay S.A.
- DyStar Group
- Clariant AG
- Pulcra Chemicals GmbH
Key Industry Developments
- January 2025: Archroma announced the global expansion of its EarthColors® sustainable dye portfolio, partnering with major European apparel brands to replace conventional synthetic dyes with bio-based colorant solutions across their supply chains.
- September 2024: BASF SE launched a next-generation range of low-formaldehyde textile finishing agents targeting Asian export-oriented garment manufacturers, aligned with tightened EU and U.S. import chemical safety standards.
- March 2024: Huntsman International LLC expanded its textile effects manufacturing capacity in India, investing significantly in a new specialty chemicals production facility near Vadodara to serve the rapidly growing South Asian textile chemicals demand.
Textiles chemicals Market Segmentation-
By Process
- Pretreatment
- Bleaching Agents
- Desizing Agents
- Scouring Agents
- Others
- Coating
- Anti-Piling
- Protection
- Water Proofing
- Water Repellant
- Others
- Treatment Of Finished Products
- Softening
- Stiffening
- Others
By Product
- Coating & Sizing Chemicals
- Colorants & Auxiliaries
- Finishing Agents
- Surfactants
- Desizing Agents
- Bleaching Agents
- Scouring Agents
- Yarn Lubricants
By Application
- Apparel
- Home Furnishing
- Technical Textiles
- Other Applications
By Region
- North America
- Europe
- Asia Pacific
- Latin America
- Middle East & Africa
- Executive Summary
- Global Textiles Chemicals Snapshot
- Future Projections
- Key Market Trends
- Regional Snapshot, by Value, 2026
- Analyst Recommendations
- Market Overview
- Market Definitions and Segmentations
- Market Dynamics
- Drivers
- Restraints
- Market Opportunities
- Value Chain Analysis
- COVID-19 Impact Analysis
- Porter's Five Forces Analysis
- Impact of Russia-Ukraine Conflict
- PESTLE Analysis
- Regulatory Analysis
- Price Trend Analysis
- Current Prices and Future Projections, 2025-2033
- Price Impact Factors
- Global Textiles Chemicals Outlook, 2020 - 2033
- Global Textiles Chemicals Outlook, by Product, Value (US$ Bn), 2020-2033
- Coating & Sizing Chemicals
- Colorants & Auxiliaries
- Finishing Agents
- Surfactants
- Desizing Agents
- Bleaching Agents
- Scouring Agents
- Yarn Lubricants
- Global Textiles Chemicals Outlook, by Application, Value (US$ Bn), 2020-2033
- Apparel
- Home Furnishing
- Technical Textiles
- Other Applications
- Global Textiles Chemicals Outlook, by Process, Value (US$ Bn), 2020-2033
- Pretreatment
- Coating
- Treatment Of Finished Products
- Global Textiles Chemicals Outlook, by Region, Value (US$ Bn), 2020-2033
- North America
- Europe
- Asia Pacific
- Latin America
- Middle East & Africa
- Global Textiles Chemicals Outlook, by Product, Value (US$ Bn), 2020-2033
- North America Textiles Chemicals Outlook, 2020 - 2033
- North America Textiles Chemicals Outlook, by Product, Value (US$ Bn), 2020-2033
- Coating & Sizing Chemicals
- Colorants & Auxiliaries
- Finishing Agents
- Surfactants
- Desizing Agents
- Bleaching Agents
- Scouring Agents
- Yarn Lubricants
- North America Textiles Chemicals Outlook, by Application, Value (US$ Bn), 2020-2033
- Apparel
- Home Furnishing
- Technical Textiles
- Other Applications
- North America Textiles Chemicals Outlook, by Process, Value (US$ Bn), 2020-2033
- Pretreatment
- Coating
- Treatment Of Finished Products
- North America Textiles Chemicals Outlook, by Country, Value (US$ Bn), 2020-2033
- U.S. Textiles Chemicals Outlook, by Product, 2020-2033
- U.S. Textiles Chemicals Outlook, by Application, 2020-2033
- U.S. Textiles Chemicals Outlook, by Process, 2020-2033
- Canada Textiles Chemicals Outlook, by Product, 2020-2033
- Canada Textiles Chemicals Outlook, by Application, 2020-2033
- Canada Textiles Chemicals Outlook, by Process, 2020-2033
- BPS Analysis/Market Attractiveness Analysis
- North America Textiles Chemicals Outlook, by Product, Value (US$ Bn), 2020-2033
- Europe Textiles Chemicals Outlook, 2020 - 2033
- Europe Textiles Chemicals Outlook, by Product, Value (US$ Bn), 2020-2033
- Coating & Sizing Chemicals
- Colorants & Auxiliaries
- Finishing Agents
- Surfactants
- Desizing Agents
- Bleaching Agents
- Scouring Agents
- Yarn Lubricants
- Europe Textiles Chemicals Outlook, by Application, Value (US$ Bn), 2020-2033
- Apparel
- Home Furnishing
- Technical Textiles
- Other Applications
- Europe Textiles Chemicals Outlook, by Process, Value (US$ Bn), 2020-2033
- Pretreatment
- Coating
- Treatment Of Finished Products
- Europe Textiles Chemicals Outlook, by Country, Value (US$ Bn), 2020-2033
- Germany Textiles Chemicals Outlook, by Product, 2020-2033
- Germany Textiles Chemicals Outlook, by Application, 2020-2033
- Germany Textiles Chemicals Outlook, by Process, 2020-2033
- Italy Textiles Chemicals Outlook, by Product, 2020-2033
- Italy Textiles Chemicals Outlook, by Application, 2020-2033
- Italy Textiles Chemicals Outlook, by Process, 2020-2033
- France Textiles Chemicals Outlook, by Product, 2020-2033
- France Textiles Chemicals Outlook, by Application, 2020-2033
- France Textiles Chemicals Outlook, by Process, 2020-2033
- U.K. Textiles Chemicals Outlook, by Product, 2020-2033
- U.K. Textiles Chemicals Outlook, by Application, 2020-2033
- U.K. Textiles Chemicals Outlook, by Process, 2020-2033
- Spain Textiles Chemicals Outlook, by Product, 2020-2033
- Spain Textiles Chemicals Outlook, by Application, 2020-2033
- Spain Textiles Chemicals Outlook, by Process, 2020-2033
- Russia Textiles Chemicals Outlook, by Product, 2020-2033
- Russia Textiles Chemicals Outlook, by Application, 2020-2033
- Russia Textiles Chemicals Outlook, by Process, 2020-2033
- Rest of Europe Textiles Chemicals Outlook, by Product, 2020-2033
- Rest of Europe Textiles Chemicals Outlook, by Application, 2020-2033
- Rest of Europe Textiles Chemicals Outlook, by Process, 2020-2033
- BPS Analysis/Market Attractiveness Analysis
- Europe Textiles Chemicals Outlook, by Product, Value (US$ Bn), 2020-2033
- Asia Pacific Textiles Chemicals Outlook, 2020 - 2033
- Asia Pacific Textiles Chemicals Outlook, by Product, Value (US$ Bn), 2020-2033
- Coating & Sizing Chemicals
- Colorants & Auxiliaries
- Finishing Agents
- Surfactants
- Desizing Agents
- Bleaching Agents
- Scouring Agents
- Yarn Lubricants
- Asia Pacific Textiles Chemicals Outlook, by Application, Value (US$ Bn), 2020-2033
- Apparel
- Home Furnishing
- Technical Textiles
- Other Applications
- Asia Pacific Textiles Chemicals Outlook, by Process, Value (US$ Bn), 2020-2033
- Pretreatment
- Coating
- Treatment Of Finished Products
- Asia Pacific Textiles Chemicals Outlook, by Country, Value (US$ Bn), 2020-2033
- China Textiles Chemicals Outlook, by Product, 2020-2033
- China Textiles Chemicals Outlook, by Application, 2020-2033
- China Textiles Chemicals Outlook, by Process, 2020-2033
- Japan Textiles Chemicals Outlook, by Product, 2020-2033
- Japan Textiles Chemicals Outlook, by Application, 2020-2033
- Japan Textiles Chemicals Outlook, by Process, 2020-2033
- South Korea Textiles Chemicals Outlook, by Product, 2020-2033
- South Korea Textiles Chemicals Outlook, by Application, 2020-2033
- South Korea Textiles Chemicals Outlook, by Process, 2020-2033
- India Textiles Chemicals Outlook, by Product, 2020-2033
- India Textiles Chemicals Outlook, by Application, 2020-2033
- India Textiles Chemicals Outlook, by Process, 2020-2033
- Southeast Asia Textiles Chemicals Outlook, by Product, 2020-2033
- Southeast Asia Textiles Chemicals Outlook, by Application, 2020-2033
- Southeast Asia Textiles Chemicals Outlook, by Process, 2020-2033
- Rest of SAO Textiles Chemicals Outlook, by Product, 2020-2033
- Rest of SAO Textiles Chemicals Outlook, by Application, 2020-2033
- Rest of SAO Textiles Chemicals Outlook, by Process, 2020-2033
- BPS Analysis/Market Attractiveness Analysis
- Asia Pacific Textiles Chemicals Outlook, by Product, Value (US$ Bn), 2020-2033
- Latin America Textiles Chemicals Outlook, 2020 - 2033
- Latin America Textiles Chemicals Outlook, by Product, Value (US$ Bn), 2020-2033
- Coating & Sizing Chemicals
- Colorants & Auxiliaries
- Finishing Agents
- Surfactants
- Desizing Agents
- Bleaching Agents
- Scouring Agents
- Yarn Lubricants
- Latin America Textiles Chemicals Outlook, by Application, Value (US$ Bn), 2020-2033
- Apparel
- Home Furnishing
- Technical Textiles
- Other Applications
- Latin America Textiles Chemicals Outlook, by Process, Value (US$ Bn), 2020-2033
- Pretreatment
- Coating
- Treatment Of Finished Products
- Latin America Textiles Chemicals Outlook, by Country, Value (US$ Bn), 2020-2033
- Brazil Textiles Chemicals Outlook, by Product, 2020-2033
- Brazil Textiles Chemicals Outlook, by Application, 2020-2033
- Brazil Textiles Chemicals Outlook, by Process, 2020-2033
- Mexico Textiles Chemicals Outlook, by Product, 2020-2033
- Mexico Textiles Chemicals Outlook, by Application, 2020-2033
- Mexico Textiles Chemicals Outlook, by Process, 2020-2033
- Argentina Textiles Chemicals Outlook, by Product, 2020-2033
- Argentina Textiles Chemicals Outlook, by Application, 2020-2033
- Argentina Textiles Chemicals Outlook, by Process, 2020-2033
- Rest of LATAM Textiles Chemicals Outlook, by Product, 2020-2033
- Rest of LATAM Textiles Chemicals Outlook, by Application, 2020-2033
- Rest of LATAM Textiles Chemicals Outlook, by Process, 2020-2033
- BPS Analysis/Market Attractiveness Analysis
- Latin America Textiles Chemicals Outlook, by Product, Value (US$ Bn), 2020-2033
- Middle East & Africa Textiles Chemicals Outlook, 2020 - 2033
- Middle East & Africa Textiles Chemicals Outlook, by Product, Value (US$ Bn), 2020-2033
- Coating & Sizing Chemicals
- Colorants & Auxiliaries
- Finishing Agents
- Surfactants
- Desizing Agents
- Bleaching Agents
- Scouring Agents
- Yarn Lubricants
- Middle East & Africa Textiles Chemicals Outlook, by Application, Value (US$ Bn), 2020-2033
- Apparel
- Home Furnishing
- Technical Textiles
- Other Applications
- Middle East & Africa Textiles Chemicals Outlook, by Process, Value (US$ Bn), 2020-2033
- Pretreatment
- Coating
- Treatment Of Finished Products
- Middle East & Africa Textiles Chemicals Outlook, by Country, Value (US$ Bn), 2020-2033
- GCC Textiles Chemicals Outlook, by Product, 2020-2033
- GCC Textiles Chemicals Outlook, by Application, 2020-2033
- GCC Textiles Chemicals Outlook, by Process, 2020-2033
- South Africa Textiles Chemicals Outlook, by Product, 2020-2033
- South Africa Textiles Chemicals Outlook, by Application, 2020-2033
- South Africa Textiles Chemicals Outlook, by Process, 2020-2033
- Egypt Textiles Chemicals Outlook, by Product, 2020-2033
- Egypt Textiles Chemicals Outlook, by Application, 2020-2033
- Egypt Textiles Chemicals Outlook, by Process, 2020-2033
- Nigeria Textiles Chemicals Outlook, by Product, 2020-2033
- Nigeria Textiles Chemicals Outlook, by Application, 2020-2033
- Nigeria Textiles Chemicals Outlook, by Process, 2020-2033
- Rest of Middle East Textiles Chemicals Outlook, by Product, 2020-2033
- Rest of Middle East Textiles Chemicals Outlook, by Application, 2020-2033
- Rest of Middle East Textiles Chemicals Outlook, by Process, 2020-2033
- BPS Analysis/Market Attractiveness Analysis
- Middle East & Africa Textiles Chemicals Outlook, by Product, Value (US$ Bn), 2020-2033
- Competitive Landscape
- Company Vs Segment Heatmap
- Company Market Share Analysis, 2025
- Competitive Dashboard
- Company Profiles
- Archroma
- Company Overview
- Product Portfolio
- Financial Overview
- Business Strategies and Developments
- Dow
- BASF SE
- AB Enzymes
- Kemira Oyj
- Kiri Industries Ltd.
- BioTex Malaysia
- Ethox Chemicals, LLC
- Evonik Industries AG.
- Fibro Chem, LLC
- German Chemicals Ltd.
- Govi N.V.
- Huntsman International LLC
- OMNOVA Solutions Inc.
- Omya United Chemicals
- Archroma
- Appendix
- Research Methodology
- Report Assumptions
- Acronyms and Abbreviations
|
BASE YEAR |
HISTORICAL DATA |
FORECAST PERIOD |
UNITS |
|||
|
2025 |
|
2020 - 2025 |
2026 - 2033 |
Value: US$ Million |
||
|
REPORT FEATURES |
DETAILS |
|
By Product Coverage |
|
|
By Application Coverage |
|
|
Geographical Coverage |
|
|
Leading Companies |
|
|
Report Highlights |
Key Market Indicators, Macro-micro economic impact analysis, Technological Roadmap, Key Trends, Driver, Restraints, and Future Opportunities & Revenue Pockets, Porter’s 5 Forces Analysis, Historical Trend (2019-2024), Market Estimates and Forecast, Market Dynamics, Industry Trends, Competition Landscape, Category, Region, Country-wise Trends & Analysis, COVID-19 Impact Analysis (Demand and Supply Chain) |