



Transformer Oil Market
Transformer Oil Market Size, Share, Insights, Competitive Landscape, and Forecast 2026 to 2033
Transformer Oil Market Size and Trend Analysis
What Is Driving Transformer Oil Market Growth to 2033?
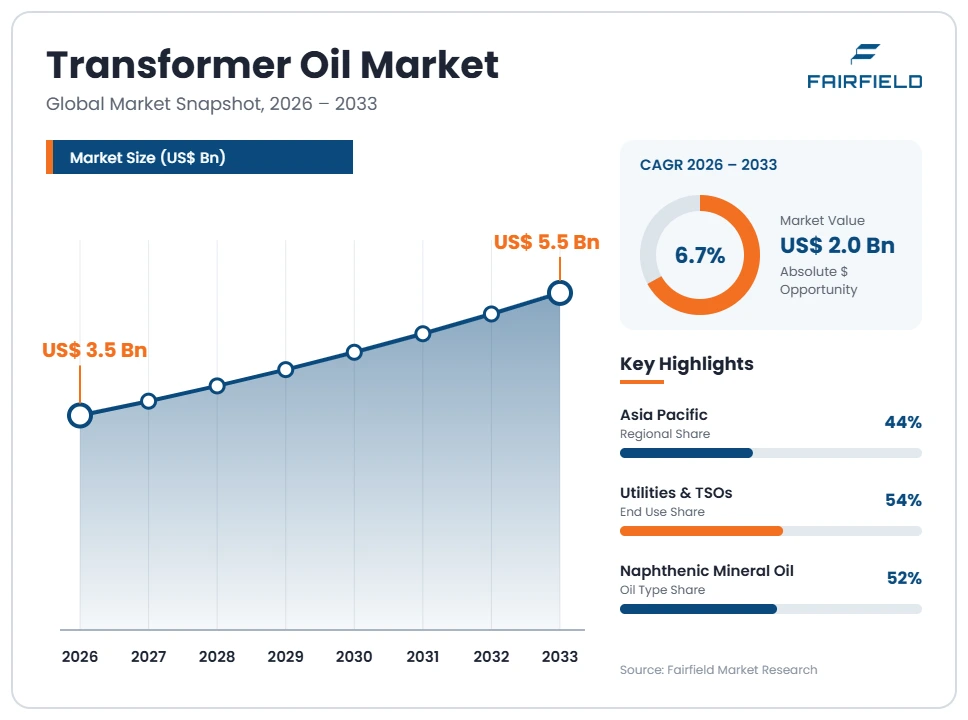
The global Transformer Oil market size is expected to be valued at US$ 3.5 billion in 2026 and projected to reach US$ 5.5 billion by 2033, growing at a CAGR of 6.7% between 2026 and 2033.
The market expanded at a 5.2% CAGR between 2020 and 2025, with growth accelerating in the final two years as grid investment recovered. Three forces explain the stronger outlook. Transformer manufacturing has entered a sustained capacity shortage, with order backlogs and lead times for large power units stretching well beyond historical norms, and every new unit requires a first fill. Renewable generation, data centre construction and electrification of transport are adding substation capacity at a faster rate than at any point in two decades. Maintenance demand is also rising, because a large installed base built in the 1970s and 1980s now needs top-ups, reclamation and full oil changes. Fire safety and biodegradability rules are steering part of that demand toward ester fluids.
Key Report Takeaways
- By Oil Type: Naphthenic Mineral Oil held 52% share in 2026, while Natural Esters are projected to expand at an 11.5% CAGR through 2033, driven by fire safety rules in urban substations and biodegradability requirements near water catchments.
- By Transformer Type: Power Transformers held 49% share in 2026, while Distribution Transformers are projected to expand at a 7.4% CAGR through 2033, driven by low-voltage network reinforcement for rooftop solar and electric vehicle charging loads.
- By End Use: Utilities and Transmission System Operators held 54% share in 2026, while Commercial Infrastructure and Data Centers are projected to expand at a 9.6% CAGR through 2033, driven by dedicated substation build-out for hyperscale computing campuses.
- By Oil Source: Virgin Oil held 78% share in 2026, while Reclaimed Oil is projected to expand at an 8.9% CAGR through 2033, driven by on-site regeneration contracts that extend asset life without new base oil purchases.
- By Geography: Asia Pacific held 44% share in 2026, while Middle East & Africa is projected to expand at an 8.3% CAGR through 2033, driven by Gulf grid interconnection projects and large-scale solar capacity additions.
Global Transformer Oil Market Trends and Insights
Drivers Impact Analysis
Two forces account for most of the forecast expansion in insulating liquid demand.
| Driver | Impact on CAGR Forecast | Geographic Relevance | Impact Timeline |
| Grid expansion and transformer production backlogs | High | Asia Pacific, North America, Europe | Long term ≥4 years |
| Ageing transformer fleets requiring oil top-up, testing and replacement | Medium | North America, Europe | Medium term 2–4 years |
Grid Build-Out and Transformer Backlogs Pull Insulating Oil Volumes Higher
Transformer production is the dominant demand channel for insulating fluids, and it is running at capacity. A single large power transformer takes tens of thousands of litres of first-fill oil, so each unit shipped converts directly into bulk liquid demand. Order books at major transformer plants extend years ahead, and lead times for high-voltage units have lengthened substantially since 2021. That backlog converts into a visible multi-year demand pipeline for oil suppliers.
The cause sits upstream in generation and load. Wind and solar capacity connects at points far from existing substations, requiring new step-up transformers and collector stations. Data centre campuses add tens or hundreds of megawatts at single sites. Electric vehicle charging and heat pump uptake raise distribution loads. Grid operators in India, China, the United States and the European Union have all committed to multi-year transmission investment plans that depend on transformer delivery.
Ageing Transformer Fleets Sustain Replacement and Reclamation Oil Demand
A large share of annual oil sales is maintenance rather than first fill, and that share is rising. Transformers installed during the build-out decades of the last century are now beyond their design life in many networks. These units need periodic top-ups, dielectric testing, filtration and, in many cases, a complete fluid change. Because replacing the transformer itself is slow and costly, utilities extend asset life through fluid management instead.
Condition monitoring practice drives the schedule. Dissolved gas analysis interpreted under IEC 60599 lets operators detect partial discharge, overheating and arcing from gas ratios in the oil. Acidity, moisture content and dielectric breakdown testing under ASTM D3487 and IEEE C57.106 acceptance criteria determine whether a charge is reconditioned, reclaimed or replaced. Wider sensor deployment has made these interventions routine rather than reactive, lifting recurring demand for transformer insulating fluids.
Restraints Impact Analysis
Two constraints limit how quickly this market can convert grid investment into revenue.
| Restraint | Impact on CAGR Forecast | Geographic Relevance | Impact Timeline |
| Naphthenic base oil feedstock concentration and refinery capacity limits | High | Global | Medium term 2–4 years |
| Qualification barriers and cost premium for ester-based insulating fluids | Medium | Europe, North America | Long term ≥4 years |
Narrow Naphthenic Base Oil Supply Constrains Transformer Oil Availability
Feedstock concentration is the most material supply risk in this market. Transformer-grade mineral oil requires naphthenic crude, which is produced from a limited number of crude slates and processed at a small group of specialist refineries worldwide. Unlike paraffinic base oils, naphthenic capacity cannot be ramped quickly in response to demand. When a single plant takes an unplanned outage, regional availability tightens within weeks and prices move sharply.
The technical cause lies in the specification itself. Oil meeting IEC 60296 must combine low pour point, high oxidation stability, controlled aromatic content and consistent dielectric strength, which narrows the acceptable feedstock range considerably. Severe hydrotreating adds processing cost and limits throughput. Freight also matters, since bulk liquid shipment across long distances carries meaningful cost and exposes buyers to tanker availability. Transformer manufacturers routinely hold inventory they would rather not finance.
Ester Qualification Costs and Price Premiums Slow Fluid Substitution
Ester adoption moves more slowly than its safety advantages suggest, because switching imposes engineering cost on the buyer. Natural and synthetic esters carry a substantial price premium over naphthenic mineral oil, often several times the cost per litre for synthetic grades. Esters also have higher viscosity, which affects cooling performance and can require a redesigned tank, radiator and pump arrangement rather than a simple refill of an existing unit.
Qualification is the deeper barrier. Transformer designs must be re-rated and type tested with the new fluid, and utilities require documented compatibility with cellulose insulation, gaskets and bushings. Acceptance and maintenance practice for these fluids follows IEC 61099, IEC 62770 and IEEE C57.147, and diagnostic baselines differ from mineral oil, so dissolved gas interpretation limits must be relearned. Laboratories, technicians and spare fluid stocks all need updating before a utility commits.
Market Opportunities
Two revenue pools sit outside conventional first-fill mineral oil supply.
PCB Elimination Mandates Open a Fluid Replacement and Disposal Revenue Pool
Legally mandated removal of PCB-contaminated equipment creates a defined, time-bound service market. Transformers and oil-filled equipment containing polychlorinated biphenyls remain in service across industrial sites and older distribution networks, particularly in developing economies. Each unit must be identified, tested, drained, decontaminated or destroyed, and refilled or replaced. That sequence generates demand for testing services, retrofill fluid, solvent decontamination and certified destruction capacity.
Obligations under the Stockholm Convention on Persistent Organic Pollutants set the timetable, requiring parties to end use of PCB-containing equipment by 2025 and to achieve environmentally sound management of PCB liquids by 2028. Within the European Union, Regulation (EU) 2019/1021 carries the same obligations into binding law. Utilities, heavy industry and national environment agencies are the buyers, and specialist fluid handling contractors are best positioned to capture the work.
Fire-Safe Ester Retrofill for Urban and Data Centre Substations Creates Premium Demand
Indoor and densely built substations create a premium niche where fire performance outweighs fluid cost. Natural and synthetic esters have fire points above 300°C, which allows classification as less-flammable liquids and permits reduced fire separation distances or lighter suppression systems. For a developer building inside a city block or beneath a commercial tower, that saving in floor area and fire engineering can exceed the fluid premium several times over.
Data centre operators, urban network operators and rail electrification authorities drive this demand. Hyperscale campuses site transformers close to load and operate under strict insurer requirements, which favours less-flammable fluids. Biodegradability adds a second argument where units sit near water catchments or protected ground. Published fluid specifications under IEC 62770 for natural esters and IEC 61099 for synthetic esters give specifiers a defensible procurement basis for ester-filled transformers.
Segment Analysis
- By Oil Type: Naphthenic Mineral Oil Holds the Base While Natural Esters Advance Fastest
Naphthenic Mineral Oil captured 52% of revenue in 2026, reflecting a century of design experience, broad refinery qualification and the lowest cost per litre among qualified fluids. Its low pour point and good low-temperature viscosity suit cold-climate networks, and acceptance criteria under IEC 60296 and ASTM D3487 are universally recognised. Paraffinic Mineral Oil holds a meaningful secondary share, concentrated in regions where naphthenic crude access is limited. Natural Esters are the fastest-growing fluid class at an 11.5% CAGR through 2033, expanding from a small base. Growth follows fire safety classification, biodegradability in soil and water, and higher moisture tolerance that can extend cellulose insulation life. Synthetic Esters serve traction, offshore and high-temperature applications where oxidation stability matters most. Silicone and Other Fluids remain a niche. The practical implication is that mineral oil will dominate volume for the forecast period while esters capture a disproportionate share of value growth.
- By Transformer Type: Power Transformers Lead Volumes as Distribution Units Grow Quicker
Power Transformers accounted for 49% of fluid demand in 2026, the largest single application. The reason is physical scale, since one large transmission unit holds more oil than hundreds of pole-mounted distribution transformers combined. Transmission build-out for renewable connection and interregional interconnection keeps this segment central. Distribution Transformers are expanding fastest at a 7.4% CAGR to 2033. Low-voltage networks are being reinforced to carry rooftop solar export, electric vehicle charging and heat pump load, and unit counts are rising quickly even though each unit holds modest volumes. Instrument Transformers and Switchgear and Other Oil-Filled Equipment contribute smaller shares tied to substation construction. Ecodesign efficiency rules in the European Union are also pushing replacement of older distribution units ahead of failure. For suppliers this means two distinct logistics models, with bulk tanker delivery serving transmission projects and drummed or intermediate bulk container supply serving distribution fleets.
- By End Use: Utilities Anchor Purchasing While Data Centre Substations Scale Fastest
Utilities and Transmission System Operators represented 54% of purchases in 2026, buying both first-fill volumes through transformer orders and maintenance volumes through framework service contracts. Their technical specifications set the de facto standard that other buyers adopt. Industrial and Manufacturing users, including steel, mining, chemicals and cement operations, form the second block, often maintaining private substations with dedicated fluid stocks. Renewable Power Generation adds steady demand through step-up and collector transformers at wind and solar sites. Commercial Infrastructure and Data Centers is the fastest-growing end use at a 9.6% CAGR through 2033. Hyperscale and colocation campuses now commission dedicated substations with multiple large transformers, and insurer-driven fire requirements frequently specify less-flammable ester fluids. The commercial consequence is that suppliers with ester capability and rapid delivery can win high-value contracts outside traditional utility tender cycles.
- By Oil Source: Virgin Oil Dominates Supply While Reclaimed Volumes Rise Faster
Virgin Oil held 78% of the market in 2026 and will remain dominant, because new transformers require fluid meeting unused oil specifications with documented traceability. Manufacturers will not accept recycled material for first fill, and warranty terms reinforce that position. Reclaimed Oil is the fastest-growing source at an 8.9% CAGR to 2033. Mobile regeneration units treat oil on site using fuller’s earth or similar adsorbents, removing acids, sludge and oxidation by-products so the charge returns to acceptable dielectric and acidity limits without draining the transformer from service for long. Re-refined Oil, processed at dedicated plants from collected waste charges, serves cost-sensitive buyers and markets with strong waste regulation. The business implication is that service revenue is becoming a defensive strategy for oil suppliers, since every reclaimed litre displaces a litre of new product they would otherwise sell.
Geography Analysis
- North America Rebuilds Ageing Grid Assets and Lifts Replacement Fluid Demand
North America held 20% of global revenue in 2026, with the United States supplying most of that figure and Canada and Mexico adding the balance. Replacement rather than new build dominates. A large share of installed transmission and distribution transformers has been in service for more than four decades, which sustains heavy demand for top-ups, filtration, reclamation and full fluid changes. Interconnection queues for wind, solar and battery projects have created a long pipeline of step-up transformer orders, and domestic transformer manufacturing capacity has become a recognised bottleneck. Data centre construction in Virginia, Texas and Arizona adds dedicated substation load at an unusual pace. Condition monitoring practice is advanced here, with dissolved gas analysis and acceptance testing under IEEE C57.106 guiding maintenance intervals and fluid purchasing decisions.
- Europe Ties Transformer Fluid Demand to Ecodesign and Grid Replacement Rules
Europe held 21% of global revenue in 2026, with Germany, France, Italy, Spain and the United Kingdom leading demand. Two regulatory forces shape purchasing. The Ecodesign Regulation (EU) 2019/1783 sets minimum efficiency requirements for power and distribution transformers, and its Tier 2 levels have accelerated replacement of older units that cannot be economically upgraded. Regulation (EU) 2019/1021 on persistent organic pollutants requires elimination of PCB-contaminated equipment, which generates decontamination and retrofill work. Offshore wind connection in the North Sea adds large transformer orders. The region also shows the highest ester penetration globally, driven by fire regulations for indoor substations and by environmental rules near water bodies. The constraint is manufacturing capacity, since transformer plants in the region are fully booked well into the forecast period.
- Which Region Is Leading the Transformer Oil Market?
Asia Pacific leads with 44% of global revenue in 2026, a position built on transformer manufacturing scale and the fastest absolute growth in installed grid capacity. China and India account for most of that volume, with Japan, South Korea and Indonesia adding substantial demand. Three causes explain the lead. The region hosts the largest concentration of transformer production capacity, and every unit built takes a first fill locally. Rural electrification and distribution network expansion in India and Indonesia add large numbers of smaller units each year. Solar and wind capacity additions in China require extensive collector and step-up transformer infrastructure. Domestic naphthenic refining and blending capacity keeps costs competitive, though specialist grades are still imported. Ester adoption remains early here, concentrated in metro rail and urban substation projects.
- Latin America Expands Transformer Fluid Demand Through Renewable Grid Connection
Latin America represented 7% of revenue in 2026, with Brazil, Mexico, Chile and Colombia supplying most demand. Grid connection of wind and solar capacity is the main growth channel, particularly in north-eastern Brazil and northern Chile, where generation sites sit far from load centres and require long transmission links. Local transformer manufacturing in Brazil and Mexico supports regional first-fill demand. Barriers are real. Currency volatility raises the cost of imported specialist fluids, transmission project approvals move slowly, and utility capital budgets are exposed to regulated tariff decisions. PCB-containing equipment remains in service at older industrial sites, creating a compliance backlog. The clearest regional change is growth in private transmission concessions, which operate on firmer timetables than state utility programmes and specify international fluid standards.
- Which Region Is Growing Fastest in the Transformer Oil Market?
Middle East & Africa is growing fastest, at an 8.3% CAGR between 2026 and 2033, from 8% share in 2026. Saudi Arabia, the United Arab Emirates, Egypt and South Africa drive the expansion. The mechanism is new build rather than replacement. Gulf states are constructing utility-scale solar capacity, national grid reinforcements and cross-border interconnection, each requiring substantial new transformer capacity. Industrial cities, desalination plants and new urban developments add dedicated substations. High ambient temperatures raise thermal stress on insulating fluid, which shortens service intervals and lifts reclamation and replacement volumes per installed unit. Across the African continent, electrification programmes and mining power infrastructure add demand, though grid losses and financing constraints temper the pace. Local blending capacity is limited, so most specialist fluid arrives by import.
Competitive Landscape
The market is moderately concentrated at the base oil level and fragmented downstream. A small group of refiners controls most global naphthenic base oil capacity, which gives them structural influence over availability and pricing. Below that layer sit dozens of regional blenders, drummers and distributors that package, test and deliver finished product under their own brands. Ester fluids follow a different pattern, with agricultural processors and specialty chemical companies supplying base stock into a narrower set of formulators. Vertical integration from crude access through finished fluid is the clearest source of durable advantage.
Competition turns on supply reliability first. Because a transformer cannot be commissioned without oil, manufacturers and utilities pay for guaranteed delivery windows more readily than they chase the lowest price. Specification breadth is the second factor, covering grades qualified under IEC 60296, ASTM D3487 and ASTM D6871 across different climate classes. Technical service is the third, including oil analysis laboratories, dissolved gas interpretation support and field engineering. New competitive pressure comes from ester suppliers and from independent reclamation specialists, who sell against new fluid purchases entirely.
Strategic activity concentrates on securing feedstock and extending into services. Base oil refiners such as Nynas AB and Ergon, Inc. compete on naphthenic capability and global logistics, while Shell plc and PetroChina Company Limited bring integrated refining and distribution reach. Cargill, Incorporated anchors the natural ester side through agricultural feedstock access. Regional blenders across India and China compete aggressively on delivered cost in local tenders.
Strategic direction points toward three themes: ester portfolio development to meet fire and environmental specifications, investment in reclamation and regeneration service networks, and closer contractual alignment with transformer manufacturers whose production schedules now govern bulk demand timing.
Recent Industry Developments
- July 2019: Regulation (EU) 2019/1021 on persistent organic pollutants became applicable across the European Union – it carries binding PCB identification, removal and disposal obligations that drive retrofill and decontamination demand for oil-filled equipment.
- 2020: The International Electrotechnical Commission issued the current edition of IEC 60296 covering unused mineral insulating oils for electrical equipment – it remains the primary acceptance specification against which transformer manufacturers and utilities qualify new fluid.
- July 2021: Tier 2 ecodesign requirements for power and distribution transformers became applicable in the European Union under Regulation (EU) 2019/1783 – the tighter loss limits accelerated replacement of older units and pulled forward first-fill fluid demand.
- 2025: The Stockholm Convention on Persistent Organic Pollutants deadline for ending the use of PCB-containing equipment took effect for parties to the treaty – it converts a long-standing environmental obligation into near-term fluid replacement and certified disposal work.
Companies Covered in the Report
- Nynas AB
- Shell plc
- Ergon, Inc.
- Cargill, Incorporated
- PetroChina Company Limited
- China Petroleum & Chemical Corporation
- Apar Industries Limited
- Savita Oil Technologies Limited
- Calumet, Inc.
- M&I Materials Limited
- Gandhar Oil Refinery (India) Limited
- Hydrodec Group plc
Transformer Oil Market Report Scope
| Metric | Value |
| Study Period | 2020–2033 |
| Market Size 2026 | US$ 3.5 Billion |
| Market Size 2033 | US$ 5.5 Billion |
| CAGR 2026–2033 | 6.7% |
| Absolute Dollar Opportunity | US$ 2.0 Billion |
| Largest Market | Asia Pacific, 44% share in 2026 |
| Fastest-Growing Market | Middle East & Africa, 8.3% CAGR |
| Market Concentration | Medium |
| Major Players | Nynas AB, Shell plc, Ergon, Inc., Cargill, Incorporated, PetroChina Company Limited |
Transformer Oil Market Segmentation
Oil Type
- Naphthenic Mineral Oil
- Paraffinic Mineral Oil
- Natural Esters
- Synthetic Esters
- Silicone and Other Fluids
Transformer Type
- Power Transformers
- Distribution Transformers
- Instrument Transformers
- Switchgear and Other Oil-Filled Equipment
End Use
- Utilities and Transmission System Operators
- Industrial and Manufacturing
- Renewable Power Generation
- Commercial Infrastructure and Data Centers
Oil Source
- Virgin Oil
- Reclaimed Oil
- Re-refined Oil
Regions
- North America
- Europe
- Asia Pacific
- Latin America
- Middle East & Africa
- Executive Summary
- Global Transformer Oil Market Snapshot
- Market Size and Trend Analysis 2020–2033
- Historical Growth 2020–2025
- Base Year 2025
- Forecast Outlook 2026–2033
- Key Report Takeaways
- Market Overview
- Market Definition and Report Scope
- Market Dynamics
- Drivers
- Grid Build-Out and Transformer Backlogs Pull Insulating Oil Volumes Higher
- Ageing Transformer Fleets Sustain Replacement and Reclamation Oil Demand
- Restraints
- Narrow Naphthenic Base Oil Supply Constrains Transformer Oil Availability
- Ester Qualification Costs and Price Premiums Slow Fluid Substitution
- Market Opportunities
- PCB Elimination Mandates Open a Fluid Replacement and Disposal Revenue Pool
- Fire-Safe Ester Retrofill for Urban and Data Centre Substations Creates Premium Demand
- Drivers
- Segment Analysis
- By Oil Type: Naphthenic Mineral Oil Holds the Base While Natural Esters Advance Fastest
- By Transformer Type: Power Transformers Lead Volumes as Distribution Units Grow Quicker
- By End Use: Utilities Anchor Purchasing While Data Centre Substations Scale Fastest
- By Oil Source: Virgin Oil Dominates Supply While Reclaimed Volumes Rise Faster
- Global Transformer Oil Market Outlook, 2020–2033
- Global Transformer Oil Market Outlook, by Oil Type, Value (US$ Billion), 2020–2033
- Naphthenic Mineral Oil
- Paraffinic Mineral Oil
- Natural Esters
- Synthetic Esters
- Silicone and Other Fluids
- Global Transformer Oil Market Outlook, by Transformer Type, Value (US$ Billion), 2020–2033
- Power Transformers
- Distribution Transformers
- Instrument Transformers
- Switchgear and Other Oil-Filled Equipment
- Global Transformer Oil Market Outlook, by End Use, Value (US$ Billion), 2020–2033
- Utilities and Transmission System Operators
- Industrial and Manufacturing
- Renewable Power Generation
- Commercial Infrastructure and Data Centers
- Global Transformer Oil Market Outlook, by Oil Source, Value (US$ Billion), 2020–2033
- Virgin Oil
- Reclaimed Oil
- Re-refined Oil
- Global Transformer Oil Market Outlook, by Region, Value (US$ Billion), 2020–2033
- North America
- Europe
- Asia Pacific
- Latin America
- Middle East & Africa
- Global Transformer Oil Market Outlook, by Oil Type, Value (US$ Billion), 2020–2033
- North America Transformer Oil Market Outlook, 2020–2033
- North America Rebuilds Ageing Grid Assets and Lifts Replacement Fluid Demand
- North America Transformer Oil Market Outlook, by Oil Type, Value (US$ Billion), 2020–2033
- Naphthenic Mineral Oil
- Paraffinic Mineral Oil
- Natural Esters
- Synthetic Esters
- Silicone and Other Fluids
- North America Transformer Oil Market Outlook, by Transformer Type, Value (US$ Billion), 2020–2033
- Power Transformers
- Distribution Transformers
- Instrument Transformers
- Switchgear and Other Oil-Filled Equipment
- North America Transformer Oil Market Outlook, by End Use, Value (US$ Billion), 2020–2033
- Utilities and Transmission System Operators
- Industrial and Manufacturing
- Renewable Power Generation
- Commercial Infrastructure and Data Centers
- North America Transformer Oil Market Outlook, by Oil Source, Value (US$ Billion), 2020–2033
- Virgin Oil
- Reclaimed Oil
- Re-refined Oil
- North America Transformer Oil Market Outlook, by Country, Value (US$ Billion), 2020–2033
- United States Transformer Oil Market Outlook, by Oil Type, 2020–2033
- United States Transformer Oil Market Outlook, by Transformer Type, 2020–2033
- United States Transformer Oil Market Outlook, by End Use, 2020–2033
- United States Transformer Oil Market Outlook, by Oil Source, 2020–2033
- Canada Transformer Oil Market Outlook, by Oil Type, 2020–2033
- Canada Transformer Oil Market Outlook, by Transformer Type, 2020–2033
- Canada Transformer Oil Market Outlook, by End Use, 2020–2033
- Canada Transformer Oil Market Outlook, by Oil Source, 2020–2033
- Mexico Transformer Oil Market Outlook, by Oil Type, 2020–2033
- Mexico Transformer Oil Market Outlook, by Transformer Type, 2020–2033
- Mexico Transformer Oil Market Outlook, by End Use, 2020–2033
- Mexico Transformer Oil Market Outlook, by Oil Source, 2020–2033
- Europe Transformer Oil Market Outlook, 2020–2033
- Europe Ties Transformer Fluid Demand to Ecodesign and Grid Replacement Rules
- Europe Transformer Oil Market Outlook, by Oil Type, Value (US$ Billion), 2020–2033
- Naphthenic Mineral Oil
- Paraffinic Mineral Oil
- Natural Esters
- Synthetic Esters
- Silicone and Other Fluids
- Europe Transformer Oil Market Outlook, by Transformer Type, Value (US$ Billion), 2020–2033
- Power Transformers
- Distribution Transformers
- Instrument Transformers
- Switchgear and Other Oil-Filled Equipment
- Europe Transformer Oil Market Outlook, by End Use, Value (US$ Billion), 2020–2033
- Utilities and Transmission System Operators
- Industrial and Manufacturing
- Renewable Power Generation
- Commercial Infrastructure and Data Centers
- Europe Transformer Oil Market Outlook, by Oil Source, Value (US$ Billion), 2020–2033
- Virgin Oil
- Reclaimed Oil
- Re-refined Oil
- Europe Transformer Oil Market Outlook, by Country, Value (US$ Billion), 2020–2033
- Germany Transformer Oil Market Outlook, by Oil Type, 2020–2033
- Germany Transformer Oil Market Outlook, by Transformer Type, 2020–2033
- Germany Transformer Oil Market Outlook, by End Use, 2020–2033
- Germany Transformer Oil Market Outlook, by Oil Source, 2020–2033
- France Transformer Oil Market Outlook, by Oil Type, 2020–2033
- France Transformer Oil Market Outlook, by Transformer Type, 2020–2033
- France Transformer Oil Market Outlook, by End Use, 2020–2033
- France Transformer Oil Market Outlook, by Oil Source, 2020–2033
- Italy Transformer Oil Market Outlook, by Oil Type, 2020–2033
- Italy Transformer Oil Market Outlook, by Transformer Type, 2020–2033
- Italy Transformer Oil Market Outlook, by End Use, 2020–2033
- Italy Transformer Oil Market Outlook, by Oil Source, 2020–2033
- Spain Transformer Oil Market Outlook, by Oil Type, 2020–2033
- Spain Transformer Oil Market Outlook, by Transformer Type, 2020–2033
- Spain Transformer Oil Market Outlook, by End Use, 2020–2033
- Spain Transformer Oil Market Outlook, by Oil Source, 2020–2033
- United Kingdom Transformer Oil Market Outlook, by Oil Type, 2020–2033
- United Kingdom Transformer Oil Market Outlook, by Transformer Type, 2020–2033
- United Kingdom Transformer Oil Market Outlook, by End Use, 2020–2033
- United Kingdom Transformer Oil Market Outlook, by Oil Source, 2020–2033
- Asia Pacific Transformer Oil Market Outlook, 2020–2033
- Regional Market Leadership
- Asia Pacific Transformer Oil Market Outlook, by Oil Type, Value (US$ Billion), 2020–2033
- Naphthenic Mineral Oil
- Paraffinic Mineral Oil
- Natural Esters
- Synthetic Esters
- Silicone and Other Fluids
- Asia Pacific Transformer Oil Market Outlook, by Transformer Type, Value (US$ Billion), 2020–2033
- Power Transformers
- Distribution Transformers
- Instrument Transformers
- Switchgear and Other Oil-Filled Equipment
- Asia Pacific Transformer Oil Market Outlook, by End Use, Value (US$ Billion), 2020–2033
- Utilities and Transmission System Operators
- Industrial and Manufacturing
- Renewable Power Generation
- Commercial Infrastructure and Data Centers
- Asia Pacific Transformer Oil Market Outlook, by Oil Source, Value (US$ Billion), 2020–2033
- Virgin Oil
- Reclaimed Oil
- Re-refined Oil
- Asia Pacific Transformer Oil Market Outlook, by Country, Value (US$ Billion), 2020–2033
- China Transformer Oil Market Outlook, by Oil Type, 2020–2033
- China Transformer Oil Market Outlook, by Transformer Type, 2020–2033
- China Transformer Oil Market Outlook, by End Use, 2020–2033
- China Transformer Oil Market Outlook, by Oil Source, 2020–2033
- India Transformer Oil Market Outlook, by Oil Type, 2020–2033
- India Transformer Oil Market Outlook, by Transformer Type, 2020–2033
- India Transformer Oil Market Outlook, by End Use, 2020–2033
- India Transformer Oil Market Outlook, by Oil Source, 2020–2033
- Japan Transformer Oil Market Outlook, by Oil Type, 2020–2033
- Japan Transformer Oil Market Outlook, by Transformer Type, 2020–2033
- Japan Transformer Oil Market Outlook, by End Use, 2020–2033
- Japan Transformer Oil Market Outlook, by Oil Source, 2020–2033
- South Korea Transformer Oil Market Outlook, by Oil Type, 2020–2033
- South Korea Transformer Oil Market Outlook, by Transformer Type, 2020–2033
- South Korea Transformer Oil Market Outlook, by End Use, 2020–2033
- South Korea Transformer Oil Market Outlook, by Oil Source, 2020–2033
- Indonesia Transformer Oil Market Outlook, by Oil Type, 2020–2033
- Indonesia Transformer Oil Market Outlook, by Transformer Type, 2020–2033
- Indonesia Transformer Oil Market Outlook, by End Use, 2020–2033
- Indonesia Transformer Oil Market Outlook, by Oil Source, 2020–2033
- Latin America Transformer Oil Market Outlook, 2020–2033
- Latin America Expands Transformer Fluid Demand Through Renewable Grid Connection
- Latin America Transformer Oil Market Outlook, by Oil Type, Value (US$ Billion), 2020–2033
- Naphthenic Mineral Oil
- Paraffinic Mineral Oil
- Natural Esters
- Synthetic Esters
- Silicone and Other Fluids
- Latin America Transformer Oil Market Outlook, by Transformer Type, Value (US$ Billion), 2020–2033
- Power Transformers
- Distribution Transformers
- Instrument Transformers
- Switchgear and Other Oil-Filled Equipment
- Latin America Transformer Oil Market Outlook, by End Use, Value (US$ Billion), 2020–2033
- Utilities and Transmission System Operators
- Industrial and Manufacturing
- Renewable Power Generation
- Commercial Infrastructure and Data Centers
- Latin America Transformer Oil Market Outlook, by Oil Source, Value (US$ Billion), 2020–2033
- Virgin Oil
- Reclaimed Oil
- Re-refined Oil
- Latin America Transformer Oil Market Outlook, by Country, Value (US$ Billion), 2020–2033
- Brazil Transformer Oil Market Outlook, by Oil Type, 2020–2033
- Brazil Transformer Oil Market Outlook, by Transformer Type, 2020–2033
- Brazil Transformer Oil Market Outlook, by End Use, 2020–2033
- Brazil Transformer Oil Market Outlook, by Oil Source, 2020–2033
- Mexico Transformer Oil Market Outlook, by Oil Type, 2020–2033
- Mexico Transformer Oil Market Outlook, by Transformer Type, 2020–2033
- Mexico Transformer Oil Market Outlook, by End Use, 2020–2033
- Mexico Transformer Oil Market Outlook, by Oil Source, 2020–2033
- Chile Transformer Oil Market Outlook, by Oil Type, 2020–2033
- Chile Transformer Oil Market Outlook, by Transformer Type, 2020–2033
- Chile Transformer Oil Market Outlook, by End Use, 2020–2033
- Chile Transformer Oil Market Outlook, by Oil Source, 2020–2033
- Colombia Transformer Oil Market Outlook, by Oil Type, 2020–2033
- Colombia Transformer Oil Market Outlook, by Transformer Type, 2020–2033
- Colombia Transformer Oil Market Outlook, by End Use, 2020–2033
- Colombia Transformer Oil Market Outlook, by Oil Source, 2020–2033
- Middle East & Africa Transformer Oil Market Outlook, 2020–2033
- Regional Growth Outlook
- Middle East & Africa Transformer Oil Market Outlook, by Oil Type, Value (US$ Billion), 2020–2033
- Naphthenic Mineral Oil
- Paraffinic Mineral Oil
- Natural Esters
- Synthetic Esters
- Silicone and Other Fluids
- Middle East & Africa Transformer Oil Market Outlook, by Transformer Type, Value (US$ Billion), 2020–2033
- Power Transformers
- Distribution Transformers
- Instrument Transformers
- Switchgear and Other Oil-Filled Equipment
- Middle East & Africa Transformer Oil Market Outlook, by End Use, Value (US$ Billion), 2020–2033
- Utilities and Transmission System Operators
- Industrial and Manufacturing
- Renewable Power Generation
- Commercial Infrastructure and Data Centers
- Middle East & Africa Transformer Oil Market Outlook, by Oil Source, Value (US$ Billion), 2020–2033
- Virgin Oil
- Reclaimed Oil
- Re-refined Oil
- Middle East & Africa Transformer Oil Market Outlook, by Country, Value (US$ Billion), 2020–2033
- Saudi Arabia Transformer Oil Market Outlook, by Oil Type, 2020–2033
- Saudi Arabia Transformer Oil Market Outlook, by Transformer Type, 2020–2033
- Saudi Arabia Transformer Oil Market Outlook, by End Use, 2020–2033
- Saudi Arabia Transformer Oil Market Outlook, by Oil Source, 2020–2033
- United Arab Emirates Transformer Oil Market Outlook, by Oil Type, 2020–2033
- United Arab Emirates Transformer Oil Market Outlook, by Transformer Type, 2020–2033
- United Arab Emirates Transformer Oil Market Outlook, by End Use, 2020–2033
- United Arab Emirates Transformer Oil Market Outlook, by Oil Source, 2020–2033
- Egypt Transformer Oil Market Outlook, by Oil Type, 2020–2033
- Egypt Transformer Oil Market Outlook, by Transformer Type, 2020–2033
- Egypt Transformer Oil Market Outlook, by End Use, 2020–2033
- Egypt Transformer Oil Market Outlook, by Oil Source, 2020–2033
- South Africa Transformer Oil Market Outlook, by Oil Type, 2020–2033
- South Africa Transformer Oil Market Outlook, by Transformer Type, 2020–2033
- South Africa Transformer Oil Market Outlook, by End Use, 2020–2033
- South Africa Transformer Oil Market Outlook, by Oil Source, 2020–2033
- Competitive Landscape
- Market Concentration and Supplier Participation
- Competitive Factors and Strategic Direction
- Recent Industry Developments
- EU Persistent Organic Pollutants Regulation July 2019
- IEC 60296 Mineral Insulating Oil Standard 2020
- EU Tier 2 Transformer Ecodesign Requirements July 2021
- Stockholm Convention PCB Equipment Use Deadline 2025
- Company Profiles
- Nynas AB
- Shell plc
- Ergon, Inc.
- Cargill, Incorporated
- PetroChina Company Limited
- China Petroleum & Chemical Corporation
- Apar Industries Limited
- Savita Oil Technologies Limited
- Calumet, Inc.
- M&I Materials Limited
- Gandhar Oil Refinery (India) Limited
- Hydrodec Group plc
- Appendix
- Research Methodology
- Report Assumptions
- Acronyms and Abbreviations
Oil Type
- Naphthenic Mineral Oil
- Paraffinic Mineral Oil
- Natural Esters
- Synthetic Esters
- Silicone and Other Fluids
Transformer Type
- Power Transformers
- Distribution Transformers
- Instrument Transformers
- Switchgear and Other Oil-Filled Equipment
End Use
- Utilities and Transmission System Operators
- Industrial and Manufacturing
- Renewable Power Generation
- Commercial Infrastructure and Data Centers
Oil Source
- Virgin Oil
- Reclaimed Oil
- Re-refined Oil
Regions
- North America
- Europe
- Asia Pacific
- Latin America
- Middle East & Africa
Our Research Methodology
Considering the volatility of business today, traditional approaches to strategizing a game plan can be unfruitful if not detrimental. True ambiguity is no way to determine a forecast. A myriad of predetermined factors must be accounted for such as the degree of risk involved, the magnitude of circumstances, as well as conditions or consequences that are not known or unpredictable. To circumvent binary views that cast uncertainty, the application of market research intelligence to strategically posture, move, and enable actionable outcomes is necessary.
View Methodology
Quality Assured
Rigorous Validation Process

Confidentiality Assured
End-to-end Data Security

Custom Research Services
Tailored To Your Objectives
FAQs
The market is valued at US$ 3.5 billion in 2026, covering mineral oils, esters, silicone fluids and reclaimed charges used in power and distribution transformers.
Revenue is projected to reach US$ 5.5 billion by 2033, a 6.7% CAGR and an absolute dollar opportunity of US$ 2.0 billion over the forecast period.
Naphthenic Mineral Oil leads with 52% share in 2026, supported by low cost per litre, excellent low-temperature performance and universal qualification in transformer designs.
Natural Esters grow fastest at an 11.5% CAGR, as fire safety classification and biodegradability requirements push urban and environmentally sensitive substations toward less-flammable fluids.
Asia Pacific leads with 44% share in 2026, driven by concentrated transformer manufacturing capacity and the largest annual additions of grid and renewable generation infrastructure.
Related Reports
Synchronous Condenser Market Size, Share, Insights, Competitive Landscape, and Forecast 2026 to 2033
The global synchronous condenser market is valued at US$1.20 billion in 2026, reaching US$1.50 billion by 2033, growing at a 3.2% CAGR
Water and Wastewater Treatment Market Size, Share, Insights, Competitive Landscape, and Forecast 2026 to 2033
Water and wastewater treatment market to reach US$ 508.0 billion by 2033 from US$ 345.0 billion in 2026 at a 5.7% CAGR. Explore trends, segments and regions.
Vehicle-to-Grid Technology Market Size, Share, Insights, Competitive Landscape, and Forecast 2026 to 2033
Explore the vehicle-to-grid technology market, forecast to reach US$6.9 billion by 2033 at 28.4% CAGR, with component, application and regional insights.
Offshore Oil and Gas Equipment Market Size, Share, Insights, Competitive Landscape, and Forecast 2026 to 2033
The offshore oil and gas equipment market is projected to grow from US$94.0 billion in 2026 to US$138.0 billion by 2033, at a 5.6% CAGR. Explore trends.
Floating Storage and Regasification Unit Market Size, Share, Insights, Competitive Landscape, and Forecast 2026 to 2033
Floating storage and regasification unit market to grow from US$8.96 Bn in 2026 to US$13.92 Bn by 2033 at 6.5% CAGR. Explore types, mooring and regions.
Floating Solar Market Size, Share, Insights, Competitive Landscape, and Forecast 2026 to 2033
Floating solar market to grow from US$1.60 Bn in 2026 to US$4.02 Bn by 2033 at 14.1% CAGR. Explore capacities, products, locations and regional trends.