



Chemoinformatics Market
Chemoinformatics Market Size, Share, Insights, Competitive Landscape, and Forecast 2026 to 2033
How Fast Is the Chemoinformatics Market Growing?
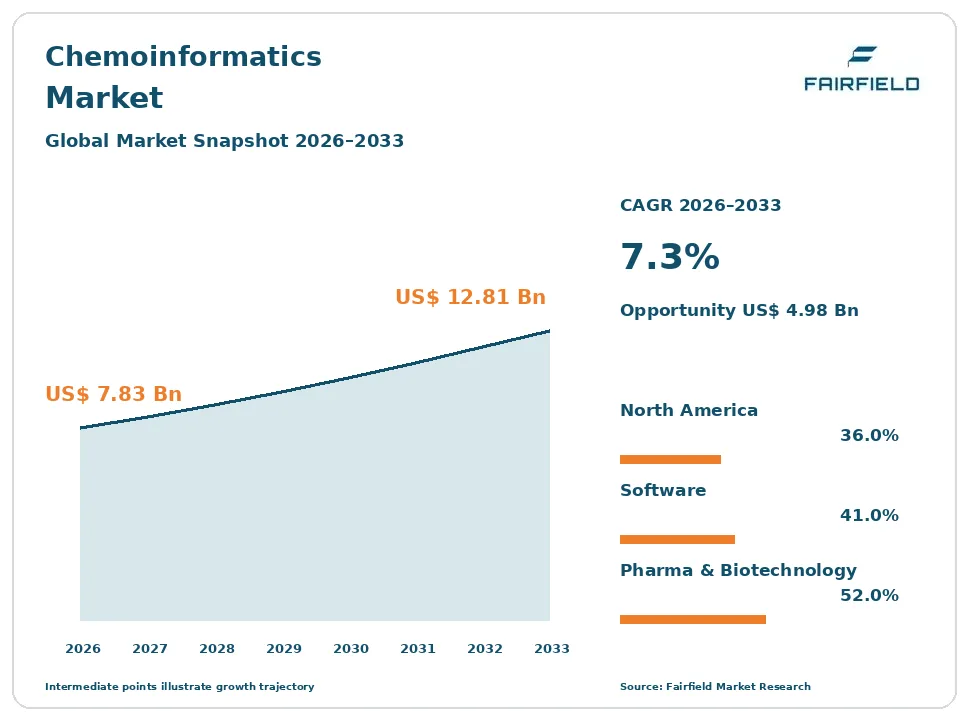
The global chemoinformatics market size is expected to be valued at US$ 7.83 billion in 2026 and projected to reach US$ 12.81 billion by 2033, growing at a CAGR of 7.3% between 2026 and 2033.
Between 2020 and 2025, the market grew at a CAGR of about 6.5%, as drug makers, chemical companies, and research labs used more software to store, search, and analyze chemical data. Chemoinformatics applies computer methods to chemistry, including structure drawing, chemical data management, property prediction, QSAR models, and searches of large compound libraries. Three factors now drive growth: the huge volume of chemical and biological data from automated labs, the use of machine learning to predict molecule properties, and pressure to cut the cost and time of drug discovery. The market is shifting toward cloud-based cheminformatics software, AI-powered design tools, and platforms that link the design, make, test, and analyze cycle. Deals such as Certara’s acquisition of Chemaxon in 2024 show vendors building end-to-end discovery platforms.
Key Report Takeaways
- By Product Type: Software held 41.0% share in 2026, while Services are projected to expand at a 9.5% CAGR through 2033, driven by outsourced data curation, modeling, and AI consulting.
- By Application: Chemical Analysis held 31.0% share in 2026, while Molecular Modeling is projected to expand at a 9.2% CAGR through 2033, driven by AI-based property prediction and structure design.
- By End User: Pharmaceutical and Biotechnology Companies held 52.0% share in 2026, while Contract Research Organizations are projected to expand at an 8.9% CAGR through 2033, driven by outsourced discovery work.
- By Region: North America held 36.0% share in 2026, while Asia Pacific is projected to expand at a 9.1% CAGR through 2033, driven by drug discovery and chemical research growth in China and India.
Global Chemoinformatics Market Trends and Insights
Drivers Impact Analysis
| Driver | Impact on CAGR Forecast | Geographic Relevance | Impact Timeline |
| Growth of chemical and biological data | High | Global | Medium term (2-4 years) |
| AI and machine learning in molecule design | High | North America, Europe, Asia Pacific | Long term (≥4 years) |
Two drivers carry the strongest influence on chemoinformatics demand during the forecast period.
Data Growth Is Driving the Chemoinformatics Market
The growth of chemical and biological data is the strongest driver of the chemoinformatics market. Labs generate more data than scientists can review by hand.
The mechanism is automation in research. High-throughput screening, robotic chemistry labs, and DNA-encoded libraries test millions of compounds, and each experiment produces structures, measurements, and images. Companies need chemical data management systems to store and search this information, avoid repeating work, and share results across teams. Public and commercial databases now hold hundreds of millions of known molecules, and virtual compound libraries contain billions more. CAS launched its CAS Intelligence Hub in 2026 to help scientists manage, connect, and analyze research data. Regulators also require clear, auditable records of chemical data. Patent searches and freedom-to-operate checks also depend on fast chemical search tools. These factors make chemoinformatics essential in modern labs.
Machine Learning Is Expanding the Chemoinformatics Market
The use of machine learning in molecule design is expanding the chemoinformatics market. AI models can predict how molecules will behave before chemists spend time and money making them.
The cause is rapid progress in AI methods and computing. Models trained on chemical data can predict solubility, toxicity, binding strength, and how easily a molecule can be synthesized. QSAR models, which link structure to activity, are becoming more accurate with deep learning. Generative AI can suggest new molecules that meet many design goals at once. Vendors such as Optibrium, which released StarDrop 8 in 2025, and Schrödinger are adding AI to their tools. Chemical and materials companies also use these tools to design polymers, batteries, and catalysts. Self-driving labs that combine robots with AI depend on chemoinformatics to choose the next experiment. These trends widen chemoinformatics use beyond pharma.
Restraints Impact Analysis
| Restraint | Impact on CAGR Forecast | Geographic Relevance | Impact Timeline |
| Data quality and standardization problems | High | Global | Medium term (2-4 years) |
| Skills shortages and software costs | Medium | Global | Short term (≤2 years) |
Two restraints limit how quickly the chemoinformatics market grows.
Data Quality Problems Slow the Chemoinformatics Market
Data quality and standardization problems slow the chemoinformatics market. Models are only as good as the data behind them.
The specific causes are inconsistent and incomplete records. Chemical structures may be drawn or stored in different formats, measurements come from different assays and labs, and errors in public databases can mislead models. Much valuable data is kept private by companies, limiting the data available for training. Negative results, such as compounds that failed, are often not recorded. Cleaning and standardizing data takes time and expert effort. Different systems in the same company may not share data easily. Older records stored in paper notebooks or scanned documents are especially hard to use. Vendors and industry groups are working on shared data standards, but progress is slow. These factors reduce trust in predictions and slow the return on software investment.
Skills Shortages Restrict the Chemoinformatics Market
Skills shortages and software costs restrict the chemoinformatics market. Few scientists combine deep chemistry knowledge with data science skills.
The underlying causes are training gaps and high demand for data skills across industries. Universities produce limited numbers of chemoinformatics specialists, and technology firms compete for data scientists with high salaries. Enterprise software licenses can be expensive for small biotechs and academic labs, which often turn to free open-source tools such as RDKit. Integrating new tools with existing lab systems requires IT support. Biotech funding has been tighter since 2022. Some vendors charge separately for each module, which raises total costs for buyers who need several tools. Training chemists to use advanced tools well takes time, and staff turnover can waste that investment. Software from different vendors may use different file formats. These factors slow adoption among smaller users and in developing countries.
Market Opportunities
Integrated Discovery Platforms Open a Platform Revenue Pool
Integrated discovery platforms open a platform revenue pool in the chemoinformatics market. Drug makers want one system for the full research cycle.
Vendors that combine chemoinformatics, modeling, and lab data can capture this opportunity. Certara agreed to acquire Chemaxon in 2024 to extend its software from drug development into discovery. Platforms that link design, synthesis, testing, and analysis reduce errors, avoid repeated work, and speed up decisions. Cloud delivery allows teams in different countries and partner companies to work together on the same data. Subscription pricing provides steady revenue. Vendors with large installed bases can sell additional modules, such as AI prediction tools and electronic lab notebooks. Integrated platforms also make it easier to apply AI, because all data sits in one place with consistent formats. Drug makers are consolidating vendors to cut costs and simplify IT, which favors suppliers with broad portfolios.
Materials and Chemicals Design Creates a New Revenue Pool
Materials and chemicals design creates a new revenue pool in the chemoinformatics market. Industries beyond pharma are adopting data-driven chemistry.
Vendors that adapt tools for chemical, battery, and materials companies can capture this opportunity. Companies developing batteries, solar materials, coatings, agrochemicals, flavors, and sustainable plastics use chemoinformatics to screen candidates and predict properties. Regulations on harmful chemicals, such as PFAS restrictions, push companies to find safer alternatives. Dassault Systèmes through BIOVIA offers materials science tools. Battery makers screen thousands of electrolyte and electrode materials on computers before testing the best in the lab. Agrochemical firms use chemoinformatics to design crop protection products with lower environmental impact. Government funding for clean energy research supports this work. This diversification reduces reliance on pharma budgets and opens new customers.
Segment Analysis
By Product Type: Software Leads While Services Grow Fastest
Software held 41.0% share in 2026, making it the largest product type. Cheminformatics software includes structure drawing, chemical registration, database search, property prediction, and analysis tools. Most large pharma and chemical companies run several software products across their research teams. Chemaxon, BIOVIA, OpenEye Scientific Software, Schrödinger, and Revvity lead this segment. Databases and other products make up much of the remaining market.
Services are the fastest-growing product type, expanding at a 9.5% CAGR through 2033. Services include data curation, custom modeling, software integration, training, and AI consulting. Many companies lack in-house experts and prefer to outsource specialized work. Jubilant Biosys and other contract firms provide these services. Vendors also sell consulting to help customers build AI models on their own data. For the market, services growth adds recurring revenue.
By Application: Chemical Analysis Leads While Molecular Modeling Grows Fastest
Chemical Analysis held 31.0% share in 2026. Chemical analysis tools help scientists identify compounds, interpret lab results, manage spectra, and check that structures are correct. They are used in pharma, chemicals, food, and environmental testing, where accurate identification of compounds is required for quality control and regulatory reporting. ACD/Labs and Revvity offer analysis software.
Molecular Modeling is the fastest-growing application, expanding at a 9.2% CAGR through 2033. Modeling tools predict molecule shapes, properties, and interactions with targets, increasingly using machine learning trained on large datasets. Drug discovery, drug validation, and regulatory compliance are other important applications for these tools. Molecular modeling links closely with QSAR and virtual screening, and new AI tools make it faster and more accurate. For the market, modeling growth supports AI-driven design.
By End User: Pharmaceutical and Biotechnology Companies Lead While CROs Grow Fastest
Pharmaceutical and Biotechnology Companies held 52.0% share in 2026. Drug makers are the largest users of chemoinformatics for discovery, lead optimization, patent searches, and safety prediction. Large companies buy enterprise licenses and build internal data science teams. They also share data in pre-competitive groups to improve AI models.
Contract Research Organizations are the fastest-growing end user, expanding at an 8.9% CAGR through 2033. Drug makers increasingly outsource chemistry and discovery work, and CROs need strong data tools to deliver results quickly and share data securely with clients. Chemical companies, government labs, and academic institutes are other key users. CROs in China and India handle large volumes of chemistry work for global clients. For the market, CRO growth widens demand.
Geography Analysis
Which Region Is Leading the Chemoinformatics Market?
North America is leading the chemoinformatics market with a 36.0% share in 2026. The United States has the largest pharmaceutical and biotech industry and many software vendors, including Schrödinger, Certara, OpenEye Scientific Software, Revvity, and Collaborative Drug Discovery. CAS, based in Ohio, runs one of the world’s largest chemical databases. Canada hosts ACD/Labs, a supplier of analytical chemistry software. Venture funding for AI drug discovery startups in Boston and San Francisco adds new software buyers. Key barriers include high costs and staff shortages. One change shaping the region is AI integration.
Europe Builds the Chemoinformatics Market Through Research Strength
Europe is a major chemoinformatics market. Hungary is home to Chemaxon, France to Dassault Systèmes, Germany to BioSolveIT and Molecular Networks, the United Kingdom to Optibrium, and Switzerland to Genedata. Large pharma and chemical companies, such as BASF, Bayer, and Novartis, in Germany, Switzerland, and the United Kingdom are major buyers. EU chemical safety rules under REACH increase demand for tools that predict toxicity without animal testing. Belgium and the Netherlands have large chemical industries. Key barriers include data privacy rules and slower funding. One opportunity is chemicals design for safer, sustainable products under EU green chemistry goals.
Which Region Is Growing Fastest in the Chemoinformatics Market?
Asia Pacific is growing fastest in the chemoinformatics market at a 9.1% CAGR through 2033. China has a fast-growing drug discovery, chemical, and materials industry, and India hosts many contract research and chemistry firms, including Jubilant Biosys. Japan and South Korea have strong pharma, electronics, and materials sectors. Singapore and Australia fund chemistry and materials research. Government programs support AI and biotech in China, and global drug makers have research centers in Shanghai and Bangalore. Key barriers include software costs and data rules. One change shaping the region is outsourced discovery work for global clients.
Latin America Develops the Chemoinformatics Market Through Academic Research
Latin America is a developing chemoinformatics market. Brazil, Mexico, and Argentina have university research groups and chemical industries that use chemoinformatics tools for teaching and research. Natural product research in Brazil uses databases to study compounds from the country’s rich plant and marine life. Pharmaceutical companies in Mexico and Brazil use these tools to support generic drug development and quality testing. Chile and Colombia have growing research programs in chemistry. Public research institutes depend heavily on government budgets. Key barriers include limited research funding and currency swings. One opportunity is open-source and cloud tools that lower costs.
Middle East & Africa Expands the Chemoinformatics Market Through Research Investment
Middle East & Africa is an emerging chemoinformatics market. Saudi Arabia and the United Arab Emirates are investing in research and chemical industries. Israel has strong chemistry and AI research, with universities such as the Weizmann Institute of Science. South Africa has academic groups studying medicinal chemistry for malaria, tuberculosis, and HIV, often in partnership with global health organizations. Qatar funds research in chemistry and materials through national programs, and Egypt has growing pharmaceutical manufacturing. Petrochemical companies such as SABIC and Saudi Aramco invest in research centers. Key barriers include limited expertise and funding. One opportunity is petrochemical and materials research.
Competitive Landscape
The chemoinformatics market is moderately concentrated. Dassault Systèmes through BIOVIA, Schrödinger, Certara with Chemaxon, Revvity, and OpenEye Scientific Software, part of Cadence, are leading vendors. CAS, ACD/Labs, Collaborative Drug Discovery, BioSolveIT, Genedata, Optibrium, and Jubilant Biosys serve specialized needs.
Companies compete on data quality, prediction accuracy, ease of use, integration with lab systems, security, and support. Large vendors offer broad platforms with many modules, while smaller firms focus on specific tools for analysis, prediction, or data management. Customer loyalty is high because switching systems means moving large chemical databases. Open-source software such as RDKit is widely used, pushing vendors to add value through support and integration. Many vendors now offer cloud versions with subscription pricing. Acquisitions are common, as larger firms buy specialists to build complete discovery platforms. Partnerships with lab automation and electronic lab notebook providers help vendors reach more users. Some AI-first startups compete by offering free tools and charging for advanced features.
Strategic moves show how competition is changing in this market. In July 2024, Certara agreed to acquire Chemaxon. In November 2025, Optibrium released StarDrop 8. In January 2026, CAS launched the CAS Intelligence Hub. These moves show competition shifting toward integrated, AI-enabled platforms that cover the full research cycle.
Three themes shape vendor strategy. First, companies are adding AI to core tools. Second, they are consolidating to offer broader platforms. Third, they are moving to the cloud with subscription pricing.
Chemoinformatics Market Industry Leaders
- Dassault Systèmes
- Schrödinger
- Certara
- Revvity
- OpenEye Scientific Software
Recent Industry Developments
- January 2026: CAS launched the CAS Intelligence Hub, a scientific data management platform for research organizations - strengthens chemical data management for research teams.
- November 2025: Optibrium released StarDrop 8 with enhanced computational drug design features - adds machine learning and design tools for medicinal chemists.
- July 2024: Certara agreed to acquire Chemaxon, a cheminformatics software provider with more than US$ 20 million in expected 2024 software revenue - extends its platform into drug discovery.
Companies Covered in the Report
- Dassault Systèmes
- Schrödinger
- Certara
- Chemaxon
- Revvity
- OpenEye Scientific Software
- CAS
- ACD/Labs
- Collaborative Drug Discovery
- BioSolveIT
- Genedata
- Optibrium
Chemoinformatics Market Report Scope
This report covers chemoinformatics software and services, including chemical data management, structure analysis, property prediction, QSAR, and molecular modeling tools, sold as licenses, subscriptions, and services, used for chemical analysis, drug discovery, drug validation, and other applications by pharmaceutical and biotechnology companies, contract research organizations, chemical companies, and academic institutes. The base year is 2025, and the forecast period runs from 2026 to 2033. All values are expressed in US$ Billion.
Product Type
- Software
- Services
- Others
Application
- Chemical Analysis
- Drug Discovery
- Drug Validation
- Molecular Modeling
- Others
End User
- Pharmaceutical and Biotechnology Companies
- Contract Research Organizations
- Chemical Companies
- Academic and Research Institutes
Regions
- North America
- Europe
- Asia Pacific
- Latin America
- Middle East & Africa
Key Questions Answered in the Report
How big is the chemoinformatics market in 2026?
The chemoinformatics market is valued at US$ 7.83 billion in 2026, led by software tools and North America.
What is the chemoinformatics market forecast to 2033?
The market is projected to reach US$ 12.81 billion by 2033, growing at a 7.3% CAGR and adding US$ 4.98 billion.
Which application is growing fastest in the chemoinformatics market?
Molecular modeling is growing fastest at a 9.2% CAGR through 2033, driven by AI-based property prediction and structure design.
Which region is growing fastest in the chemoinformatics market?
Asia Pacific is growing fastest at a 9.1% CAGR through 2033, driven by drug discovery and chemical research growth in China and India.
Which region holds the largest chemoinformatics market share?
North America holds the largest share at 36.0% in 2026, supported by the largest pharma industry and leading software vendors.
1. Executive Summary
1.1. Global Chemoinformatics Market Snapshot
1.2. Future Projections
1.3. Key Report Takeaways
1.4. Regional Snapshot
2. Market Overview
2.1. Market Definition and Report Scope
2.2. Historical Trends 2020–2025
2.3. Market Dynamics
2.3.1. Drivers
2.3.1.1. Data Growth Is Driving the Chemoinformatics Market
2.3.1.2. Machine Learning Is Expanding the Chemoinformatics Market
2.3.2. Restraints
2.3.2.1. Data Quality Problems Slow the Chemoinformatics Market
2.3.2.2. Skills Shortages Restrict the Chemoinformatics Market
2.3.3. Market Opportunities
2.3.3.1. Integrated Discovery Platforms Open a Platform Revenue Pool
2.3.3.2. Materials and Chemicals Design Creates a New Revenue Pool
3. Global Chemoinformatics Market Outlook, 2020-2033
3.1. Global Chemoinformatics Market Outlook, by Product Type, Value (US$ Billion), 2020-2033
3.1.1. Software
3.1.2. Services
3.1.3. Others
3.2. Global Chemoinformatics Market Outlook, by Application, Value (US$ Billion), 2020-2033
3.2.1. Chemical Analysis
3.2.2. Drug Discovery
3.2.3. Drug Validation
3.2.4. Molecular Modeling
3.2.5. Others
3.3. Global Chemoinformatics Market Outlook, by End User, Value (US$ Billion), 2020-2033
3.3.1. Pharmaceutical and Biotechnology Companies
3.3.2. Contract Research Organizations
3.3.3. Chemical Companies
3.3.4. Academic and Research Institutes
3.4. Global Chemoinformatics Market Outlook, by Region, Value (US$ Billion), 2020-2033
3.4.1. North America
3.4.2. Europe
3.4.3. Asia Pacific
3.4.4. Latin America
3.4.5. Middle East & Africa
4. North America Chemoinformatics Market Outlook, 2020-2033
4.1. North America Chemoinformatics Market Outlook, by Product Type, Value (US$ Billion), 2020-2033
4.1.1. Software
4.1.2. Services
4.1.3. Others
4.2. North America Chemoinformatics Market Outlook, by Application, Value (US$ Billion), 2020-2033
4.2.1. Chemical Analysis
4.2.2. Drug Discovery
4.2.3. Drug Validation
4.2.4. Molecular Modeling
4.2.5. Others
4.3. North America Chemoinformatics Market Outlook, by End User, Value (US$ Billion), 2020-2033
4.3.1. Pharmaceutical and Biotechnology Companies
4.3.2. Contract Research Organizations
4.3.3. Chemical Companies
4.3.4. Academic and Research Institutes
4.4. North America Chemoinformatics Market Outlook, by Country, Value (US$ Billion), 2020-2033
4.4.1. United States Chemoinformatics Market Outlook, by Product Type, 2020-2033
4.4.2. United States Chemoinformatics Market Outlook, by Application, 2020-2033
4.4.3. United States Chemoinformatics Market Outlook, by End User, 2020-2033
4.4.4. Canada Chemoinformatics Market Outlook, by Product Type, 2020-2033
4.4.5. Canada Chemoinformatics Market Outlook, by Application, 2020-2033
4.4.6. Canada Chemoinformatics Market Outlook, by End User, 2020-2033
5. Europe Chemoinformatics Market Outlook, 2020-2033
5.1. Europe Chemoinformatics Market Outlook, by Product Type, Value (US$ Billion), 2020-2033
5.1.1. Software
5.1.2. Services
5.1.3. Others
5.2. Europe Chemoinformatics Market Outlook, by Application, Value (US$ Billion), 2020-2033
5.2.1. Chemical Analysis
5.2.2. Drug Discovery
5.2.3. Drug Validation
5.2.4. Molecular Modeling
5.2.5. Others
5.3. Europe Chemoinformatics Market Outlook, by End User, Value (US$ Billion), 2020-2033
5.3.1. Pharmaceutical and Biotechnology Companies
5.3.2. Contract Research Organizations
5.3.3. Chemical Companies
5.3.4. Academic and Research Institutes
5.4. Europe Chemoinformatics Market Outlook, by Country, Value (US$ Billion), 2020-2033
5.4.1. Hungary Chemoinformatics Market Outlook, by Product Type, 2020-2033
5.4.2. Hungary Chemoinformatics Market Outlook, by Application, 2020-2033
5.4.3. Hungary Chemoinformatics Market Outlook, by End User, 2020-2033
5.4.4. France Chemoinformatics Market Outlook, by Product Type, 2020-2033
5.4.5. France Chemoinformatics Market Outlook, by Application, 2020-2033
5.4.6. France Chemoinformatics Market Outlook, by End User, 2020-2033
5.4.7. Germany Chemoinformatics Market Outlook, by Product Type, 2020-2033
5.4.8. Germany Chemoinformatics Market Outlook, by Application, 2020-2033
5.4.9. Germany Chemoinformatics Market Outlook, by End User, 2020-2033
5.4.10. United Kingdom Chemoinformatics Market Outlook, by Product Type, 2020-2033
5.4.11. United Kingdom Chemoinformatics Market Outlook, by Application, 2020-2033
5.4.12. United Kingdom Chemoinformatics Market Outlook, by End User, 2020-2033
5.4.13. Switzerland Chemoinformatics Market Outlook, by Product Type, 2020-2033
5.4.14. Switzerland Chemoinformatics Market Outlook, by Application, 2020-2033
5.4.15. Switzerland Chemoinformatics Market Outlook, by End User, 2020-2033
5.4.16. Belgium Chemoinformatics Market Outlook, by Product Type, 2020-2033
5.4.17. Belgium Chemoinformatics Market Outlook, by Application, 2020-2033
5.4.18. Belgium Chemoinformatics Market Outlook, by End User, 2020-2033
5.4.19. Netherlands Chemoinformatics Market Outlook, by Product Type, 2020-2033
5.4.20. Netherlands Chemoinformatics Market Outlook, by Application, 2020-2033
5.4.21. Netherlands Chemoinformatics Market Outlook, by End User, 2020-2033
6. Asia Pacific Chemoinformatics Market Outlook, 2020-2033
6.1. Asia Pacific Chemoinformatics Market Outlook, by Product Type, Value (US$ Billion), 2020-2033
6.1.1. Software
6.1.2. Services
6.1.3. Others
6.2. Asia Pacific Chemoinformatics Market Outlook, by Application, Value (US$ Billion), 2020-2033
6.2.1. Chemical Analysis
6.2.2. Drug Discovery
6.2.3. Drug Validation
6.2.4. Molecular Modeling
6.2.5. Others
6.3. Asia Pacific Chemoinformatics Market Outlook, by End User, Value (US$ Billion), 2020-2033
6.3.1. Pharmaceutical and Biotechnology Companies
6.3.2. Contract Research Organizations
6.3.3. Chemical Companies
6.3.4. Academic and Research Institutes
6.4. Asia Pacific Chemoinformatics Market Outlook, by Country, Value (US$ Billion), 2020-2033
6.4.1. China Chemoinformatics Market Outlook, by Product Type, 2020-2033
6.4.2. China Chemoinformatics Market Outlook, by Application, 2020-2033
6.4.3. China Chemoinformatics Market Outlook, by End User, 2020-2033
6.4.4. India Chemoinformatics Market Outlook, by Product Type, 2020-2033
6.4.5. India Chemoinformatics Market Outlook, by Application, 2020-2033
6.4.6. India Chemoinformatics Market Outlook, by End User, 2020-2033
6.4.7. Japan Chemoinformatics Market Outlook, by Product Type, 2020-2033
6.4.8. Japan Chemoinformatics Market Outlook, by Application, 2020-2033
6.4.9. Japan Chemoinformatics Market Outlook, by End User, 2020-2033
6.4.10. South Korea Chemoinformatics Market Outlook, by Product Type, 2020-2033
6.4.11. South Korea Chemoinformatics Market Outlook, by Application, 2020-2033
6.4.12. South Korea Chemoinformatics Market Outlook, by End User, 2020-2033
6.4.13. Singapore Chemoinformatics Market Outlook, by Product Type, 2020-2033
6.4.14. Singapore Chemoinformatics Market Outlook, by Application, 2020-2033
6.4.15. Singapore Chemoinformatics Market Outlook, by End User, 2020-2033
6.4.16. Australia Chemoinformatics Market Outlook, by Product Type, 2020-2033
6.4.17. Australia Chemoinformatics Market Outlook, by Application, 2020-2033
6.4.18. Australia Chemoinformatics Market Outlook, by End User, 2020-2033
7. Latin America Chemoinformatics Market Outlook, 2020-2033
7.1. Latin America Chemoinformatics Market Outlook, by Product Type, Value (US$ Billion), 2020-2033
7.1.1. Software
7.1.2. Services
7.1.3. Others
7.2. Latin America Chemoinformatics Market Outlook, by Application, Value (US$ Billion), 2020-2033
7.2.1. Chemical Analysis
7.2.2. Drug Discovery
7.2.3. Drug Validation
7.2.4. Molecular Modeling
7.2.5. Others
7.3. Latin America Chemoinformatics Market Outlook, by End User, Value (US$ Billion), 2020-2033
7.3.1. Pharmaceutical and Biotechnology Companies
7.3.2. Contract Research Organizations
7.3.3. Chemical Companies
7.3.4. Academic and Research Institutes
7.4. Latin America Chemoinformatics Market Outlook, by Country, Value (US$ Billion), 2020-2033
7.4.1. Brazil Chemoinformatics Market Outlook, by Product Type, 2020-2033
7.4.2. Brazil Chemoinformatics Market Outlook, by Application, 2020-2033
7.4.3. Brazil Chemoinformatics Market Outlook, by End User, 2020-2033
7.4.4. Mexico Chemoinformatics Market Outlook, by Product Type, 2020-2033
7.4.5. Mexico Chemoinformatics Market Outlook, by Application, 2020-2033
7.4.6. Mexico Chemoinformatics Market Outlook, by End User, 2020-2033
7.4.7. Argentina Chemoinformatics Market Outlook, by Product Type, 2020-2033
7.4.8. Argentina Chemoinformatics Market Outlook, by Application, 2020-2033
7.4.9. Argentina Chemoinformatics Market Outlook, by End User, 2020-2033
7.4.10. Chile Chemoinformatics Market Outlook, by Product Type, 2020-2033
7.4.11. Chile Chemoinformatics Market Outlook, by Application, 2020-2033
7.4.12. Chile Chemoinformatics Market Outlook, by End User, 2020-2033
7.4.13. Colombia Chemoinformatics Market Outlook, by Product Type, 2020-2033
7.4.14. Colombia Chemoinformatics Market Outlook, by Application, 2020-2033
7.4.15. Colombia Chemoinformatics Market Outlook, by End User, 2020-2033
8. Middle East & Africa Chemoinformatics Market Outlook, 2020-2033
8.1. Middle East & Africa Chemoinformatics Market Outlook, by Product Type, Value (US$ Billion), 2020-2033
8.1.1. Software
8.1.2. Services
8.1.3. Others
8.2. Middle East & Africa Chemoinformatics Market Outlook, by Application, Value (US$ Billion), 2020-2033
8.2.1. Chemical Analysis
8.2.2. Drug Discovery
8.2.3. Drug Validation
8.2.4. Molecular Modeling
8.2.5. Others
8.3. Middle East & Africa Chemoinformatics Market Outlook, by End User, Value (US$ Billion), 2020-2033
8.3.1. Pharmaceutical and Biotechnology Companies
8.3.2. Contract Research Organizations
8.3.3. Chemical Companies
8.3.4. Academic and Research Institutes
8.4. Middle East & Africa Chemoinformatics Market Outlook, by Country, Value (US$ Billion), 2020-2033
8.4.1. Saudi Arabia Chemoinformatics Market Outlook, by Product Type, 2020-2033
8.4.2. Saudi Arabia Chemoinformatics Market Outlook, by Application, 2020-2033
8.4.3. Saudi Arabia Chemoinformatics Market Outlook, by End User, 2020-2033
8.4.4. United Arab Emirates Chemoinformatics Market Outlook, by Product Type, 2020-2033
8.4.5. United Arab Emirates Chemoinformatics Market Outlook, by Application, 2020-2033
8.4.6. United Arab Emirates Chemoinformatics Market Outlook, by End User, 2020-2033
8.4.7. Israel Chemoinformatics Market Outlook, by Product Type, 2020-2033
8.4.8. Israel Chemoinformatics Market Outlook, by Application, 2020-2033
8.4.9. Israel Chemoinformatics Market Outlook, by End User, 2020-2033
8.4.10. South Africa Chemoinformatics Market Outlook, by Product Type, 2020-2033
8.4.11. South Africa Chemoinformatics Market Outlook, by Application, 2020-2033
8.4.12. South Africa Chemoinformatics Market Outlook, by End User, 2020-2033
8.4.13. Qatar Chemoinformatics Market Outlook, by Product Type, 2020-2033
8.4.14. Qatar Chemoinformatics Market Outlook, by Application, 2020-2033
8.4.15. Qatar Chemoinformatics Market Outlook, by End User, 2020-2033
8.4.16. Egypt Chemoinformatics Market Outlook, by Product Type, 2020-2033
8.4.17. Egypt Chemoinformatics Market Outlook, by Application, 2020-2033
8.4.18. Egypt Chemoinformatics Market Outlook, by End User, 2020-2033
9. Competitive Landscape
9.1. Market Concentration and Industry Leaders
9.2. Competitive Differentiation
9.3. Strategic Moves and Market Direction
9.4. Recent Industry Developments
9.5. Company Profiles
9.5.1. Dassault Systèmes
9.5.2. Schrödinger
9.5.3. Certara
9.5.4. Chemaxon
9.5.5. Revvity
9.5.6. OpenEye Scientific Software
9.5.7. CAS
9.5.8. ACD/Labs
9.5.9. Collaborative Drug Discovery
9.5.10. BioSolveIT
9.5.11. Genedata
9.5.12. Optibrium
10. Appendix
10.1. Research Methodology
10.2. Report Assumptions
10.3. Acronyms and Abbreviations
| Product Type | Software, Services, Others |
| Application | Chemical Analysis, Drug Discovery, Drug Validation, Molecular Modeling, Others |
| End User | Pharmaceutical and Biotechnology Companies, Contract Research Organizations, Chemical Companies, Academic and Research Institutes |
| Regions | North America, Europe, Asia Pacific, Latin America, Middle East & Africa |
Our Research Methodology
Considering the volatility of business today, traditional approaches to strategizing a game plan can be unfruitful if not detrimental. True ambiguity is no way to determine a forecast. A myriad of predetermined factors must be accounted for such as the degree of risk involved, the magnitude of circumstances, as well as conditions or consequences that are not known or unpredictable. To circumvent binary views that cast uncertainty, the application of market research intelligence to strategically posture, move, and enable actionable outcomes is necessary.
View Methodology
Quality Assured
Rigorous Validation Process

Confidentiality Assured
End-to-end Data Security

Custom Research Services
Tailored To Your Objectives
FAQs
The chemoinformatics market is valued at US$ 7.83 billion in 2026, led by software tools and North America.
The market is projected to reach US$ 12.81 billion by 2033, growing at a 7.3% CAGR and adding US$ 4.98 billion.
Molecular modeling is growing fastest at a 9.2% CAGR through 2033, driven by AI-based property prediction and structure design.
Asia Pacific is growing fastest at a 9.1% CAGR through 2033, driven by drug discovery and chemical research growth in China and India.
North America holds the largest share at 36.0% in 2026, supported by the largest pharma industry and leading software vendors.
Related Reports
Veterinary Telehealth Market Size, Share, Insights, Competitive Landscape, and Forecast 2026 to 2033
Veterinary telehealth market to grow from US$ 0.6 billion in 2026 to US$ 1.5 billion by 2033 at a 14.0% CAGR. Explore services, segments and regional insights.
Chemical Peel Market Size, Share, Insights, Competitive Landscape, and Forecast 2026 to 2033
The chemical peel market is projected to grow from US$2.4 billion in 2026 to US$4.3 billion by 2033, at an 8.7% CAGR. Explore segments and regional trends.
Smart Home Health Market Size, Share, Insights, Competitive Landscape, and Forecast 2026 to 2033
The smart home health market is projected to grow from US$5.80 billion in 2026 to US$9.90 billion by 2033, at a 7.9% CAGR, driven by aging and home monitoring.
Population Health Management Market Size, Share, Insights, Competitive Landscape, and Forecast 2026 to 2033
The population health management market is projected to grow from US$46.93 billion in 2026 to US$132.63 billion by 2033, at a 16.0% CAGR, led by value-based care.
Medical Second Opinion Market Size, Share, Insights, Competitive Landscape, and Forecast 2026 to 2033
The medical second opinion market is projected to grow from US$9.69 billion in 2026 to US$28.55 billion by 2033, at a 16.7% CAGR, led by virtual care.
Patient Blood Management Market Size, Share, Insights, Competitive Landscape, and Forecast 2026 to 2033
Explore the patient blood management market, reaching US$ 25.61 billion by 2033 at 6.4% CAGR, with product and regional insights.