



Cybersecurity Market
Cybersecurity Market Size, Share, Insights, Competitive Landscape, and Forecast 2026 to 2033
Cybersecurity Market Size and Trend Analysis
How Big Is the Cybersecurity Market and How Fast Is It Growing?
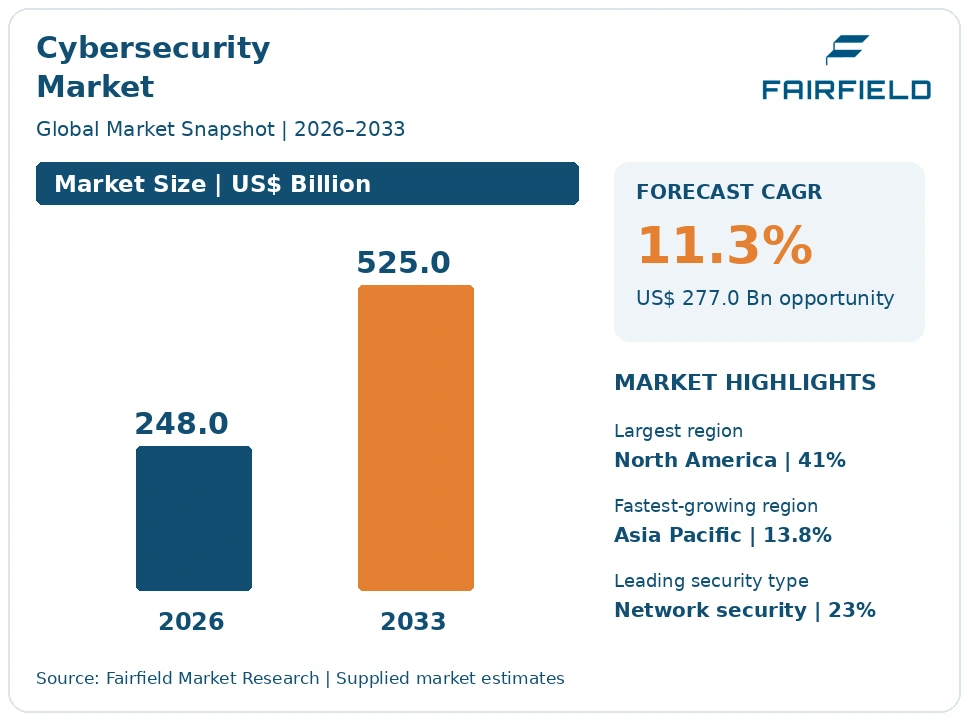
The global Cybersecurity market size is expected to be valued at US$ 248.0 billion in 2026 and projected to reach US$ 525.0 billion by 2033, growing at a CAGR of 11.3% between 2026 and 2033.
Vendor revenue grew at roughly a 12.6% CAGR between 2020 and 2025, as remote working, cloud migration and ransomware losses lifted budgets faster than general technology spending. Three factors sustain growth. Regulation now attaches personal and corporate liability to security failures, which moves budget decisions up to boards. Cloud and identity have become the primary attack surface, shifting spend away from perimeter hardware. Managed services absorb detection and response work that buyers cannot staff internally at the required scale. Growth will moderate over the forecast period as consolidation pressure caps the number of separate tools each organisation is willing to buy, but the direction of spending remains firmly upward.
Key Report Takeaways
- By Security Type: Network security held 23.0% share in 2026, while cloud and application security is projected to expand at a 15.2% CAGR through 2033, driven by workload migration and the growth of machine identities in production environments.
- By Deployment Mode: On-premise deployments held 41.0% share in 2026, while cloud-based delivery is projected to expand at a 14.6% CAGR through 2033, driven by consumption pricing and faster detection content updates.
- By Organization Size: Large enterprises held 68.0% share in 2026, while small and medium enterprises are projected to expand at a 13.4% CAGR through 2033, driven by supply-chain security requirements imposed by their larger customers.
- By End-Use Industry: Banking, financial services and insurance held 22.0% share in 2026, while manufacturing and industrial is projected to expand at a 13.9% CAGR through 2033, driven by operational technology exposure and factory network convergence.
- By Geography: North America held 41.0% share in 2026, while Asia Pacific is projected to expand at a 13.8% CAGR through 2033, driven by national data protection laws and rapid digital payment adoption.
Global Cybersecurity Market Trends and Insights
Drivers Impact Analysis
Two forces explain most of the budget growth across security software, hardware and services.
| Driver | Impact on CAGR Forecast | Geographic Relevance | Impact Timeline |
| Regulation attaching board and management liability to security failures | High | Europe and North America | Short term ≤2 years |
| Identity and cloud workload growth expanding the defended attack surface | High | Global | Long term ≥4 years |
Management Liability Rules Are Moving Security Budgets From IT to the Boardroom
Regulation has turned security spending into a governance obligation, and that changes who approves it. The NIS2 Directive makes management bodies accountable for approving and overseeing risk measures in essential and important entities, with penalties that reach individuals. The US Securities and Exchange Commission requires registrants to disclose material cybersecurity incidents and describe their governance. Budget requests that once stalled in technology committees now reach audit committees with a compliance deadline attached.
The causal mechanism is evidence. Liability rules do not simply demand controls; they demand demonstrable controls, which creates purchasing in governance, risk reporting, asset inventory, third-party assurance and incident readiness. Entities in scope must also report significant incidents within tight windows, which drives investment in detection and forensic readiness. Because NIS2 covers supply chains, obligations cascade to suppliers who were never directly regulated.
Identity Sprawl and Cloud Workloads Are Expanding the Surface That Must Be Defended
The defended surface is growing faster than headcount, which forces continuing tool investment regardless of budget discipline. Enterprises now run workloads across several cloud providers, container platforms and software-as-a-service applications, each with its own permission model. Every one of those environments needs configuration assurance, workload protection and logging, so spending rises with infrastructure footprint rather than with employee count.
The underlying change is the growth of non-human identity. Service accounts, application programming interface keys, continuous integration pipelines and automated agents now outnumber employees in most large estates, and each holds credentials that attackers can use. Identity and access management, secrets handling and entitlement review have therefore moved from administrative housekeeping to primary defence. Cloud security posture management and runtime workload protection sell on the same logic: the perimeter is now an identity boundary.
Restraints Impact Analysis
Three practical constraints limit how much security capability buyers can actually absorb.
| Restraint | Impact on CAGR Forecast | Geographic Relevance | Impact Timeline |
| Shortage of experienced security staff limiting deployment and operation | High | Global | Long term ≥4 years |
| Tool sprawl, consolidation pressure and alert fatigue capping new purchases | Medium | North America and Europe | Medium term 2–4 years |
The Security Talent Shortage Slows Deployment and Caps Tool Utilisation
The shortage of experienced practitioners limits revenue because organisations cannot operate what they buy. Detection platforms, identity governance and cloud security posture tools all require tuning, and shelfware is common where no one has time to configure policies properly. Buyers increasingly defer purchases until they can staff them, which lengthens sales cycles and pushes deals toward managed delivery rather than licensed software.
The cause is structural rather than cyclical. Security work demands experience across networking, cloud architecture, identity and incident response, and that combination takes years to build, so certification programmes cannot close the gap quickly. Salary inflation concentrates scarce staff in large enterprises and specialist providers, leaving mid-market organisations and public bodies short. Operating a round-the-clock detection function needs several trained analysts per shift, a cost that most organisations cannot carry alone.
Tool Sprawl and Alert Fatigue Are Pushing Buyers Toward Platform Consolidation
Accumulated tool sprawl is now suppressing new purchases in mature security markets. Large enterprises commonly run dozens of separate products with overlapping coverage, each with its own console, agent and contract. Procurement teams respond by freezing additions and running consolidation reviews, which closes the door on point solutions however good their technology. Vendors selling a single capability face a harder commercial case than they did a few years ago.
The operational cause is alert volume. Poorly correlated tools generate far more signals than analysts can triage, so genuine incidents are missed while staff work through noise. Each additional agent also consumes endpoint resources and adds integration and maintenance overhead. The resulting preference for consolidated platforms favours vendors with broad portfolios, compresses pricing for overlapping functions, and forces specialists to sell through partnerships rather than directly.
Market Opportunities
Two revenue pools are emerging that sit outside established detection and prevention budgets.
Post-Quantum Cryptography Migration Opens a Discovery and Remediation Revenue Pool
The migration to post-quantum cryptography creates a multi-year services and tooling pool that barely existed before. NIST has published FIPS 203, FIPS 204 and FIPS 205, giving organisations standardised algorithms to adopt, and public sector bodies in several countries have set transition expectations. The immediate commercial opportunity is not the algorithms themselves, which are free, but the cryptographic inventory problem: almost no organisation knows where its keys, certificates and embedded algorithms actually live.
Consultancies, certificate lifecycle vendors, hardware security module suppliers and code-scanning tool makers can capture this. Demand comes first from banking, defence, government, telecommunications and healthcare, where data retains value long enough that harvest-now-decrypt-later attacks matter. Supporting developments include crypto-agility requirements in procurement, certificate automation platforms, and CISA secure-by-design guidance that pushes algorithm transparency into supplier documentation.
Managed Detection for Mid-Market and Operational Technology Buyers Opens Service Revenue
Managed detection and response aimed at mid-market organisations and at operational technology environments is an underserved revenue pool. These buyers face the same threats as large enterprises but cannot fund a security operations centre, and generic monitoring services handle industrial protocols poorly. A provider that combines round-the-clock analysis with genuine plant and process understanding can charge enterprise-grade fees to customers who have no credible alternative.
Managed security service providers, systems integrators and regional telecommunications operators are best placed to capture it, often reselling platform technology rather than building their own. Demand comes from manufacturers, utilities, hospitals and logistics operators facing both ransomware exposure and regulatory scope under NIS2. Supporting developments include sectoral regulation extending to mid-sized suppliers and the maturing of protocol-aware detection content for industrial control systems.
Segment Analysis
By Security Type: Network Security Leads While Cloud and Application Security Expands Fastest
Network security held 23.0% share in 2026, the largest security type, because firewalls, secure access gateways and segmentation remain mandatory in every estate and carry substantial recurring subscription revenue alongside hardware refresh cycles. Cloud and application security is the fastest-growing type at a 15.2% CAGR through 2033, as workloads move to container platforms and software-as-a-service applications where traditional controls do not reach. Endpoint and extended detection and response remains the second largest pool, identity and access management grows steadily on the strength of machine identity requirements, and data security benefits from privacy regulation. Managed and professional security services account for a substantial and growing share of total spend. The implication is a gradual rebalancing: network security keeps its lead in absolute terms, but incremental budget increasingly flows to controls that follow the workload rather than the perimeter.
By Deployment Mode: On-Premise Retains the Installed Base While Cloud Delivery Grows Faster
On-premise deployments represented 41.0% of spend in 2026, sustained by regulated industries, government bodies and industrial operators who keep sensitive workloads and security controls inside their own boundaries. Hardware appliance refresh cycles also keep this figure high. Cloud-based delivery is the fastest-growing mode at a 14.6% CAGR through 2033, because detection content, threat intelligence and policy updates reach customers continuously rather than through scheduled upgrades. Consumption pricing also suits buyers who cannot forecast capacity. Hybrid deployment sits between the two and is the practical reality for most large organisations, which run cloud-delivered analytics over on-premise collection points. The business implication is that vendors must support both models credibly. Cloud-only architectures lose deals in defence, critical infrastructure and jurisdictions with data residency rules, while appliance-only portfolios cannot match the pace of cloud-delivered detection updates.
By Organization Size: Large Enterprises Dominate Spending as Smaller Firms Catch Up Quickly
Large enterprises accounted for 68.0% of spending in 2026, reflecting bigger estates, dedicated security teams and regulatory obligations that smaller firms historically escaped. They also buy the broad platform agreements that anchor vendor revenue. Small and medium enterprises are the fastest-growing organisation size at a 13.4% CAGR through 2033. The reason is contractual rather than voluntary: large customers now impose security requirements on suppliers, and NIS2 supply-chain provisions extend obligations to firms that are not directly in scope. Cyber insurance underwriting adds further pressure by requiring specific controls before cover is granted. Smaller firms buy differently, favouring bundled offerings delivered through managed providers and resellers over direct licensing. For vendors the implication is a channel question, because serving this segment profitably requires partner-led distribution and simplified products rather than enterprise sales motions.
By End-Use Industry: Financial Services Lead Spending While Manufacturing Accelerates
Banking, financial services and insurance held 22.0% share in 2026, the largest industry pool, because financial entities face the most prescriptive supervision and the most direct monetary losses from compromise. The Digital Operational Resilience Act has added testing, incident reporting and third-party oversight duties across the European Union. Manufacturing and industrial is the fastest-growing industry at a 13.9% CAGR through 2033, as factory networks converge with corporate systems and ransomware disrupts production directly. Government and defence remains a large and stable buyer, healthcare spends on protecting connected devices and patient records, and information technology, telecommunications, retail and energy fill the balance. The implication is that industrial buyers now need protocol-aware tooling and availability-first designs, since production networks cannot tolerate the agent deployment and patching practices normal in office environments.
Geography Analysis
Which Region Is Leading the Cybersecurity Market?
North America leads the cybersecurity market with 41.0% share in 2026, well ahead of any other region. The United States supplies most of that revenue, with Canada adding a smaller but mature market. Three causes explain the position. The region hosts the largest concentration of security vendors and venture funding, which puts new capability in front of domestic buyers first. Disclosure obligations from the US Securities and Exchange Commission force listed companies to report material incidents and describe governance, which raises board attention and budget. Federal programmes, including CISA secure-by-design work and NIST Cybersecurity Framework 2.0, set reference practices that private buyers adopt voluntarily. The main constraint is consolidation pressure among mature enterprise buyers who already own extensive tooling. The notable change ahead is federal and defence contract pressure pushing suppliers toward verifiable software security practices.
Europe: Regulatory Density Makes Compliance the Primary Purchase Trigger
Europe held 26.0% of global spending in 2026, led by Germany, the United Kingdom, France, the Netherlands and the Nordic countries. No region has a denser regulatory stack. Directive (EU) 2022/2555, known as NIS2, extends obligations across energy, transport, health, water, digital infrastructure and public administration, and holds management bodies accountable. Regulation (EU) 2022/2554, the Digital Operational Resilience Act, governs financial entities and their technology suppliers. The Cyber Resilience Act will apply security requirements to products with digital elements before they can be placed on the market. Compliance deadlines, rather than incident experience, now trigger most purchases. Data residency expectations favour vendors with in-region processing. The barrier is fragmented national transposition, which forces multinationals to satisfy differing interpretations of the same directive in each member state.
Which Region Is Growing Fastest in the Cybersecurity Market?
Asia Pacific is the fastest-growing geography in cybersecurity, at a 13.8% CAGR between 2026 and 2033, from a 24.0% share in 2026. China, Japan, India, South Korea, Singapore and Australia account for most of the spending. Growth has several causes. National data protection and critical infrastructure laws have arrived across the region within a short period, creating simultaneous compliance demand in many jurisdictions. Digital payment and public digital identity systems have scaled to enormous user numbers, concentrating risk in a few platforms. Manufacturing and logistics operators have found that production outages from ransomware cost more than the controls that prevent them. Cloud adoption is also accelerating from a lower base, which brings workload and identity security spending with it. The constraint is an acute shortage of experienced analysts, which pushes buyers toward managed services.
Latin America: Financial Sector Modernisation Carries Regional Security Spending
Latin America accounted for 5.0% of global revenue in 2026, with Brazil and Mexico supplying most of it and Chile, Colombia and Argentina following. Banking drives the market. Instant payment systems and digital-first banks have scaled quickly, bringing fraud and account takeover pressure that forces investment in identity verification, transaction monitoring and detection services. Data protection laws, most notably in Brazil, have added compliance obligations across other sectors. The barriers are familiar: constrained budgets, currency volatility that raises the cost of dollar-denominated subscriptions, and a thin pool of experienced practitioners that larger markets continually recruit from. Public sector bodies have been repeatedly disrupted by ransomware with limited recovery capability. The opportunity lies in managed detection delivered in local languages and time zones, where regional providers hold a durable advantage over distant operations centres.
Middle East & Africa: National Strategies and Critical Infrastructure Set the Agenda
Middle East & Africa contributed 4.0% of global spending in 2026, concentrated in Saudi Arabia, the United Arab Emirates, Qatar, Israel and South Africa. Government policy is the main driver. National cybersecurity authorities in the Gulf states issue binding controls for government bodies and critical sectors, and compliance is audited rather than voluntary. Energy infrastructure protection carries particular weight given the economic exposure of oil and gas operations to disruption. Israel contributes a disproportionate share of global security innovation and exports. Large digital government and smart city programmes create security requirements at the design stage. Barriers include scarce local expertise, uneven regulation across African markets, and limited budgets outside the Gulf and South Africa. The clearest opportunity is in sovereign cloud and in-country security operations capability, which policy increasingly requires.
Competitive Landscape
The cybersecurity market is moderately concentrated at the top and highly fragmented below it. A handful of broad platform vendors capture a growing share of enterprise budget, while thousands of specialists compete in narrower categories such as attack surface management, data security posture, secrets handling and industrial protocol monitoring. Concentration is increasing because buyers are deliberately reducing vendor counts. Platform providers reinforce this with suite pricing that makes an additional module cheaper than a competing standalone product. Acquisition activity has been consistently heavy, as larger vendors buy capability rather than build it, and private equity has rolled up mature categories where organic growth has slowed.
Vendors compete on several factors beyond detection quality. Breadth of integrated coverage matters most in large accounts, because it reduces the operational burden that buyers complain about. Data gravity is a second factor: whoever holds the telemetry is positioned to sell analytics on top of it. Speed of detection content delivery, quality of managed service, and independent testing results also influence decisions. Hyperscale cloud providers have become significant competitors by bundling native security controls, which pressures specialists in posture management and logging. Newer entrants apply machine learning to alert triage and exposure prioritisation, targeting the analyst shortage directly.
Strategic activity concentrates on portfolio breadth, channel reach and data platform control. Vendors are unifying consoles, investing in partner-delivered managed services to reach mid-market buyers, and building security data lakes that hold customer telemetry long term.
Strategic direction is converging on consolidation, automation and verifiable assurance. Vendors are positioning around outcome-based platform contracts and preparing for cryptographic agility requirements that procurement teams are starting to specify.
Cybersecurity Industry Leaders
- Microsoft Corporation
- Palo Alto Networks, Inc.
- CrowdStrike Holdings, Inc.
- Fortinet, Inc.
- Cisco Systems, Inc.
Recent Industry Developments
December 2023: The US Securities and Exchange Commission cybersecurity disclosure rules took effect, requiring registrants to report material incidents and describe risk governance – it moved security oversight into board-level reporting obligations.
February 2024: NIST released Cybersecurity Framework 2.0, adding a governance function and widening applicability beyond critical infrastructure – it gave buyers a common reference model for board reporting and supplier assessment.
August 2024: NIST published FIPS 203, FIPS 204 and FIPS 205, the first standardised post-quantum cryptographic algorithms – it started the multi-year cryptographic inventory and migration programme now shaping procurement.
October 2024: The transposition deadline for the NIS2 Directive, Directive (EU) 2022/2555, passed for European Union member states – it extended binding security and management accountability duties across many previously unregulated sectors.
January 2025: The Digital Operational Resilience Act, Regulation (EU) 2022/2554, became applicable to financial entities – it brought information and communications technology third-party providers under direct supervisory oversight.
Cybersecurity Market Report Scope
| Metric | Value |
| Study Period (2020–2033) | 2020–2033 |
| Market Size 2026 | US$ 248.0 Billion |
| Market Size 2033 | US$ 525.0 Billion |
| CAGR 2026–2033 | 11.3% |
| Absolute Dollar Opportunity | US$ 277.0 Billion |
| Largest Market (region) | North America (41.0% share in 2026) |
| Fastest-Growing Market (region) | Asia Pacific (13.8% CAGR) |
| Market Concentration | Medium |
| Major Players | Microsoft Corporation, Palo Alto Networks, Inc., CrowdStrike Holdings, Inc., Fortinet, Inc., Cisco Systems, Inc. |
This study measures vendor revenue from security software, hardware and services spanning network security, endpoint and extended detection and response, identity and access management, cloud and application security, data security, and managed and professional security services. In-house security staffing costs and cyber insurance premiums are excluded. The base year is 2025 and the forecast period runs from 2026 to 2033, with values in US$ Billion.
Cybersecurity Market Segmentation
Security Type
- Network Security
- Endpoint and Extended Detection and Response
- Identity and Access Management
- Cloud and Application Security
- Data Security
- Managed and Professional Security Services
Deployment Mode
- On-Premise
- Cloud-Based
- Hybrid
Organization Size
- Large Enterprises
- Small and Medium Enterprises
End-Use Industry
- Banking, Financial Services and Insurance
- Government and Defence
- Healthcare
- Information Technology and Telecommunications
- Manufacturing and Industrial
- Retail and E-Commerce
- Energy and Utilities
Regions
- North America
- Europe
- Asia Pacific
- Latin America
- Middle East & Africa
- Executive Summary
- Global Cybersecurity Market Snapshot
- Future Projections
- Key Report Takeaways
- Regional Snapshot
- Market Overview
- Market Definition and Report Scope
- Historical Trends 2020–2025
- Market Dynamics
- Drivers
- Management Liability Rules Are Moving Security Budgets From IT to the Boardroom
- Identity Sprawl and Cloud Workloads Are Expanding the Surface That Must Be Defended
- Restraints
- The Security Talent Shortage Slows Deployment and Caps Tool Utilisation
- Tool Sprawl and Alert Fatigue Are Pushing Buyers Toward Platform Consolidation
- Market Opportunities
- Post-Quantum Cryptography Migration Opens a Discovery and Remediation Revenue Pool
- Managed Detection for Mid-Market and Operational Technology Buyers Opens Service Revenue
- Drivers
- Global Cybersecurity Market Outlook, 2020–2033
- Global Cybersecurity Market Outlook, by Security Type, Value (US$ Billion), 2020–2033
- Network Security
- Endpoint and Extended Detection and Response
- Identity and Access Management
- Cloud and Application Security
- Data Security
- Managed and Professional Security Services
- Global Cybersecurity Market Outlook, by Deployment Mode, Value (US$ Billion), 2020–2033
- On-Premise
- Cloud-Based
- Hybrid
- Global Cybersecurity Market Outlook, by Organization Size, Value (US$ Billion), 2020–2033
- Large Enterprises
- Small and Medium Enterprises
- Global Cybersecurity Market Outlook, by End-Use Industry, Value (US$ Billion), 2020–2033
- Banking, Financial Services and Insurance
- Government and Defence
- Healthcare
- Information Technology and Telecommunications
- Manufacturing and Industrial
- Retail and E-Commerce
- Energy and Utilities
- Global Cybersecurity Market Outlook, by Region, Value (US$ Billion), 2020–2033
- North America
- Europe
- Asia Pacific
- Latin America
- Middle East & Africa
- Global Cybersecurity Market Outlook, by Security Type, Value (US$ Billion), 2020–2033
- North America Cybersecurity Market Outlook, 2020–2033
- North America Cybersecurity Market Outlook, by Security Type, Value (US$ Billion), 2020–2033
- Network Security
- Endpoint and Extended Detection and Response
- Identity and Access Management
- Cloud and Application Security
- Data Security
- Managed and Professional Security Services
- North America Cybersecurity Market Outlook, by Deployment Mode, Value (US$ Billion), 2020–2033
- On-Premise
- Cloud-Based
- Hybrid
- North America Cybersecurity Market Outlook, by Organization Size, Value (US$ Billion), 2020–2033
- Large Enterprises
- Small and Medium Enterprises
- North America Cybersecurity Market Outlook, by End-Use Industry, Value (US$ Billion), 2020–2033
- Banking, Financial Services and Insurance
- Government and Defence
- Healthcare
- Information Technology and Telecommunications
- Manufacturing and Industrial
- Retail and E-Commerce
- Energy and Utilities
- North America Cybersecurity Market Outlook, by Country, Value (US$ Billion), 2020–2033
- United States Cybersecurity Market Outlook, by Security Type, 2020–2033
- United States Cybersecurity Market Outlook, by Deployment Mode, 2020–2033
- United States Cybersecurity Market Outlook, by Organization Size, 2020–2033
- United States Cybersecurity Market Outlook, by End-Use Industry, 2020–2033
- Canada Cybersecurity Market Outlook, by Security Type, 2020–2033
- Canada Cybersecurity Market Outlook, by Deployment Mode, 2020–2033
- Canada Cybersecurity Market Outlook, by Organization Size, 2020–2033
- Canada Cybersecurity Market Outlook, by End-Use Industry, 2020–2033
- North America Cybersecurity Market Outlook, by Security Type, Value (US$ Billion), 2020–2033
- Europe Cybersecurity Market Outlook, 2020–2033
- Europe Cybersecurity Market Outlook, by Security Type, Value (US$ Billion), 2020–2033
- Network Security
- Endpoint and Extended Detection and Response
- Identity and Access Management
- Cloud and Application Security
- Data Security
- Managed and Professional Security Services
- Europe Cybersecurity Market Outlook, by Deployment Mode, Value (US$ Billion), 2020–2033
- On-Premise
- Cloud-Based
- Hybrid
- Europe Cybersecurity Market Outlook, by Organization Size, Value (US$ Billion), 2020–2033
- Large Enterprises
- Small and Medium Enterprises
- Europe Cybersecurity Market Outlook, by End-Use Industry, Value (US$ Billion), 2020–2033
- Banking, Financial Services and Insurance
- Government and Defence
- Healthcare
- Information Technology and Telecommunications
- Manufacturing and Industrial
- Retail and E-Commerce
- Energy and Utilities
- Europe Cybersecurity Market Outlook, by Country, Value (US$ Billion), 2020–2033
- Germany Cybersecurity Market Outlook, by Security Type, 2020–2033
- Germany Cybersecurity Market Outlook, by Deployment Mode, 2020–2033
- Germany Cybersecurity Market Outlook, by Organization Size, 2020–2033
- Germany Cybersecurity Market Outlook, by End-Use Industry, 2020–2033
- United Kingdom Cybersecurity Market Outlook, by Security Type, 2020–2033
- United Kingdom Cybersecurity Market Outlook, by Deployment Mode, 2020–2033
- United Kingdom Cybersecurity Market Outlook, by Organization Size, 2020–2033
- United Kingdom Cybersecurity Market Outlook, by End-Use Industry, 2020–2033
- France Cybersecurity Market Outlook, by Security Type, 2020–2033
- France Cybersecurity Market Outlook, by Deployment Mode, 2020–2033
- France Cybersecurity Market Outlook, by Organization Size, 2020–2033
- France Cybersecurity Market Outlook, by End-Use Industry, 2020–2033
- Netherlands Cybersecurity Market Outlook, by Security Type, 2020–2033
- Netherlands Cybersecurity Market Outlook, by Deployment Mode, 2020–2033
- Netherlands Cybersecurity Market Outlook, by Organization Size, 2020–2033
- Netherlands Cybersecurity Market Outlook, by End-Use Industry, 2020–2033
- Nordic countries Cybersecurity Market Outlook, by Security Type, 2020–2033
- Nordic countries Cybersecurity Market Outlook, by Deployment Mode, 2020–2033
- Nordic countries Cybersecurity Market Outlook, by Organization Size, 2020–2033
- Nordic countries Cybersecurity Market Outlook, by End-Use Industry, 2020–2033
- Europe Cybersecurity Market Outlook, by Security Type, Value (US$ Billion), 2020–2033
- Asia Pacific Cybersecurity Market Outlook, 2020–2033
- Asia Pacific Cybersecurity Market Outlook, by Security Type, Value (US$ Billion), 2020–2033
- Network Security
- Endpoint and Extended Detection and Response
- Identity and Access Management
- Cloud and Application Security
- Data Security
- Managed and Professional Security Services
- Asia Pacific Cybersecurity Market Outlook, by Deployment Mode, Value (US$ Billion), 2020–2033
- On-Premise
- Cloud-Based
- Hybrid
- Asia Pacific Cybersecurity Market Outlook, by Organization Size, Value (US$ Billion), 2020–2033
- Large Enterprises
- Small and Medium Enterprises
- Asia Pacific Cybersecurity Market Outlook, by End-Use Industry, Value (US$ Billion), 2020–2033
- Banking, Financial Services and Insurance
- Government and Defence
- Healthcare
- Information Technology and Telecommunications
- Manufacturing and Industrial
- Retail and E-Commerce
- Energy and Utilities
- Asia Pacific Cybersecurity Market Outlook, by Country, Value (US$ Billion), 2020–2033
- China Cybersecurity Market Outlook, by Security Type, 2020–2033
- China Cybersecurity Market Outlook, by Deployment Mode, 2020–2033
- China Cybersecurity Market Outlook, by Organization Size, 2020–2033
- China Cybersecurity Market Outlook, by End-Use Industry, 2020–2033
- Japan Cybersecurity Market Outlook, by Security Type, 2020–2033
- Japan Cybersecurity Market Outlook, by Deployment Mode, 2020–2033
- Japan Cybersecurity Market Outlook, by Organization Size, 2020–2033
- Japan Cybersecurity Market Outlook, by End-Use Industry, 2020–2033
- India Cybersecurity Market Outlook, by Security Type, 2020–2033
- India Cybersecurity Market Outlook, by Deployment Mode, 2020–2033
- India Cybersecurity Market Outlook, by Organization Size, 2020–2033
- India Cybersecurity Market Outlook, by End-Use Industry, 2020–2033
- South Korea Cybersecurity Market Outlook, by Security Type, 2020–2033
- South Korea Cybersecurity Market Outlook, by Deployment Mode, 2020–2033
- South Korea Cybersecurity Market Outlook, by Organization Size, 2020–2033
- South Korea Cybersecurity Market Outlook, by End-Use Industry, 2020–2033
- Singapore Cybersecurity Market Outlook, by Security Type, 2020–2033
- Singapore Cybersecurity Market Outlook, by Deployment Mode, 2020–2033
- Singapore Cybersecurity Market Outlook, by Organization Size, 2020–2033
- Singapore Cybersecurity Market Outlook, by End-Use Industry, 2020–2033
- Australia Cybersecurity Market Outlook, by Security Type, 2020–2033
- Australia Cybersecurity Market Outlook, by Deployment Mode, 2020–2033
- Australia Cybersecurity Market Outlook, by Organization Size, 2020–2033
- Australia Cybersecurity Market Outlook, by End-Use Industry, 2020–2033
- Asia Pacific Cybersecurity Market Outlook, by Security Type, Value (US$ Billion), 2020–2033
- Latin America Cybersecurity Market Outlook, 2020–2033
- Latin America Cybersecurity Market Outlook, by Security Type, Value (US$ Billion), 2020–2033
- Network Security
- Endpoint and Extended Detection and Response
- Identity and Access Management
- Cloud and Application Security
- Data Security
- Managed and Professional Security Services
- Latin America Cybersecurity Market Outlook, by Deployment Mode, Value (US$ Billion), 2020–2033
- On-Premise
- Cloud-Based
- Hybrid
- Latin America Cybersecurity Market Outlook, by Organization Size, Value (US$ Billion), 2020–2033
- Large Enterprises
- Small and Medium Enterprises
- Latin America Cybersecurity Market Outlook, by End-Use Industry, Value (US$ Billion), 2020–2033
- Banking, Financial Services and Insurance
- Government and Defence
- Healthcare
- Information Technology and Telecommunications
- Manufacturing and Industrial
- Retail and E-Commerce
- Energy and Utilities
- Latin America Cybersecurity Market Outlook, by Country, Value (US$ Billion), 2020–2033
- Brazil Cybersecurity Market Outlook, by Security Type, 2020–2033
- Brazil Cybersecurity Market Outlook, by Deployment Mode, 2020–2033
- Brazil Cybersecurity Market Outlook, by Organization Size, 2020–2033
- Brazil Cybersecurity Market Outlook, by End-Use Industry, 2020–2033
- Mexico Cybersecurity Market Outlook, by Security Type, 2020–2033
- Mexico Cybersecurity Market Outlook, by Deployment Mode, 2020–2033
- Mexico Cybersecurity Market Outlook, by Organization Size, 2020–2033
- Mexico Cybersecurity Market Outlook, by End-Use Industry, 2020–2033
- Chile Cybersecurity Market Outlook, by Security Type, 2020–2033
- Chile Cybersecurity Market Outlook, by Deployment Mode, 2020–2033
- Chile Cybersecurity Market Outlook, by Organization Size, 2020–2033
- Chile Cybersecurity Market Outlook, by End-Use Industry, 2020–2033
- Colombia Cybersecurity Market Outlook, by Security Type, 2020–2033
- Colombia Cybersecurity Market Outlook, by Deployment Mode, 2020–2033
- Colombia Cybersecurity Market Outlook, by Organization Size, 2020–2033
- Colombia Cybersecurity Market Outlook, by End-Use Industry, 2020–2033
- Argentina Cybersecurity Market Outlook, by Security Type, 2020–2033
- Argentina Cybersecurity Market Outlook, by Deployment Mode, 2020–2033
- Argentina Cybersecurity Market Outlook, by Organization Size, 2020–2033
- Argentina Cybersecurity Market Outlook, by End-Use Industry, 2020–2033
- Latin America Cybersecurity Market Outlook, by Security Type, Value (US$ Billion), 2020–2033
- Middle East & Africa Cybersecurity Market Outlook, 2020–2033
- Middle East & Africa Cybersecurity Market Outlook, by Security Type, Value (US$ Billion), 2020–2033
- Network Security
- Endpoint and Extended Detection and Response
- Identity and Access Management
- Cloud and Application Security
- Data Security
- Managed and Professional Security Services
- Middle East & Africa Cybersecurity Market Outlook, by Deployment Mode, Value (US$ Billion), 2020–2033
- On-Premise
- Cloud-Based
- Hybrid
- Middle East & Africa Cybersecurity Market Outlook, by Organization Size, Value (US$ Billion), 2020–2033
- Large Enterprises
- Small and Medium Enterprises
- Middle East & Africa Cybersecurity Market Outlook, by End-Use Industry, Value (US$ Billion), 2020–2033
- Banking, Financial Services and Insurance
- Government and Defence
- Healthcare
- Information Technology and Telecommunications
- Manufacturing and Industrial
- Retail and E-Commerce
- Energy and Utilities
- Middle East & Africa Cybersecurity Market Outlook, by Country, Value (US$ Billion), 2020–2033
- Saudi Arabia Cybersecurity Market Outlook, by Security Type, 2020–2033
- Saudi Arabia Cybersecurity Market Outlook, by Deployment Mode, 2020–2033
- Saudi Arabia Cybersecurity Market Outlook, by Organization Size, 2020–2033
- Saudi Arabia Cybersecurity Market Outlook, by End-Use Industry, 2020–2033
- United Arab Emirates Cybersecurity Market Outlook, by Security Type, 2020–2033
- United Arab Emirates Cybersecurity Market Outlook, by Deployment Mode, 2020–2033
- United Arab Emirates Cybersecurity Market Outlook, by Organization Size, 2020–2033
- United Arab Emirates Cybersecurity Market Outlook, by End-Use Industry, 2020–2033
- Qatar Cybersecurity Market Outlook, by Security Type, 2020–2033
- Qatar Cybersecurity Market Outlook, by Deployment Mode, 2020–2033
- Qatar Cybersecurity Market Outlook, by Organization Size, 2020–2033
- Qatar Cybersecurity Market Outlook, by End-Use Industry, 2020–2033
- Israel Cybersecurity Market Outlook, by Security Type, 2020–2033
- Israel Cybersecurity Market Outlook, by Deployment Mode, 2020–2033
- Israel Cybersecurity Market Outlook, by Organization Size, 2020–2033
- Israel Cybersecurity Market Outlook, by End-Use Industry, 2020–2033
- South Africa Cybersecurity Market Outlook, by Security Type, 2020–2033
- South Africa Cybersecurity Market Outlook, by Deployment Mode, 2020–2033
- South Africa Cybersecurity Market Outlook, by Organization Size, 2020–2033
- South Africa Cybersecurity Market Outlook, by End-Use Industry, 2020–2033
- Middle East & Africa Cybersecurity Market Outlook, by Security Type, Value (US$ Billion), 2020–2033
- Competitive Landscape
- Market Concentration and Industry Leaders
- Competitive Differentiation
- Strategic Moves and Market Direction
- Recent Industry Developments
- Company Profiles
- Microsoft Corporation
- Palo Alto Networks, Inc.
- CrowdStrike Holdings, Inc.
- Fortinet, Inc.
- Cisco Systems, Inc.
- Check Point Software Technologies Ltd.
- Zscaler, Inc.
- Okta, Inc.
- International Business Machines Corporation
- Broadcom Inc.
- Trend Micro Incorporated
- Thales S.A.
- Rapid7, Inc.
- SentinelOne, Inc.
- Appendix
- Research Methodology
- Report Assumptions
- Acronyms and Abbreviations
Security Type
- Network Security
- Endpoint and Extended Detection and Response
- Identity and Access Management
- Cloud and Application Security
- Data Security
- Managed and Professional Security Services
Deployment Mode
- On-Premise
- Cloud-Based
- Hybrid
Organization Size
- Large Enterprises
- Small and Medium Enterprises
End-Use Industry
- Banking, Financial Services and Insurance
- Government and Defence
- Healthcare
- Information Technology and Telecommunications
- Manufacturing and Industrial
- Retail and E-Commerce
- Energy and Utilities
Regions
- North America
- Europe
- Asia Pacific
- Latin America
- Middle East & Africa
Our Research Methodology
Considering the volatility of business today, traditional approaches to strategizing a game plan can be unfruitful if not detrimental. True ambiguity is no way to determine a forecast. A myriad of predetermined factors must be accounted for such as the degree of risk involved, the magnitude of circumstances, as well as conditions or consequences that are not known or unpredictable. To circumvent binary views that cast uncertainty, the application of market research intelligence to strategically posture, move, and enable actionable outcomes is necessary.
View Methodology
Quality Assured
Rigorous Validation Process

Confidentiality Assured
End-to-end Data Security

Custom Research Services
Tailored To Your Objectives
FAQs
The market is valued at US$ 248.0 billion in 2026, measured as vendor revenue from security software, hardware and services worldwide.
Revenue is projected to reach US$ 525.0 billion by 2033, an 11.3% CAGR, representing an absolute dollar opportunity of US$ 277.0 billion.
Network security leads with 23.0% share in 2026, since firewalls, secure access gateways and segmentation remain mandatory across every enterprise estate.
Cloud and application security grows fastest at a 15.2% CAGR, while Asia Pacific leads regional growth at a 13.8% CAGR through 2033.
North America leads with 41.0% share in 2026, and the market is moderately concentrated at the top while remaining highly fragmented among specialists.
Related Reports
Underwater LiDAR Market Size, Share, Insights, Competitive Landscape, and Forecast 2026 to 2033
Explore the underwater LiDAR market, projected to reach US$0.9 billion by 2033 at 12.3% CAGR, with platform, application and regional insights.
Aerial Imaging Market Size, Share, Insights, Competitive Landscape, and Forecast 2026 to 2033
The global aerial imaging market is valued at US$3.83 billion in 2026, reaching US$8.13 billion by 2033, growing at an 11.4% CAGR
Satcom Terminal Market Size, Share, Insights, Competitive Landscape, and Forecast 2026 to 2033
The satcom terminal market is projected to grow from US$8.6 billion in 2026 to US$20.6 billion by 2033, at a 13.3% CAGR. Explore segments and key trends.
Non-Dispersive Infrared Market Size, Share, Insights, Competitive Landscape, and Forecast 2026 to 2033
The non-dispersive infrared market is projected to grow from US$1.6 billion in 2026 to US$2.7 billion by 2033, at a 7.8% CAGR. Explore segments and trends.
5G Edge Computing Market Size, Share, Insights, Competitive Landscape, and Forecast 2026 to 2033
The global 5G edge computing market is valued at US$10.45 billion in 2026, reaching US$161.37 billion by 2033, growing at a 47.8% CAGR
Wearable Cameras Market Size, Share, Insights, Competitive Landscape, and Forecast 2026 to 2033
The global wearable cameras market is valued at US$8.80 billion in 2026, reaching US$20.80 billion by 2033, growing at a 13.1% CAGR