



Drug Modeling Software Market
Drug Modeling Software Market Size, Share, Insights, Competitive Landscape, and Forecast 2026 to 2033
Drug Modeling Software Market Size and Trend Analysis
How Fast Is the Drug Modeling Software Market Growing?
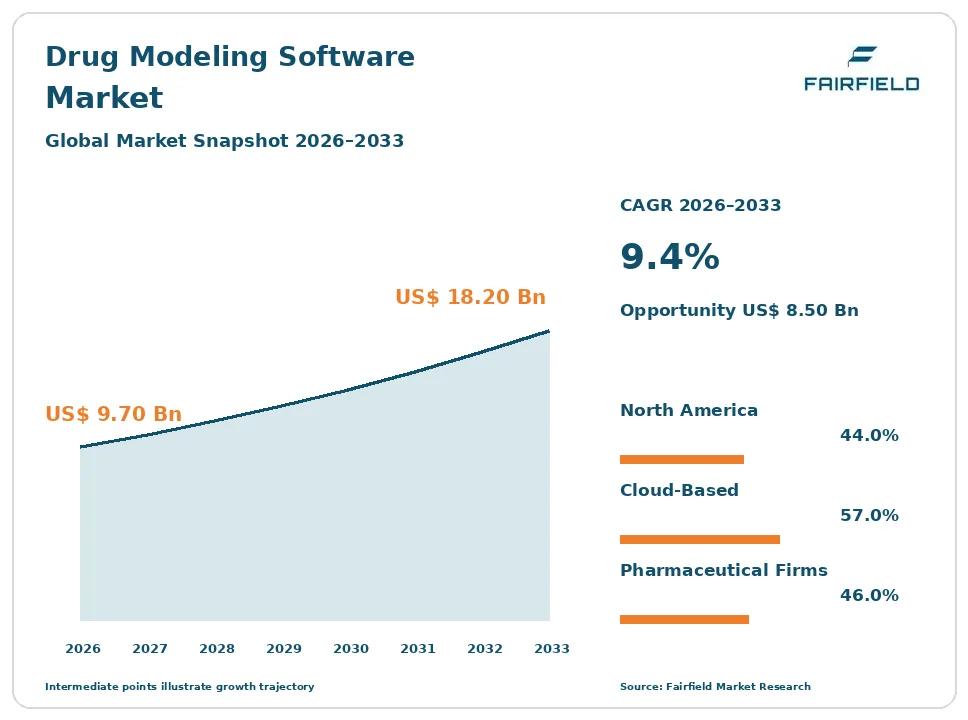
The global drug modeling software market size is expected to be valued at US$ 9.70 billion in 2026 and projected to reach US$ 18.20 billion by 2033, growing at a CAGR of 9.4% between 2026 and 2033.
Between 2020 and 2025, the market grew at a CAGR of about 8.6%, as drug makers used more computer tools to design molecules, predict how drugs behave in the body, and cut the cost of failed experiments. Drug modeling software covers computer-aided drug design, molecular docking, virtual screening, QSAR, and PK/PD modeling. Three factors now drive growth: the rising cost and long timelines of drug development, the rapid progress of AI-driven drug discovery, and regulators’ growing acceptance of model-based evidence. The market is shifting toward cloud platforms, AI models that predict protein structures and binding, and tools that connect discovery with clinical development. Large funding rounds and deals, such as Isomorphic Labs’ US$ 600 million raise in 2025 and Simulations Plus’ purchase of Pro-ficiency in 2024, show strong confidence in the field.
Key Report Takeaways
- By Software Type: Molecular Modeling held 34.0% share in 2026, while Docking and Virtual Screening are projected to expand at an 11.8% CAGR through 2033, driven by AI models that screen billions of compounds quickly.
- By Deployment Mode: Cloud-Based held 57.0% share in 2026 and is projected to expand at a 10.6% CAGR through 2033, outpacing On-Premise as users need scalable computing power.
- By End User: Pharmaceutical Companies held 46.0% share in 2026, while Biotechnology Companies are projected to expand at an 11.4% CAGR through 2033, driven by AI-first startups and venture funding.
- By Region: North America held 44.0% share in 2026, while Asia Pacific is projected to expand at an 11.6% CAGR through 2033, driven by drug research growth in China, India, and Japan.
Global Drug Modeling Software Market Trends and Insights
Drivers Impact Analysis
| Driver | Impact on CAGR Forecast | Geographic Relevance | Impact Timeline |
| Rising cost and failure rates in drug development | High | Global | Medium term (2-4 years) |
| Advances in AI and computing power | High | North America, Europe, Asia Pacific | Long term (≥4 years) |
Two drivers carry the strongest influence on drug modeling software demand during the forecast period.
Development Costs Are Driving the Drug Modeling Software Market
The rising cost and failure rates of drug development are the strongest driver of the drug modeling software market. Companies want to find good drug candidates faster and cheaper.
The mechanism is reducing waste in research. Bringing a new drug to market can cost more than US$ 2 billion and take over ten years, and most candidates fail in clinical trials. Modeling software helps scientists test thousands of molecules on computers before making any in the lab, predict toxicity and how drugs move through the body, and choose doses for trials. PK/PD modeling and physiologically based pharmacokinetic models reduce the number of animal and human studies needed. The U.S. Food and Drug Administration supports model-informed drug development and accepts modeling data in submissions. The FDA Modernization Act 2.0 allows alternatives to animal testing. These factors make modeling a standard part of research.
AI Progress Is Expanding the Drug Modeling Software Market
Advances in AI and computing power are expanding the drug modeling software market. New AI tools can predict molecular structures and interactions with high accuracy.
The cause is a breakthrough in machine learning for biology. AlphaFold 3, released by Google DeepMind and Isomorphic Labs in 2024, predicts how proteins interact with drugs, DNA, and other molecules. Generative AI can design new molecules with desired properties, such as strong binding and low toxicity. Cloud computing and graphics processors from NVIDIA make large simulations affordable for more research teams. AI-driven drug discovery companies such as Isomorphic Labs, XtalPi, and Atomwise have raised large funding rounds and signed deals with major drug makers. Established vendors are adding AI to their platforms. These trends widen use across research teams.
Restraints Impact Analysis
| Restraint | Impact on CAGR Forecast | Geographic Relevance | Impact Timeline |
| High software costs and skills shortages | High | Global | Short term (≤2 years) |
| Limits of model accuracy and data quality | Medium | Global | Long term (≥4 years) |
Two restraints limit how quickly the drug modeling software market grows.
High Costs and Skills Gaps Slow the Drug Modeling Software Market
High software costs and skills shortages slow the drug modeling software market. Advanced tools are expensive and need experts.
The specific causes are licensing fees and talent needs. Enterprise licenses for leading platforms can cost hundreds of thousands of dollars a year, and large simulations need powerful computing resources. Skilled computational chemists, biologists, and data scientists are in short supply and command high salaries. Small biotech companies and academic labs often cannot afford full platforms and rely on free or open-source tools. Integrating different tools into one workflow can be difficult. Biotech funding has also been tighter since 2022, leading some startups to cut spending. Universities also struggle to keep trained staff, who often move to industry. These factors limit adoption among smaller organizations and in developing countries.
Model Accuracy Limits Restrict the Drug Modeling Software Market
Limits of model accuracy and data quality restrict the drug modeling software market. Computer predictions do not always match real biology.
The underlying causes are complex biology and limited data. Many diseases involve processes that models do not fully capture, and predictions about how drugs behave in humans can be wrong. AI models need large, high-quality datasets, but much drug data is private, incomplete, or biased. Some scientists remain skeptical of AI claims after early disappointments. Regulators still require lab and clinical evidence. Results can also vary between software tools, making it hard to compare predictions. Validating new models against lab data takes time and money. These factors mean modeling supports but does not replace experiments, which caps spending growth.
Market Opportunities
AI-Native Discovery Platforms Open a High-Growth Revenue Pool
AI-native discovery platforms open a high-growth revenue pool in the drug modeling software market. Drug makers are partnering with AI firms to speed up early research.
Vendors with strong AI models and proven results can capture this opportunity. Isomorphic Labs raised US$ 600 million in 2025 and has partnerships with Eli Lilly and Novartis. Cresset acquired Molab.ai in 2025 to add AI tools for digital drug discovery. AI platforms can design molecules for hard targets that older methods could not address. Partnerships often include upfront payments, milestones, and royalties. Cloud delivery lets smaller biotechs access these tools without building their own computing infrastructure. Drug makers also license AI models to run on their own data, creating new software revenue.
Model-Informed Development Creates a Regulatory Revenue Pool
Model-informed drug development creates a regulatory revenue pool in the drug modeling software market. Regulators accept modeling to support dose choices and trial design.
Vendors with clinical pharmacology and regulatory expertise can capture this opportunity. PK/PD modeling and physiologically based models can replace some clinical studies, such as certain drug interaction tests, saving time and money. Simulations Plus acquired Pro-ficiency in 2024 to link modeling with clinical trial operations. Certara offers biosimulation used in many approved drugs. Rules that limit animal testing increase demand for in silico methods. Consulting services add revenue, as many companies need expert help preparing modeling evidence for regulators. Growing interest in rare disease and pediatric drugs, where patients are few, makes modeling especially valuable.
Segment Analysis
By Software Type: Molecular Modeling Leads While Docking and Virtual Screening Grow Fastest
Molecular Modeling held 34.0% share in 2026. Molecular modeling tools build 3D models of drug molecules and their targets, simulate how they move, and predict properties such as stability and solubility. They are core tools for medicinal chemists in pharma and biotech. Schrödinger, Dassault Systèmes through BIOVIA, Chemical Computing Group, and OpenEye Scientific Software lead this segment.
Docking and Virtual Screening are the fastest-growing software type, expanding at an 11.8% CAGR through 2033. Molecular docking predicts how a drug fits into its target, and virtual screening tests huge libraries of compounds on computers. AI and cloud computing allow screening of billions of molecules. PK/PD modeling, QSAR, and simulation tools are other key segments. For the market, this growth speeds early discovery.
By Deployment Mode: Cloud-Based Leads and Grows Fastest
Cloud-Based held 57.0% share in 2026 and is projected to expand at a 10.6% CAGR through 2033. Cloud platforms provide flexible computing power for large simulations and AI models without buying expensive hardware. They also make it easier for teams in different locations to share data. Amazon Web Services, Microsoft, and Google host many modeling tools.
On-Premise holds the remaining share. Some large drug makers keep sensitive data and models on their own servers for security and control. Hybrid setups, where sensitive data stays on site while heavy computing runs in the cloud, are becoming common. For the market, cloud growth lowers entry costs for smaller companies.
By End User: Pharmaceutical Companies Lead While Biotechnology Companies Grow Fastest
Pharmaceutical Companies held 46.0% share in 2026. Large drug makers run big computational chemistry and modeling teams and buy enterprise licenses from several vendors. They use modeling across discovery, development, and regulatory work. Companies such as Eli Lilly, Novartis, and AstraZeneca also partner with AI firms and invest in internal AI teams.
Biotechnology Companies are the fastest-growing end user, expanding at an 11.4% CAGR through 2033. Many new biotechs are built around AI and computational methods from the start, and they often rely on cloud tools rather than large in-house teams. Contract research organizations and academic institutes also use modeling software. Contract research organizations are adding modeling services to win more drug development work. For the market, biotech growth widens the customer base.
Geography Analysis
Which Region Is Leading the Drug Modeling Software Market?
North America is leading the drug modeling software market with a 44.0% share in 2026. The United States has the largest pharmaceutical and biotech industry, strong venture funding, and major vendors such as Schrödinger, Certara, Simulations Plus, and OpenEye Scientific Software. The U.S. Food and Drug Administration supports model-informed drug development. Canada hosts Chemical Computing Group. Large technology firms, including NVIDIA, Microsoft, and Google, invest in AI tools for biology. Key barriers include high costs and a shortage of skilled staff. One change shaping the region is AI adoption across discovery teams.
Europe Builds the Drug Modeling Software Market Through Research Strength
Europe is a major drug modeling software market. The United Kingdom hosts Isomorphic Labs, Cresset, and Optibrium, while France is home to Dassault Systèmes and Germany to BioSolveIT. Switzerland and Denmark have large pharma companies, such as Novartis, Roche, and Novo Nordisk, with big computational teams. The European Medicines Agency accepts modeling data in drug submissions. The Netherlands and Belgium host growing biotech clusters. EU funding programs support AI and digital health research. Key barriers include data privacy rules and slower venture funding. One opportunity is AI research partnerships between universities, pharma, and software firms.
Which Region Is Growing Fastest in the Drug Modeling Software Market?
Asia Pacific is growing fastest in the drug modeling software market at an 11.6% CAGR through 2033. China has a fast-growing drug discovery sector and AI firms such as XtalPi, and India has a large base of contract research and generic drug makers. Japan and South Korea are investing in AI drug discovery. Singapore and Australia support biotech research. Government programs in China support AI and biotech as strategic industries, and many global drug makers run research centers in the region. Key barriers include software costs and data rules. One change shaping the region is local AI platforms.
Latin America Develops the Drug Modeling Software Market Through Academic Research
Latin America is a developing drug modeling software market. Brazil and Mexico have growing pharmaceutical industries and university research programs that use modeling tools for drug design and teaching. Argentina and Chile have academic groups working on tropical disease research and drug design. Public research institutes and universities in Brazil, such as Fiocruz, use computational tools to study diseases like dengue and Chagas disease. Pharmaceutical companies in Mexico and Argentina are adding modeling to support generic and biosimilar development. Key barriers include limited research funding and currency swings. One opportunity is cloud-based access at lower cost for universities.
Middle East & Africa Expands the Drug Modeling Software Market Through Research Investment
Middle East & Africa is an emerging drug modeling software market. Israel has a strong biotech and AI sector, with startups building computational drug design tools. Saudi Arabia and the United Arab Emirates are investing in life sciences research and AI centers. South Africa has academic research on infectious diseases such as tuberculosis and HIV. Qatar funds biomedical research through national programs, and Egypt has growing pharmaceutical manufacturing. Researchers in Kenya and Nigeria study malaria and other infectious diseases with modeling tools. Key barriers include limited local expertise and research funding. One opportunity is partnerships between global vendors and universities.
Competitive Landscape
The drug modeling software market is moderately concentrated. Dassault Systèmes through BIOVIA, Schrödinger, Certara, Simulations Plus, Chemical Computing Group, and OpenEye Scientific Software, part of Cadence, are established leaders. Dotmatics, Cresset, Optibrium, and BioSolveIT serve specialized needs, while AI firms such as Isomorphic Labs, XtalPi, Atomwise, and VeriSIM Life are growing fast.
Companies compete on accuracy, speed, ease of use, AI features, integration with lab data, and scientific support. Established vendors have large customer bases, long track records, and validated tools, while AI firms compete on new methods and partnerships with drug makers. Some companies sell software, while others use their platforms to develop their own drugs, creating a mix of business models. Acquisitions are common as larger vendors buy specialists to fill gaps. Partnerships with cloud providers and chip makers help vendors run larger simulations at lower cost.
Strategic moves show how competition is changing. In May 2024, Google DeepMind and Isomorphic Labs released AlphaFold 3. In June 2024, Simulations Plus acquired Pro-ficiency for US$ 100 million. In March 2025, Isomorphic Labs raised US$ 600 million. In July 2025, Cresset acquired Molab.ai. These moves show competition shifting toward AI and end-to-end platforms that cover discovery through clinical development.
Three themes shape vendor strategy. First, companies are adding AI to core products. Second, they are buying complementary tools to cover more of the workflow. Third, they are moving to the cloud.
Drug Modeling Software Market Industry Leaders
- Dassault Systèmes
- Schrödinger
- Certara
- Simulations Plus
- Chemical Computing Group
Recent Industry Developments
- July 2025: Cresset acquired Molab.ai to advance the digitization of drug discovery - adds AI tools to its modeling software.
- March 2025: Isomorphic Labs raised US$ 600 million in its first external funding round - funds AI-driven drug discovery and its internal pipeline.
- June 2024: Simulations Plus acquired Pro-ficiency for US$ 100 million - links modeling with clinical trial operations.
- May 2024: Google DeepMind and Isomorphic Labs released AlphaFold 3, predicting interactions between proteins, drugs, and other molecules - advances structure-based computer-aided drug design.
Companies Covered in the Report
- Dassault Systèmes
- Schrödinger
- Certara
- Simulations Plus
- Chemical Computing Group
- OpenEye Scientific Software
- Dotmatics
- Cresset
- Optibrium
- XtalPi
- Atomwise
- Isomorphic Labs
Drug Modeling Software Market Report Scope
This report covers drug modeling software, including molecular modeling, PK/PD modeling, QSAR, simulation and visualization, and docking and virtual screening tools, deployed on-premise and in the cloud, used by pharmaceutical companies, biotechnology companies, contract research organizations, and academic and research institutes across therapeutic areas. The base year is 2025, and the forecast period runs from 2026 to 2033. All values are expressed in US$ Billion.
Software Type
- Molecular Modeling
- PK/PD Modeling
- QSAR
- Simulation and Visualization
- Docking and Virtual Screening
Deployment Mode
- Cloud-Based
- On-Premise
End User
- Pharmaceutical Companies
- Biotechnology Companies
- Contract Research Organizations
- Academic and Research Institutes
Regions
- North America
- Europe
- Asia Pacific
- Latin America
- Middle East & Africa
Key Questions Answered in the Report
How big is the drug modeling software market in 2026?
The drug modeling software market is valued at US$ 9.70 billion in 2026, led by molecular modeling and North America.
What is the drug modeling software market forecast to 2033?
The market is projected to reach US$ 18.20 billion by 2033, growing at a 9.4% CAGR and adding US$ 8.50 billion.
Which software type is growing fastest in the drug modeling software market?
Docking and virtual screening are growing fastest at an 11.8% CAGR through 2033, driven by AI models that screen billions of compounds.
Which region is growing fastest in the drug modeling software market?
Asia Pacific is growing fastest at an 11.6% CAGR through 2033, driven by drug research growth in China, India, and Japan.
Which region holds the largest drug modeling software market share?
North America holds the largest share at 44.0% in 2026, supported by the largest pharma industry and leading software vendors.
1. Executive Summary
1.1. Global Drug Modeling Software Market Snapshot
1.2. Future Projections
1.3. Key Report Takeaways
1.4. Regional Snapshot
2. Market Overview
2.1. Market Definition and Report Scope
2.2. Historical Trends 2020–2025
2.3. Market Dynamics
2.3.1. Drivers
2.3.1.1. Development Costs Are Driving the Drug Modeling Software Market
2.3.1.2. AI Progress Is Expanding the Drug Modeling Software Market
2.3.2. Restraints
2.3.2.1. High Costs and Skills Gaps Slow the Drug Modeling Software Market
2.3.2.2. Model Accuracy Limits Restrict the Drug Modeling Software Market
2.3.3. Market Opportunities
2.3.3.1. AI-Native Discovery Platforms Open a High-Growth Revenue Pool
2.3.3.2. Model-Informed Development Creates a Regulatory Revenue Pool
3. Global Drug Modeling Software Market Outlook, 2020-2033
3.1. Global Drug Modeling Software Market Outlook, by Software Type, Value (US$ Billion), 2020-2033
3.1.1. Molecular Modeling
3.1.2. PK/PD Modeling
3.1.3. QSAR
3.1.4. Simulation and Visualization
3.1.5. Docking and Virtual Screening
3.2. Global Drug Modeling Software Market Outlook, by Deployment Mode, Value (US$ Billion), 2020-2033
3.2.1. Cloud-Based
3.2.2. On-Premise
3.3. Global Drug Modeling Software Market Outlook, by End User, Value (US$ Billion), 2020-2033
3.3.1. Pharmaceutical Companies
3.3.2. Biotechnology Companies
3.3.3. Contract Research Organizations
3.3.4. Academic and Research Institutes
3.4. Global Drug Modeling Software Market Outlook, by Region, Value (US$ Billion), 2020-2033
3.4.1. North America
3.4.2. Europe
3.4.3. Asia Pacific
3.4.4. Latin America
3.4.5. Middle East & Africa
4. North America Drug Modeling Software Market Outlook, 2020-2033
4.1. North America Drug Modeling Software Market Outlook, by Software Type, Value (US$ Billion), 2020-2033
4.1.1. Molecular Modeling
4.1.2. PK/PD Modeling
4.1.3. QSAR
4.1.4. Simulation and Visualization
4.1.5. Docking and Virtual Screening
4.2. North America Drug Modeling Software Market Outlook, by Deployment Mode, Value (US$ Billion), 2020-2033
4.2.1. Cloud-Based
4.2.2. On-Premise
4.3. North America Drug Modeling Software Market Outlook, by End User, Value (US$ Billion), 2020-2033
4.3.1. Pharmaceutical Companies
4.3.2. Biotechnology Companies
4.3.3. Contract Research Organizations
4.3.4. Academic and Research Institutes
4.4. North America Drug Modeling Software Market Outlook, by Country, Value (US$ Billion), 2020-2033
4.4.1. United States Drug Modeling Software Market Outlook, by Software Type, 2020-2033
4.4.2. United States Drug Modeling Software Market Outlook, by Deployment Mode, 2020-2033
4.4.3. United States Drug Modeling Software Market Outlook, by End User, 2020-2033
4.4.4. Canada Drug Modeling Software Market Outlook, by Software Type, 2020-2033
4.4.5. Canada Drug Modeling Software Market Outlook, by Deployment Mode, 2020-2033
4.4.6. Canada Drug Modeling Software Market Outlook, by End User, 2020-2033
5. Europe Drug Modeling Software Market Outlook, 2020-2033
5.1. Europe Drug Modeling Software Market Outlook, by Software Type, Value (US$ Billion), 2020-2033
5.1.1. Molecular Modeling
5.1.2. PK/PD Modeling
5.1.3. QSAR
5.1.4. Simulation and Visualization
5.1.5. Docking and Virtual Screening
5.2. Europe Drug Modeling Software Market Outlook, by Deployment Mode, Value (US$ Billion), 2020-2033
5.2.1. Cloud-Based
5.2.2. On-Premise
5.3. Europe Drug Modeling Software Market Outlook, by End User, Value (US$ Billion), 2020-2033
5.3.1. Pharmaceutical Companies
5.3.2. Biotechnology Companies
5.3.3. Contract Research Organizations
5.3.4. Academic and Research Institutes
5.4. Europe Drug Modeling Software Market Outlook, by Country, Value (US$ Billion), 2020-2033
5.4.1. United Kingdom Drug Modeling Software Market Outlook, by Software Type, 2020-2033
5.4.2. United Kingdom Drug Modeling Software Market Outlook, by Deployment Mode, 2020-2033
5.4.3. United Kingdom Drug Modeling Software Market Outlook, by End User, 2020-2033
5.4.4. France Drug Modeling Software Market Outlook, by Software Type, 2020-2033
5.4.5. France Drug Modeling Software Market Outlook, by Deployment Mode, 2020-2033
5.4.6. France Drug Modeling Software Market Outlook, by End User, 2020-2033
5.4.7. Germany Drug Modeling Software Market Outlook, by Software Type, 2020-2033
5.4.8. Germany Drug Modeling Software Market Outlook, by Deployment Mode, 2020-2033
5.4.9. Germany Drug Modeling Software Market Outlook, by End User, 2020-2033
5.4.10. Switzerland Drug Modeling Software Market Outlook, by Software Type, 2020-2033
5.4.11. Switzerland Drug Modeling Software Market Outlook, by Deployment Mode, 2020-2033
5.4.12. Switzerland Drug Modeling Software Market Outlook, by End User, 2020-2033
5.4.13. Denmark Drug Modeling Software Market Outlook, by Software Type, 2020-2033
5.4.14. Denmark Drug Modeling Software Market Outlook, by Deployment Mode, 2020-2033
5.4.15. Denmark Drug Modeling Software Market Outlook, by End User, 2020-2033
5.4.16. Netherlands Drug Modeling Software Market Outlook, by Software Type, 2020-2033
5.4.17. Netherlands Drug Modeling Software Market Outlook, by Deployment Mode, 2020-2033
5.4.18. Netherlands Drug Modeling Software Market Outlook, by End User, 2020-2033
5.4.19. Belgium Drug Modeling Software Market Outlook, by Software Type, 2020-2033
5.4.20. Belgium Drug Modeling Software Market Outlook, by Deployment Mode, 2020-2033
5.4.21. Belgium Drug Modeling Software Market Outlook, by End User, 2020-2033
6. Asia Pacific Drug Modeling Software Market Outlook, 2020-2033
6.1. Asia Pacific Drug Modeling Software Market Outlook, by Software Type, Value (US$ Billion), 2020-2033
6.1.1. Molecular Modeling
6.1.2. PK/PD Modeling
6.1.3. QSAR
6.1.4. Simulation and Visualization
6.1.5. Docking and Virtual Screening
6.2. Asia Pacific Drug Modeling Software Market Outlook, by Deployment Mode, Value (US$ Billion), 2020-2033
6.2.1. Cloud-Based
6.2.2. On-Premise
6.3. Asia Pacific Drug Modeling Software Market Outlook, by End User, Value (US$ Billion), 2020-2033
6.3.1. Pharmaceutical Companies
6.3.2. Biotechnology Companies
6.3.3. Contract Research Organizations
6.3.4. Academic and Research Institutes
6.4. Asia Pacific Drug Modeling Software Market Outlook, by Country, Value (US$ Billion), 2020-2033
6.4.1. China Drug Modeling Software Market Outlook, by Software Type, 2020-2033
6.4.2. China Drug Modeling Software Market Outlook, by Deployment Mode, 2020-2033
6.4.3. China Drug Modeling Software Market Outlook, by End User, 2020-2033
6.4.4. India Drug Modeling Software Market Outlook, by Software Type, 2020-2033
6.4.5. India Drug Modeling Software Market Outlook, by Deployment Mode, 2020-2033
6.4.6. India Drug Modeling Software Market Outlook, by End User, 2020-2033
6.4.7. Japan Drug Modeling Software Market Outlook, by Software Type, 2020-2033
6.4.8. Japan Drug Modeling Software Market Outlook, by Deployment Mode, 2020-2033
6.4.9. Japan Drug Modeling Software Market Outlook, by End User, 2020-2033
6.4.10. South Korea Drug Modeling Software Market Outlook, by Software Type, 2020-2033
6.4.11. South Korea Drug Modeling Software Market Outlook, by Deployment Mode, 2020-2033
6.4.12. South Korea Drug Modeling Software Market Outlook, by End User, 2020-2033
6.4.13. Singapore Drug Modeling Software Market Outlook, by Software Type, 2020-2033
6.4.14. Singapore Drug Modeling Software Market Outlook, by Deployment Mode, 2020-2033
6.4.15. Singapore Drug Modeling Software Market Outlook, by End User, 2020-2033
6.4.16. Australia Drug Modeling Software Market Outlook, by Software Type, 2020-2033
6.4.17. Australia Drug Modeling Software Market Outlook, by Deployment Mode, 2020-2033
6.4.18. Australia Drug Modeling Software Market Outlook, by End User, 2020-2033
7. Latin America Drug Modeling Software Market Outlook, 2020-2033
7.1. Latin America Drug Modeling Software Market Outlook, by Software Type, Value (US$ Billion), 2020-2033
7.1.1. Molecular Modeling
7.1.2. PK/PD Modeling
7.1.3. QSAR
7.1.4. Simulation and Visualization
7.1.5. Docking and Virtual Screening
7.2. Latin America Drug Modeling Software Market Outlook, by Deployment Mode, Value (US$ Billion), 2020-2033
7.2.1. Cloud-Based
7.2.2. On-Premise
7.3. Latin America Drug Modeling Software Market Outlook, by End User, Value (US$ Billion), 2020-2033
7.3.1. Pharmaceutical Companies
7.3.2. Biotechnology Companies
7.3.3. Contract Research Organizations
7.3.4. Academic and Research Institutes
7.4. Latin America Drug Modeling Software Market Outlook, by Country, Value (US$ Billion), 2020-2033
7.4.1. Brazil Drug Modeling Software Market Outlook, by Software Type, 2020-2033
7.4.2. Brazil Drug Modeling Software Market Outlook, by Deployment Mode, 2020-2033
7.4.3. Brazil Drug Modeling Software Market Outlook, by End User, 2020-2033
7.4.4. Mexico Drug Modeling Software Market Outlook, by Software Type, 2020-2033
7.4.5. Mexico Drug Modeling Software Market Outlook, by Deployment Mode, 2020-2033
7.4.6. Mexico Drug Modeling Software Market Outlook, by End User, 2020-2033
7.4.7. Argentina Drug Modeling Software Market Outlook, by Software Type, 2020-2033
7.4.8. Argentina Drug Modeling Software Market Outlook, by Deployment Mode, 2020-2033
7.4.9. Argentina Drug Modeling Software Market Outlook, by End User, 2020-2033
7.4.10. Chile Drug Modeling Software Market Outlook, by Software Type, 2020-2033
7.4.11. Chile Drug Modeling Software Market Outlook, by Deployment Mode, 2020-2033
7.4.12. Chile Drug Modeling Software Market Outlook, by End User, 2020-2033
8. Middle East & Africa Drug Modeling Software Market Outlook, 2020-2033
8.1. Middle East & Africa Drug Modeling Software Market Outlook, by Software Type, Value (US$ Billion), 2020-2033
8.1.1. Molecular Modeling
8.1.2. PK/PD Modeling
8.1.3. QSAR
8.1.4. Simulation and Visualization
8.1.5. Docking and Virtual Screening
8.2. Middle East & Africa Drug Modeling Software Market Outlook, by Deployment Mode, Value (US$ Billion), 2020-2033
8.2.1. Cloud-Based
8.2.2. On-Premise
8.3. Middle East & Africa Drug Modeling Software Market Outlook, by End User, Value (US$ Billion), 2020-2033
8.3.1. Pharmaceutical Companies
8.3.2. Biotechnology Companies
8.3.3. Contract Research Organizations
8.3.4. Academic and Research Institutes
8.4. Middle East & Africa Drug Modeling Software Market Outlook, by Country, Value (US$ Billion), 2020-2033
8.4.1. Israel Drug Modeling Software Market Outlook, by Software Type, 2020-2033
8.4.2. Israel Drug Modeling Software Market Outlook, by Deployment Mode, 2020-2033
8.4.3. Israel Drug Modeling Software Market Outlook, by End User, 2020-2033
8.4.4. Saudi Arabia Drug Modeling Software Market Outlook, by Software Type, 2020-2033
8.4.5. Saudi Arabia Drug Modeling Software Market Outlook, by Deployment Mode, 2020-2033
8.4.6. Saudi Arabia Drug Modeling Software Market Outlook, by End User, 2020-2033
8.4.7. United Arab Emirates Drug Modeling Software Market Outlook, by Software Type, 2020-2033
8.4.8. United Arab Emirates Drug Modeling Software Market Outlook, by Deployment Mode, 2020-2033
8.4.9. United Arab Emirates Drug Modeling Software Market Outlook, by End User, 2020-2033
8.4.10. South Africa Drug Modeling Software Market Outlook, by Software Type, 2020-2033
8.4.11. South Africa Drug Modeling Software Market Outlook, by Deployment Mode, 2020-2033
8.4.12. South Africa Drug Modeling Software Market Outlook, by End User, 2020-2033
8.4.13. Qatar Drug Modeling Software Market Outlook, by Software Type, 2020-2033
8.4.14. Qatar Drug Modeling Software Market Outlook, by Deployment Mode, 2020-2033
8.4.15. Qatar Drug Modeling Software Market Outlook, by End User, 2020-2033
8.4.16. Egypt Drug Modeling Software Market Outlook, by Software Type, 2020-2033
8.4.17. Egypt Drug Modeling Software Market Outlook, by Deployment Mode, 2020-2033
8.4.18. Egypt Drug Modeling Software Market Outlook, by End User, 2020-2033
8.4.19. Kenya Drug Modeling Software Market Outlook, by Software Type, 2020-2033
8.4.20. Kenya Drug Modeling Software Market Outlook, by Deployment Mode, 2020-2033
8.4.21. Kenya Drug Modeling Software Market Outlook, by End User, 2020-2033
8.4.22. Nigeria Drug Modeling Software Market Outlook, by Software Type, 2020-2033
8.4.23. Nigeria Drug Modeling Software Market Outlook, by Deployment Mode, 2020-2033
8.4.24. Nigeria Drug Modeling Software Market Outlook, by End User, 2020-2033
9. Competitive Landscape
9.1. Market Concentration and Industry Leaders
9.2. Competitive Differentiation
9.3. Strategic Moves and Market Direction
9.4. Recent Industry Developments
9.5. Company Profiles
9.5.1. Dassault Systèmes
9.5.2. Schrödinger
9.5.3. Certara
9.5.4. Simulations Plus
9.5.5. Chemical Computing Group
9.5.6. OpenEye Scientific Software
9.5.7. Dotmatics
9.5.8. Cresset
9.5.9. Optibrium
9.5.10. XtalPi
9.5.11. Atomwise
9.5.12. Isomorphic Labs
10. Appendix
10.1. Research Methodology
10.2. Report Assumptions
10.3. Acronyms and Abbreviations
| Software Type | Molecular Modeling, PK/PD Modeling, QSAR, Simulation and Visualization, Docking and Virtual Screening |
| Deployment Mode | Cloud-Based, On-Premise |
| End User | Pharmaceutical Companies, Biotechnology Companies, Contract Research Organizations, Academic and Research Institutes |
| Regions | North America, Europe, Asia Pacific, Latin America, Middle East & Africa |
Our Research Methodology
Considering the volatility of business today, traditional approaches to strategizing a game plan can be unfruitful if not detrimental. True ambiguity is no way to determine a forecast. A myriad of predetermined factors must be accounted for such as the degree of risk involved, the magnitude of circumstances, as well as conditions or consequences that are not known or unpredictable. To circumvent binary views that cast uncertainty, the application of market research intelligence to strategically posture, move, and enable actionable outcomes is necessary.
View Methodology
Quality Assured
Rigorous Validation Process

Confidentiality Assured
End-to-end Data Security

Custom Research Services
Tailored To Your Objectives
FAQs
The drug modeling software market is valued at US$ 9.70 billion in 2026, led by molecular modeling and North America.
The market is projected to reach US$ 18.20 billion by 2033, growing at a 9.4% CAGR and adding US$ 8.50 billion.
Docking and virtual screening are growing fastest at an 11.8% CAGR through 2033, driven by AI models that screen billions of compounds.
Asia Pacific is growing fastest at an 11.6% CAGR through 2033, driven by drug research growth in China, India, and Japan.
North America holds the largest share at 44.0% in 2026, supported by the largest pharma industry and leading software vendors.
Related Reports
Veterinary Telehealth Market Size, Share, Insights, Competitive Landscape, and Forecast 2026 to 2033
Veterinary telehealth market to grow from US$ 0.6 billion in 2026 to US$ 1.5 billion by 2033 at a 14.0% CAGR. Explore services, segments and regional insights.
Chemical Peel Market Size, Share, Insights, Competitive Landscape, and Forecast 2026 to 2033
The chemical peel market is projected to grow from US$2.4 billion in 2026 to US$4.3 billion by 2033, at an 8.7% CAGR. Explore segments and regional trends.
Smart Home Health Market Size, Share, Insights, Competitive Landscape, and Forecast 2026 to 2033
The smart home health market is projected to grow from US$5.80 billion in 2026 to US$9.90 billion by 2033, at a 7.9% CAGR, driven by aging and home monitoring.
Population Health Management Market Size, Share, Insights, Competitive Landscape, and Forecast 2026 to 2033
The population health management market is projected to grow from US$46.93 billion in 2026 to US$132.63 billion by 2033, at a 16.0% CAGR, led by value-based care.
Medical Second Opinion Market Size, Share, Insights, Competitive Landscape, and Forecast 2026 to 2033
The medical second opinion market is projected to grow from US$9.69 billion in 2026 to US$28.55 billion by 2033, at a 16.7% CAGR, led by virtual care.
Patient Blood Management Market Size, Share, Insights, Competitive Landscape, and Forecast 2026 to 2033
Explore the patient blood management market, reaching US$ 25.61 billion by 2033 at 6.4% CAGR, with product and regional insights.