



Ethyl Acetate Market
Ethyl Acetate Market Size, Share, Insights, Competitive Landscape, and Forecast 2026 to 2033
How Big Will the Ethyl Acetate Market Be by 2033?
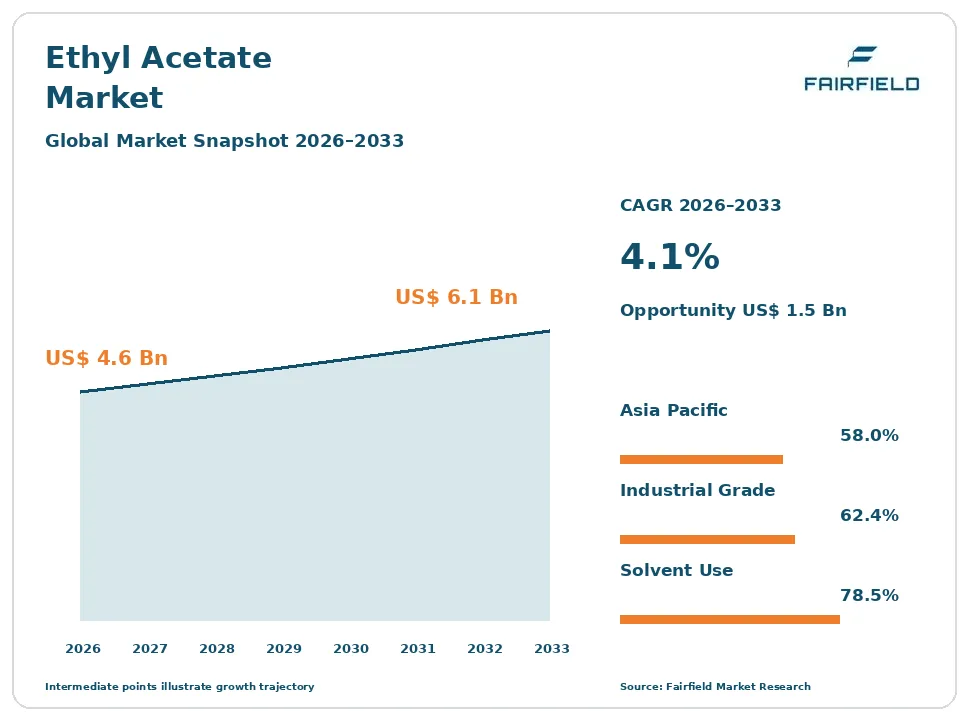
The global ethyl acetate market size is expected to be valued at US$ 4.6 billion in 2026 and projected to reach US$ 6.1 billion by 2033, growing at a CAGR of 4.1% between 2026 and 2033.
Between 2020 and 2025 the market advanced at roughly 2.9% a year, held back by weak printing demand and by sharp swings in ethanol and acetic acid costs. Three forces carry growth to 2033. Flexible packaging conversion in Asia keeps lamination adhesive demand rising faster than solvent use overall. Pharmaceutical and fine chemical manufacturers keep displacing higher-risk solvents with this ester because it sits in the lower-risk residual solvent class. Bio-attributed grades made from fermentation ethanol are opening a premium pool. The direction is steady commodity growth, with the ester gaining share inside a solvent pool that is itself close to flat.
Key Report Takeaways
- By Production Route: Esterification held 48.5% share in 2026, while bio-based material from fermentation ethanol is projected to expand at a 7.8% CAGR through 2033, driven by sugarcane and grain ethanol feedstock that makes certified renewable carbon straightforward in several producing countries.
- By Grade: Industrial grade held 62.4% share in 2026, while pharmaceutical grade is projected to expand at a 6.4% CAGR through 2033, supported by its classification among the lower-risk residual solvents in pharmacopoeial guidance on solvent limits.
- By Application: Paints, coatings and inks held 33.2% share in 2026, while food and flavour applications are projected to grow at a 5.9% CAGR through 2033, driven by authorised flavouring and extraction uses and by demand for naturally decaffeinated products.
- By Function: Solvent use held 78.5% share in 2026, while extraction medium use is projected to advance at a 5.8% CAGR through 2033, driven by botanical, nutraceutical and active ingredient isolation that favours a low-toxicity, easily stripped ester.
- By Geography: Asia Pacific held 58.0% share in 2026, while Middle East & Africa is projected to post a 5.6% CAGR through 2033, driven by Gulf acetyls integration and rising packaging conversion across African cities.
Global Ethyl Acetate Market Trends and Insights
Drivers Impact Analysis
| Driver | Impact on CAGR Forecast | Geographic Relevance | Impact Timeline |
| Flexible packaging lamination adhesive demand in converting economies | High | Asia Pacific, Latin America, Middle East & Africa | Long term (≥4 years) |
| Substitution of higher-hazard ketone and aromatic solvents in printing and pharmaceutical processing | High | Europe, North America, Asia Pacific | Medium term (2–4 years) |
Two forces account for most of the incremental volume this ester will absorb through 2033.
Flexible Packaging Lamination Keeps Ethyl Acetate Volumes Growing in Converting Economies
Lamination adhesives for flexible packaging are the most defensible outlet this solvent has, and the volume keeps climbing. Solvent-based polyurethane adhesives used to bond printed film to foil or sealant layers rely on the ester as their carrier because it dissolves the polyol and isocyanate components, wets film evenly and flashes off cleanly in the drying tunnel. Every tonne of laminate produced therefore pulls a predictable quantity of solvent behind it.
The mechanism is packaging format change rather than population growth. Food, snack, pet food and personal care products continue shifting from rigid containers into multilayer flexible structures, which cut shipped weight and extend shelf life. Converting capacity has been added fastest in India, Indonesia, Vietnam and Türkiye, where printing and laminating lines sit close to food processors. Food contact rules govern which adhesives may be used, and the ester’s authorisation record is part of why it remains the default carrier.
Lower-Hazard Classification Makes Ethyl Acetate the Acceptable Solvent in Printing and Pharmaceuticals
This ester is winning share from more hazardous solvents even where total solvent consumption is static. Printing inks, pharmaceutical crystallisation, chromatography and natural product extraction have all moved away from methyl ethyl ketone, toluene, methanol and chlorinated solvents. The replacement usually has to dissolve similar resins, boil in a convenient range and leave no troublesome residue, and the acetate ester meets those conditions while carrying a lighter regulatory burden than the materials it displaces.
The causal mechanism is classification, not marketing. Under pharmacopoeial residual solvent guidance the ester sits in the lower-risk class, which allows higher permitted residues and lighter analytical control in a finished drug substance. It is registered under REACH, authorised as a flavouring substance and as an extraction solvent in the European Union, and permitted in food applications under FDA rules. Some reactivity-based programmes of the California Air Resources Board also treat it more favourably than alternative solvents.
Restraints Impact Analysis
| Restraint | Impact on CAGR Forecast | Geographic Relevance | Impact Timeline |
| Ethanol and acetic acid feedstock volatility combined with regional overcapacity | High | Global | Short term (≤2 years) |
| Waterborne and solventless substitution plus solvent emission compliance cost | Medium | Europe, North America, Asia Pacific | Long term (≥4 years) |
Two structural pressures sit on producer margins and on total solvent volume at the same time.
Feedstock Price Swings and Regional Overcapacity Compress Ethyl Acetate Margins
Margin in this business is decided by two purchased inputs and by how much idle capacity sits nearby. Ethanol and acetic acid together account for the large majority of cash cost, so a producer converts a volatile spread rather than selling a differentiated product. When either input moves sharply within a quarter, contracts written on quarterly or annual pricing cannot absorb the change, and the conversion margin disappears before it can be repriced.
Overcapacity makes that worse. Nameplate capacity is concentrated in a few countries, and plants built to serve domestic acetyls chains export surplus volume when local demand softens. Those cargoes set the marginal price in importing regions and cap what any producer can charge. Ethanol pricing is itself tied to sugar and grain markets, to fuel blending mandates and to crop years. Anti-dumping measures have been applied to traded volumes in some jurisdictions.
Waterborne Substitution and Solvent Emission Rules Limit Ethyl Acetate Volume Growth
Total solvent demand is the ceiling on this market, and that ceiling is slowly coming down. Waterborne coating systems have already taken most architectural paint volume, and solventless and water-based laminating adhesives continue to win share in simple two-ply structures where performance demands are modest. The ester holds its ground in demanding laminates and in printing, but it is gaining share inside a pool that is flat to shrinking rather than riding an expanding one.
The underlying cause is the cost of emitting or recovering any solvent. Solvent emission provisions within the EU Industrial Emissions Directive require operators above threshold consumption to meet emission limits or run a solvent management plan, which means thermal oxidisers, carbon beds or distillation units with their own capital and energy cost. Volatile organic compound limits under European rules and US Environmental Protection Agency programmes add to that. Avoiding solvent entirely removes a permit obligation.
Market Opportunities
Bio-Attributed and Mass-Balance Certified Grades Create a Premium Ethyl Acetate Pool
Certified renewable-carbon grades are the clearest new revenue pool in this market, and they carry a genuine premium over commodity material. Because the standard synthesis route starts from ethanol, a producer sourcing fermentation ethanol from sugarcane, maize or cassava can offer bio-attributed or fully bio-based product without rebuilding the plant. That is a structural advantage this ester holds over solvents whose carbon chain can only come from a steam cracker.
Brand owners in food, personal care and pharmaceutical packaging create the demand, because renewable content in a converting input feeds directly into their own product carbon footprints. Mass-balance certification schemes let a producer allocate certified feedstock across a shared asset and sell an audited claim. Producers in Brazil and India, where distillery ethanol is abundant and already sold into fuel blending, are best placed to capture it, and buyers increasingly ask for the certificate alongside the specification sheet.
Solvent Recovery and Recycled Ethyl Acetate Services Open a Second Revenue Line
Recovery and redistillation of used solvent is becoming a business in its own right rather than a cost centre inside a converting plant. A flexible packaging laminator or pharmaceutical manufacturer that must install abatement anyway can instead condense and redistil the vapour, returning specification-grade material to the line. The service provider earns on tolling, on the recovered volume and on the disposal avoided, which turns a compliance obligation into a margin pool.
Converters, contract manufacturers and fine chemical plants supply the demand, because recovered solvent lowers the effective cost of use at exactly the moment emission rules raise it. Solvent management plan obligations under European permitting, and equivalent recovery expectations elsewhere, give the economics a regulatory floor. Pharmaceutical users need documented purity and genotoxic impurity control before recycled material enters a validated process, so the qualified recovery segment commands better pricing than general industrial reclaim.
Segment Analysis
By Production Route: Esterification Leads While Fermentation-Based Grades Scale Fastest
Esterification of ethanol with acetic acid held 48.5% of output in 2026, the dominant route because it uses two widely traded inputs, runs on well-understood reactive distillation equipment and can be built at modest scale close to demand. Tishchenko condensation of acetaldehyde followed at 27.0%, favoured where an existing acetaldehyde chain is already in place, while direct addition of ethylene to acetic acid accounted for 19.5% in integrated acetyls complexes.
Bio-based material made from fermentation ethanol holds 5.0% share but grows fastest at a 7.8% CAGR through 2033. The route is chemically identical to conventional esterification, so the differentiator is certified feedstock rather than new technology. Sugarcane and grain distillery ethanol makes renewable carbon straightforward in Brazil, India and Thailand. The business implication is that feedstock sourcing and certification capability, not reactor design, now separate producers at the premium end.
By Grade: Industrial Grade Dominates Volume as Pharmaceutical Grade Gains Value
Industrial and technical grade accounted for 62.4% of consumption in 2026, because coatings, inks, adhesives and general cleaning tolerate standard purity and buy on price per tonne. Food and flavour grade took 11.2%, cosmetic grade 7.3% and high-purity electronic grade 4.5%, the last used in photoresist stripping and component cleaning where metal ion and water content specifications are tight.
Pharmaceutical grade held 14.6% share and expands fastest at a 6.4% CAGR through 2033. Growth rests on the ester’s position among the lower-risk residual solvents under ICH Q3C, which permits comparatively high residual limits and reduces the analytical burden in release testing. Supplying this grade requires documented impurity profiles, Good Manufacturing Practice aligned quality systems and regulatory support files. The implication is that grade qualification, rather than tonnage, is where producers build defensible customer relationships.
By Application: Coatings and Inks Hold the Base While Food and Flavour Uses Accelerate
Paints, coatings and inks consumed 33.2% of volume in 2026, the single largest outlet, because flexographic and gravure printing inks and many industrial coatings depend on a fast-evaporating ester that redissolves dried resin on press. Flexible packaging lamination adhesives followed at 21.4%, pharmaceutical and fine chemical process use at 13.8%, pressure-sensitive and industrial adhesives at 12.6%, cosmetics and personal care at 7.1% and agrochemical formulation at 6.4%.
Food and flavour applications hold 5.5% share and grow fastest at a 5.9% CAGR through 2033. The ester is an authorised flavouring substance in the European Union and an approved extraction solvent, used in natural decaffeination of coffee and tea and in isolating flavour and fragrance fractions. Clean-label positioning favours an extraction route that leaves a permitted, readily stripped residue. The implication is that food-sector qualification carries documentation costs that commodity suppliers rarely absorb.
By Function: Solvent Duty Carries the Market While Extraction Use Grows Quickest
Solvent duty represented 78.5% of consumption in 2026, far ahead of every other function, because dissolving resins, thinning inks and carrying adhesive systems is what the molecule is bought for. Chemical intermediate use took 9.8%, where the ester feeds acetoacetate and specialty ester chemistry, and cleaning and surface preparation accounted for 4.3%, covering electronics degreasing, nail care removers and equipment wash-up in printing and coating plants.
Extraction medium use holds 7.4% share and advances fastest at a 5.8% CAGR through 2033. Antibiotic recovery, botanical and nutraceutical isolation, cannabinoid processing where permitted, and flavour fraction separation all favour a solvent with moderate polarity, low water miscibility and an easy boiling point for stripping. Regulatory acceptance in food and pharmaceutical extraction is the enabling factor. For producers, the implication is that extraction customers buy on documented purity and supply continuity rather than price.
Geography Analysis
North America Trades Coatings Volume for Pharmaceutical and Specialty Solvent Demand
North America accounted for 14.0% of global consumption in 2026 and grows at 2.6% a year to 2033, the slowest regional rate. The United States dominates, with Canada and Mexico adding converting and formulation demand. Printing ink and industrial coating volumes here are mature, and waterborne systems already hold most of the architectural market, so incremental growth comes from pharmaceutical manufacturing, fine chemical synthesis and specialty adhesives rather than from tonnage applications.
Regulation shapes the mix more than the total. US Environmental Protection Agency volatile organic compound programmes and California Air Resources Board rules set the baseline that state agencies tighten, and reactivity-based limits in some product categories treat this ester more favourably than alternatives. The clearest change is demand for recovered and redistilled material, as converters that must install abatement find recovery economics attractive at current energy and disposal costs.
Europe’s Solvent Management Rules Define How Ethyl Acetate Is Used
Europe held 15.5% share in 2026 and grows at 2.4% through 2033, the lowest rate of the five regions, because solvent-reduction policy has been in force longest here. Germany, Italy, France, Spain, Poland and Türkiye account for most consumption, supported by a dense flexible packaging converting base and by pharmaceutical fine chemical manufacturing. Consumption per converted tonne keeps falling as recovery systems are retrofitted.
Compliance capability is now a competitive asset. REACH registration, harmonised classification and labelling, solvent emission provisions within the Industrial Emissions Directive and national solvent management plan requirements all land on the same users, and the documentation burden favours established suppliers. The barrier is energy cost relative to other producing regions, which weakens commodity economics. The opportunity sits in mass-balance certified renewable-carbon grades, which European brand owners and converters are willing to pay a premium to specify.
Which Region Is Leading the Ethyl Acetate Market?
Asia Pacific is leading the ethyl acetate market, with 58.0% share in 2026 and a 4.8% CAGR to 2033, the largest absolute gain of any region. China is both the biggest producer and the biggest consumer, with India, Japan, Indonesia, Vietnam and Thailand adding substantial volume. Scale comes from three things at once: the world’s largest flexible packaging converting base, a deep printing ink industry, and pharmaceutical and agrochemical manufacturing concentrated in the same countries.
Supply economics reinforce the position. Domestic acetic acid and ethanol chains let regional producers run at costs importers cannot match, and surplus capacity is exported into neighbouring markets. India is the growth engine within the region, where distillery ethanol supply and rising packaged food consumption support both conventional and bio-attributed output. The change to watch is tightening national volatile organic compound enforcement in China, which is pushing converters toward recovery rather than away from solvent use.
Latin America Turns Sugarcane Ethanol Into Regional Ethyl Acetate Supply
Latin America held 6.5% share in 2026 and grows at 4.2% to 2033, ahead of the mature regions. Brazil and Mexico account for most consumption and nearly all production, with Argentina, Colombia and Chile contributing converting demand. The region’s distinctive feature is feedstock: abundant sugarcane ethanol gives local producers a renewable-carbon position that is difficult to replicate where ethanol must be imported or made from synthesis gas.
The barriers are familiar ones. Currency volatility makes dollar-denominated acetic acid purchases unpredictable, inland logistics raise delivered cost away from port cities, and enforcement of emission rules varies between national jurisdictions. Agrochemical formulation and flexible packaging for processed food are the main demand anchors. The opportunity is export of certified bio-attributed material to buyers in higher-income markets who will pay for audited renewable content.
Which Region Is Growing Fastest in the Ethyl Acetate Market?
Middle East & Africa is growing fastest in the ethyl acetate market, at a 5.6% CAGR through 2033 from a 6.0% share in 2026, the smallest base of the five regions. Saudi Arabia, the United Arab Emirates, Egypt, Nigeria, Morocco and South Africa drive most of the increase. Gulf acetyls integration gives producers access to competitively priced acetic acid, while packaging conversion and paint manufacturing expand with urban population growth.
Two causes explain the pace. Packaged food penetration across African cities is rising quickly, and each shift from loose or rigid packaging to printed laminate adds solvent demand per unit sold. Separately, regional petrochemical investment has added downstream derivative capacity aimed at export as well as local use. Barriers are real: fragmented distribution, limited solvent recovery infrastructure and inconsistent product standards slow premium grade adoption. The change underway is local formulation of inks and adhesives nearer to converters.
Competitive Landscape
The ethyl acetate market has low concentration and a long producer tail. Dozens of plants operate worldwide, a large share of them in China, and no producer holds a commanding global position. The molecule is a commodity with published specifications, several viable synthesis routes and modest minimum economic scale, so barriers to entry are low wherever ethanol or acetaldehyde is available. Integrated acetyls producers compete alongside independent esterification plants and alcohol-chemical companies attached to distilleries, which is why regional price formation often matters more than global share.
Competition runs on four things. Feedstock position decides who survives a spread compression, since ethanol and acetic acid dominate cash cost and integration into either gives a durable advantage. Logistics reach matters because the product is a bulk liquid with hazard classification, so delivery radius and terminal access shape realistic customer lists. Grade qualification is the main non-price differentiator: pharmaceutical, food, flavour and electronic customers audit suppliers and requalify slowly, which creates switching cost that industrial grade never generates. Certified renewable content has recently become a fourth axis, with mass-balance documentation appearing in tender requirements.
Strategic activity concentrates on moving away from pure commodity exposure. Producers attached to distilleries have pushed toward bio-attributed grades, where feedstock origin is the product. Integrated chemical companies have emphasised pharmaceutical and electronic purity lines supported by regulatory documentation. Several have added recovery and redistillation services rather than new primary capacity, because tolling recovered solvent for converters uses existing distillation assets at better margin than exporting surplus commodity volume.
The broad strategic direction is consistent across the field. Producers are trying to convert a volatile conversion spread into positions where certification, documentation and proximity create switching cost that a cargo of imported commodity material cannot overcome.
Ethyl Acetate Industry Leaders
- Celanese Corporation
- Eastman Chemical Company
- Jubilant Ingrevia Limited
- Laxmi Organic Industries Ltd.
- Daicel Corporation
Recent Industry Developments
- July 1997: The International Council for Harmonisation adopted its guideline on residual solvents in pharmaceuticals, placing ethyl acetate in the lower-risk class of solvents – it allowed comparatively generous residual limits and made the ester an easier choice than alternatives in active ingredient manufacture.
- June 2007: The European Union’s REACH regulation entered into force, requiring registration and hazard data for substances manufactured or imported above volume thresholds – it raised the fixed compliance cost of supplying the European market and favoured producers able to maintain full registration dossiers.
- January 2011: The EU Industrial Emissions Directive entered into force, absorbing the former solvent emissions provisions into a single permitting regime with emission limits and solvent management plan obligations – it raised the cost of using any organic solvent and accelerated investment in recovery equipment.
- April 2013: The European Union’s Union list of authorised flavouring substances became applicable, confirming ethyl acetate as an authorised flavouring substance for food use – it secured the regulatory basis for food and flavour grade demand alongside the ester’s established status as a permitted extraction solvent.
Companies Covered in the Report
- Celanese Corporation
- Eastman Chemical Company
- Sasol Limited
- Daicel Corporation
- Resonac Holdings Corporation
- Jubilant Ingrevia Limited
- Laxmi Organic Industries Ltd.
- IOL Chemicals and Pharmaceuticals Limited
- Godavari Biorefineries Limited
- Ashok Alco-chem Limited
- Jiangsu Sopo (Group) Co., Ltd.
- Saudi International Petrochemical Company
- Merck KGaA
Ethyl Acetate Market Report Scope
This report covers ethyl acetate supplied as a solvent and as a chemical intermediate, analysed by production route, grade, application and function. Bio-attributed and fully bio-based material made from fermentation ethanol is included. Other acetate esters, formulated solvent blends and captive material never sold commercially are excluded. The base year is 2025, the forecast period runs from 2026 to 2033, and all values are expressed in US$ Billion.
Production Route
- Esterification of Ethanol and Acetic Acid
- Tishchenko Condensation of Acetaldehyde
- Direct Addition of Ethylene to Acetic Acid
- Bio-based Route from Fermentation Ethanol
Grade
- Industrial and Technical Grade
- Pharmaceutical Grade
- Food and Flavour Grade
- Cosmetic Grade
- High-Purity Electronic Grade
Application
- Paints, Coatings and Inks
- Flexible Packaging Lamination Adhesives
- Pressure-Sensitive and Industrial Adhesives
- Pharmaceutical and Fine Chemical Process Solvent
- Cosmetics and Personal Care
- Agrochemical Formulation
- Food and Flavour Applications
Function
- Solvent
- Chemical Intermediate
- Extraction Medium
- Cleaning and Surface Preparation
Regions
- North America
- Europe
- Asia Pacific
- Latin America
- Middle East & Africa
Key Questions Answered in the Report
How big is the ethyl acetate market in 2026?
The global ethyl acetate market is valued at US$ 4.6 billion in 2026, covering solvent and intermediate use across all grades and all five standard regions.
What is the forecast size and CAGR of the ethyl acetate market by 2033?
The market is projected to reach US$ 6.1 billion by 2033, growing at a 4.1% CAGR and adding an absolute opportunity of US$ 1.5 billion.
Which application leads the ethyl acetate market?
Paints, coatings and inks lead with 33.2% share in 2026, because flexographic and gravure printing inks depend on a fast-evaporating ester that redissolves dried resin.
Which segment and region are growing fastest in the ethyl acetate market?
Bio-based material from fermentation ethanol grows fastest at 7.8%, and Middle East & Africa is the fastest region at a 5.6% CAGR through 2033.
Which region holds the largest ethyl acetate market share?
Asia Pacific holds the largest share at 58.0% in 2026, supported by its flexible packaging converting base, printing ink industry and integrated acetyls capacity.
1. Executive Summary
1.1. Global Ethyl Acetate Market Snapshot
1.2. Future Projections
1.3. Key Report Takeaways
1.4. Regional Snapshot
2. Market Overview
2.1. Market Definition and Report Scope
2.2. Historical Trends 2020–2025
2.3. Market Dynamics
2.3.1. Drivers
2.3.1.1. Flexible Packaging Lamination Keeps Ethyl Acetate Volumes Growing in Converting Economies
2.3.1.2. Lower-Hazard Classification Makes Ethyl Acetate the Acceptable Solvent in Printing and Pharmaceuticals
2.3.2. Restraints
2.3.2.1. Feedstock Price Swings and Regional Overcapacity Compress Ethyl Acetate Margins
2.3.2.2. Waterborne Substitution and Solvent Emission Rules Limit Ethyl Acetate Volume Growth
2.3.3. Market Opportunities
2.3.3.1. Bio-Attributed and Mass-Balance Certified Grades Create a Premium Ethyl Acetate Pool
2.3.3.2. Solvent Recovery and Recycled Ethyl Acetate Services Open a Second Revenue Line
3. Global Ethyl Acetate Market Outlook, 2020–2033
3.1. Global Ethyl Acetate Market Outlook, by Production Route, Value (US$ Billion), 2020–2033
3.1.1. Esterification of Ethanol and Acetic Acid
3.1.2. Tishchenko Condensation of Acetaldehyde
3.1.3. Direct Addition of Ethylene to Acetic Acid
3.1.4. Bio-based Route from Fermentation Ethanol
3.2. Global Ethyl Acetate Market Outlook, by Grade, Value (US$ Billion), 2020–2033
3.2.1. Industrial and Technical Grade
3.2.2. Pharmaceutical Grade
3.2.3. Food and Flavour Grade
3.2.4. Cosmetic Grade
3.2.5. High-Purity Electronic Grade
3.3. Global Ethyl Acetate Market Outlook, by Application, Value (US$ Billion), 2020–2033
3.3.1. Paints, Coatings and Inks
3.3.2. Flexible Packaging Lamination Adhesives
3.3.3. Pressure-Sensitive and Industrial Adhesives
3.3.4. Pharmaceutical and Fine Chemical Process Solvent
3.3.5. Cosmetics and Personal Care
3.3.6. Agrochemical Formulation
3.3.7. Food and Flavour Applications
3.4. Global Ethyl Acetate Market Outlook, by Function, Value (US$ Billion), 2020–2033
3.4.1. Solvent
3.4.2. Chemical Intermediate
3.4.3. Extraction Medium
3.4.4. Cleaning and Surface Preparation
3.5. Global Ethyl Acetate Market Outlook, by Region, Value (US$ Billion), 2020–2033
3.5.1. North America
3.5.2. Europe
3.5.3. Asia Pacific
3.5.4. Latin America
3.5.5. Middle East & Africa
4. North America Ethyl Acetate Market Outlook, 2020–2033
4.1. North America Ethyl Acetate Market Outlook, by Production Route, Value (US$ Billion), 2020–2033
4.1.1. Esterification of Ethanol and Acetic Acid
4.1.2. Tishchenko Condensation of Acetaldehyde
4.1.3. Direct Addition of Ethylene to Acetic Acid
4.1.4. Bio-based Route from Fermentation Ethanol
4.2. North America Ethyl Acetate Market Outlook, by Grade, Value (US$ Billion), 2020–2033
4.2.1. Industrial and Technical Grade
4.2.2. Pharmaceutical Grade
4.2.3. Food and Flavour Grade
4.2.4. Cosmetic Grade
4.2.5. High-Purity Electronic Grade
4.3. North America Ethyl Acetate Market Outlook, by Application, Value (US$ Billion), 2020–2033
4.3.1. Paints, Coatings and Inks
4.3.2. Flexible Packaging Lamination Adhesives
4.3.3. Pressure-Sensitive and Industrial Adhesives
4.3.4. Pharmaceutical and Fine Chemical Process Solvent
4.3.5. Cosmetics and Personal Care
4.3.6. Agrochemical Formulation
4.3.7. Food and Flavour Applications
4.4. North America Ethyl Acetate Market Outlook, by Function, Value (US$ Billion), 2020–2033
4.4.1. Solvent
4.4.2. Chemical Intermediate
4.4.3. Extraction Medium
4.4.4. Cleaning and Surface Preparation
4.5. North America Ethyl Acetate Market Outlook, by Country, Value (US$ Billion), 2020–2033
4.5.1. United States Ethyl Acetate Market Outlook, by Production Route, 2020–2033
4.5.2. United States Ethyl Acetate Market Outlook, by Grade, 2020–2033
4.5.3. United States Ethyl Acetate Market Outlook, by Application, 2020–2033
4.5.4. United States Ethyl Acetate Market Outlook, by Function, 2020–2033
4.5.5. Canada Ethyl Acetate Market Outlook, by Production Route, 2020–2033
4.5.6. Canada Ethyl Acetate Market Outlook, by Grade, 2020–2033
4.5.7. Canada Ethyl Acetate Market Outlook, by Application, 2020–2033
4.5.8. Canada Ethyl Acetate Market Outlook, by Function, 2020–2033
4.5.9. Mexico Ethyl Acetate Market Outlook, by Production Route, 2020–2033
4.5.10. Mexico Ethyl Acetate Market Outlook, by Grade, 2020–2033
4.5.11. Mexico Ethyl Acetate Market Outlook, by Application, 2020–2033
4.5.12. Mexico Ethyl Acetate Market Outlook, by Function, 2020–2033
5. Europe Ethyl Acetate Market Outlook, 2020–2033
5.1. Europe Ethyl Acetate Market Outlook, by Production Route, Value (US$ Billion), 2020–2033
5.1.1. Esterification of Ethanol and Acetic Acid
5.1.2. Tishchenko Condensation of Acetaldehyde
5.1.3. Direct Addition of Ethylene to Acetic Acid
5.1.4. Bio-based Route from Fermentation Ethanol
5.2. Europe Ethyl Acetate Market Outlook, by Grade, Value (US$ Billion), 2020–2033
5.2.1. Industrial and Technical Grade
5.2.2. Pharmaceutical Grade
5.2.3. Food and Flavour Grade
5.2.4. Cosmetic Grade
5.2.5. High-Purity Electronic Grade
5.3. Europe Ethyl Acetate Market Outlook, by Application, Value (US$ Billion), 2020–2033
5.3.1. Paints, Coatings and Inks
5.3.2. Flexible Packaging Lamination Adhesives
5.3.3. Pressure-Sensitive and Industrial Adhesives
5.3.4. Pharmaceutical and Fine Chemical Process Solvent
5.3.5. Cosmetics and Personal Care
5.3.6. Agrochemical Formulation
5.3.7. Food and Flavour Applications
5.4. Europe Ethyl Acetate Market Outlook, by Function, Value (US$ Billion), 2020–2033
5.4.1. Solvent
5.4.2. Chemical Intermediate
5.4.3. Extraction Medium
5.4.4. Cleaning and Surface Preparation
5.5. Europe Ethyl Acetate Market Outlook, by Country, Value (US$ Billion), 2020–2033
5.5.1. Germany Ethyl Acetate Market Outlook, by Production Route, 2020–2033
5.5.2. Germany Ethyl Acetate Market Outlook, by Grade, 2020–2033
5.5.3. Germany Ethyl Acetate Market Outlook, by Application, 2020–2033
5.5.4. Germany Ethyl Acetate Market Outlook, by Function, 2020–2033
5.5.5. Italy Ethyl Acetate Market Outlook, by Production Route, 2020–2033
5.5.6. Italy Ethyl Acetate Market Outlook, by Grade, 2020–2033
5.5.7. Italy Ethyl Acetate Market Outlook, by Application, 2020–2033
5.5.8. Italy Ethyl Acetate Market Outlook, by Function, 2020–2033
5.5.9. France Ethyl Acetate Market Outlook, by Production Route, 2020–2033
5.5.10. France Ethyl Acetate Market Outlook, by Grade, 2020–2033
5.5.11. France Ethyl Acetate Market Outlook, by Application, 2020–2033
5.5.12. France Ethyl Acetate Market Outlook, by Function, 2020–2033
5.5.13. Spain Ethyl Acetate Market Outlook, by Production Route, 2020–2033
5.5.14. Spain Ethyl Acetate Market Outlook, by Grade, 2020–2033
5.5.15. Spain Ethyl Acetate Market Outlook, by Application, 2020–2033
5.5.16. Spain Ethyl Acetate Market Outlook, by Function, 2020–2033
5.5.17. Poland Ethyl Acetate Market Outlook, by Production Route, 2020–2033
5.5.18. Poland Ethyl Acetate Market Outlook, by Grade, 2020–2033
5.5.19. Poland Ethyl Acetate Market Outlook, by Application, 2020–2033
5.5.20. Poland Ethyl Acetate Market Outlook, by Function, 2020–2033
5.5.21. Türkiye Ethyl Acetate Market Outlook, by Production Route, 2020–2033
5.5.22. Türkiye Ethyl Acetate Market Outlook, by Grade, 2020–2033
5.5.23. Türkiye Ethyl Acetate Market Outlook, by Application, 2020–2033
5.5.24. Türkiye Ethyl Acetate Market Outlook, by Function, 2020–2033
6. Asia Pacific Ethyl Acetate Market Outlook, 2020–2033
6.1. Asia Pacific Ethyl Acetate Market Outlook, by Production Route, Value (US$ Billion), 2020–2033
6.1.1. Esterification of Ethanol and Acetic Acid
6.1.2. Tishchenko Condensation of Acetaldehyde
6.1.3. Direct Addition of Ethylene to Acetic Acid
6.1.4. Bio-based Route from Fermentation Ethanol
6.2. Asia Pacific Ethyl Acetate Market Outlook, by Grade, Value (US$ Billion), 2020–2033
6.2.1. Industrial and Technical Grade
6.2.2. Pharmaceutical Grade
6.2.3. Food and Flavour Grade
6.2.4. Cosmetic Grade
6.2.5. High-Purity Electronic Grade
6.3. Asia Pacific Ethyl Acetate Market Outlook, by Application, Value (US$ Billion), 2020–2033
6.3.1. Paints, Coatings and Inks
6.3.2. Flexible Packaging Lamination Adhesives
6.3.3. Pressure-Sensitive and Industrial Adhesives
6.3.4. Pharmaceutical and Fine Chemical Process Solvent
6.3.5. Cosmetics and Personal Care
6.3.6. Agrochemical Formulation
6.3.7. Food and Flavour Applications
6.4. Asia Pacific Ethyl Acetate Market Outlook, by Function, Value (US$ Billion), 2020–2033
6.4.1. Solvent
6.4.2. Chemical Intermediate
6.4.3. Extraction Medium
6.4.4. Cleaning and Surface Preparation
6.5. Asia Pacific Ethyl Acetate Market Outlook, by Country, Value (US$ Billion), 2020–2033
6.5.1. China Ethyl Acetate Market Outlook, by Production Route, 2020–2033
6.5.2. China Ethyl Acetate Market Outlook, by Grade, 2020–2033
6.5.3. China Ethyl Acetate Market Outlook, by Application, 2020–2033
6.5.4. China Ethyl Acetate Market Outlook, by Function, 2020–2033
6.5.5. India Ethyl Acetate Market Outlook, by Production Route, 2020–2033
6.5.6. India Ethyl Acetate Market Outlook, by Grade, 2020–2033
6.5.7. India Ethyl Acetate Market Outlook, by Application, 2020–2033
6.5.8. India Ethyl Acetate Market Outlook, by Function, 2020–2033
6.5.9. Japan Ethyl Acetate Market Outlook, by Production Route, 2020–2033
6.5.10. Japan Ethyl Acetate Market Outlook, by Grade, 2020–2033
6.5.11. Japan Ethyl Acetate Market Outlook, by Application, 2020–2033
6.5.12. Japan Ethyl Acetate Market Outlook, by Function, 2020–2033
6.5.13. Indonesia Ethyl Acetate Market Outlook, by Production Route, 2020–2033
6.5.14. Indonesia Ethyl Acetate Market Outlook, by Grade, 2020–2033
6.5.15. Indonesia Ethyl Acetate Market Outlook, by Application, 2020–2033
6.5.16. Indonesia Ethyl Acetate Market Outlook, by Function, 2020–2033
6.5.17. Vietnam Ethyl Acetate Market Outlook, by Production Route, 2020–2033
6.5.18. Vietnam Ethyl Acetate Market Outlook, by Grade, 2020–2033
6.5.19. Vietnam Ethyl Acetate Market Outlook, by Application, 2020–2033
6.5.20. Vietnam Ethyl Acetate Market Outlook, by Function, 2020–2033
6.5.21. Thailand Ethyl Acetate Market Outlook, by Production Route, 2020–2033
6.5.22. Thailand Ethyl Acetate Market Outlook, by Grade, 2020–2033
6.5.23. Thailand Ethyl Acetate Market Outlook, by Application, 2020–2033
6.5.24. Thailand Ethyl Acetate Market Outlook, by Function, 2020–2033
7. Latin America Ethyl Acetate Market Outlook, 2020–2033
7.1. Latin America Ethyl Acetate Market Outlook, by Production Route, Value (US$ Billion), 2020–2033
7.1.1. Esterification of Ethanol and Acetic Acid
7.1.2. Tishchenko Condensation of Acetaldehyde
7.1.3. Direct Addition of Ethylene to Acetic Acid
7.1.4. Bio-based Route from Fermentation Ethanol
7.2. Latin America Ethyl Acetate Market Outlook, by Grade, Value (US$ Billion), 2020–2033
7.2.1. Industrial and Technical Grade
7.2.2. Pharmaceutical Grade
7.2.3. Food and Flavour Grade
7.2.4. Cosmetic Grade
7.2.5. High-Purity Electronic Grade
7.3. Latin America Ethyl Acetate Market Outlook, by Application, Value (US$ Billion), 2020–2033
7.3.1. Paints, Coatings and Inks
7.3.2. Flexible Packaging Lamination Adhesives
7.3.3. Pressure-Sensitive and Industrial Adhesives
7.3.4. Pharmaceutical and Fine Chemical Process Solvent
7.3.5. Cosmetics and Personal Care
7.3.6. Agrochemical Formulation
7.3.7. Food and Flavour Applications
7.4. Latin America Ethyl Acetate Market Outlook, by Function, Value (US$ Billion), 2020–2033
7.4.1. Solvent
7.4.2. Chemical Intermediate
7.4.3. Extraction Medium
7.4.4. Cleaning and Surface Preparation
7.5. Latin America Ethyl Acetate Market Outlook, by Country, Value (US$ Billion), 2020–2033
7.5.1. Brazil Ethyl Acetate Market Outlook, by Production Route, 2020–2033
7.5.2. Brazil Ethyl Acetate Market Outlook, by Grade, 2020–2033
7.5.3. Brazil Ethyl Acetate Market Outlook, by Application, 2020–2033
7.5.4. Brazil Ethyl Acetate Market Outlook, by Function, 2020–2033
7.5.5. Mexico Ethyl Acetate Market Outlook, by Production Route, 2020–2033
7.5.6. Mexico Ethyl Acetate Market Outlook, by Grade, 2020–2033
7.5.7. Mexico Ethyl Acetate Market Outlook, by Application, 2020–2033
7.5.8. Mexico Ethyl Acetate Market Outlook, by Function, 2020–2033
7.5.9. Argentina Ethyl Acetate Market Outlook, by Production Route, 2020–2033
7.5.10. Argentina Ethyl Acetate Market Outlook, by Grade, 2020–2033
7.5.11. Argentina Ethyl Acetate Market Outlook, by Application, 2020–2033
7.5.12. Argentina Ethyl Acetate Market Outlook, by Function, 2020–2033
7.5.13. Colombia Ethyl Acetate Market Outlook, by Production Route, 2020–2033
7.5.14. Colombia Ethyl Acetate Market Outlook, by Grade, 2020–2033
7.5.15. Colombia Ethyl Acetate Market Outlook, by Application, 2020–2033
7.5.16. Colombia Ethyl Acetate Market Outlook, by Function, 2020–2033
7.5.17. Chile Ethyl Acetate Market Outlook, by Production Route, 2020–2033
7.5.18. Chile Ethyl Acetate Market Outlook, by Grade, 2020–2033
7.5.19. Chile Ethyl Acetate Market Outlook, by Application, 2020–2033
7.5.20. Chile Ethyl Acetate Market Outlook, by Function, 2020–2033
8. Middle East & Africa Ethyl Acetate Market Outlook, 2020–2033
8.1. Middle East & Africa Ethyl Acetate Market Outlook, by Production Route, Value (US$ Billion), 2020–2033
8.1.1. Esterification of Ethanol and Acetic Acid
8.1.2. Tishchenko Condensation of Acetaldehyde
8.1.3. Direct Addition of Ethylene to Acetic Acid
8.1.4. Bio-based Route from Fermentation Ethanol
8.2. Middle East & Africa Ethyl Acetate Market Outlook, by Grade, Value (US$ Billion), 2020–2033
8.2.1. Industrial and Technical Grade
8.2.2. Pharmaceutical Grade
8.2.3. Food and Flavour Grade
8.2.4. Cosmetic Grade
8.2.5. High-Purity Electronic Grade
8.3. Middle East & Africa Ethyl Acetate Market Outlook, by Application, Value (US$ Billion), 2020–2033
8.3.1. Paints, Coatings and Inks
8.3.2. Flexible Packaging Lamination Adhesives
8.3.3. Pressure-Sensitive and Industrial Adhesives
8.3.4. Pharmaceutical and Fine Chemical Process Solvent
8.3.5. Cosmetics and Personal Care
8.3.6. Agrochemical Formulation
8.3.7. Food and Flavour Applications
8.4. Middle East & Africa Ethyl Acetate Market Outlook, by Function, Value (US$ Billion), 2020–2033
8.4.1. Solvent
8.4.2. Chemical Intermediate
8.4.3. Extraction Medium
8.4.4. Cleaning and Surface Preparation
8.5. Middle East & Africa Ethyl Acetate Market Outlook, by Country, Value (US$ Billion), 2020–2033
8.5.1. Saudi Arabia Ethyl Acetate Market Outlook, by Production Route, 2020–2033
8.5.2. Saudi Arabia Ethyl Acetate Market Outlook, by Grade, 2020–2033
8.5.3. Saudi Arabia Ethyl Acetate Market Outlook, by Application, 2020–2033
8.5.4. Saudi Arabia Ethyl Acetate Market Outlook, by Function, 2020–2033
8.5.5. United Arab Emirates Ethyl Acetate Market Outlook, by Production Route, 2020–2033
8.5.6. United Arab Emirates Ethyl Acetate Market Outlook, by Grade, 2020–2033
8.5.7. United Arab Emirates Ethyl Acetate Market Outlook, by Application, 2020–2033
8.5.8. United Arab Emirates Ethyl Acetate Market Outlook, by Function, 2020–2033
8.5.9. Egypt Ethyl Acetate Market Outlook, by Production Route, 2020–2033
8.5.10. Egypt Ethyl Acetate Market Outlook, by Grade, 2020–2033
8.5.11. Egypt Ethyl Acetate Market Outlook, by Application, 2020–2033
8.5.12. Egypt Ethyl Acetate Market Outlook, by Function, 2020–2033
8.5.13. Nigeria Ethyl Acetate Market Outlook, by Production Route, 2020–2033
8.5.14. Nigeria Ethyl Acetate Market Outlook, by Grade, 2020–2033
8.5.15. Nigeria Ethyl Acetate Market Outlook, by Application, 2020–2033
8.5.16. Nigeria Ethyl Acetate Market Outlook, by Function, 2020–2033
8.5.17. Morocco Ethyl Acetate Market Outlook, by Production Route, 2020–2033
8.5.18. Morocco Ethyl Acetate Market Outlook, by Grade, 2020–2033
8.5.19. Morocco Ethyl Acetate Market Outlook, by Application, 2020–2033
8.5.20. Morocco Ethyl Acetate Market Outlook, by Function, 2020–2033
8.5.21. South Africa Ethyl Acetate Market Outlook, by Production Route, 2020–2033
8.5.22. South Africa Ethyl Acetate Market Outlook, by Grade, 2020–2033
8.5.23. South Africa Ethyl Acetate Market Outlook, by Application, 2020–2033
8.5.24. South Africa Ethyl Acetate Market Outlook, by Function, 2020–2033
9. Competitive Landscape
9.1. Market Concentration and Industry Leaders
9.2. Competitive Differentiation
9.3. Strategic Moves and Market Direction
9.4. Recent Industry Developments
9.5. Company Profiles
9.5.1. Celanese Corporation
9.5.2. Eastman Chemical Company
9.5.3. Sasol Limited
9.5.4. Daicel Corporation
9.5.5. Resonac Holdings Corporation
9.5.6. Jubilant Ingrevia Limited
9.5.7. Laxmi Organic Industries Ltd.
9.5.8. IOL Chemicals and Pharmaceuticals Limited
9.5.9. Godavari Biorefineries Limited
9.5.10. Ashok Alco-chem Limited
9.5.11. Jiangsu Sopo (Group) Co., Ltd.
9.5.12. Saudi International Petrochemical Company
9.5.13. Merck KGaA
10. Appendix
10.1. Research Methodology
10.2. Report Assumptions
10.3. Acronyms and Abbreviations
| Production Route | Esterification of Ethanol and Acetic Acid, Tishchenko Condensation of Acetaldehyde, Direct Addition of Ethylene to Acetic Acid, Bio-based Route from Fermentation Ethanol |
| Grade | Industrial and Technical Grade, Pharmaceutical Grade, Food and Flavour Grade, Cosmetic Grade, High-Purity Electronic Grade |
| Application | Paints, Coatings and Inks, Flexible Packaging Lamination Adhesives, Pressure-Sensitive and Industrial Adhesives, Pharmaceutical and Fine Chemical Process Solvent, Cosmetics and Personal Care, Agrochemical Formulation, Food and Flavour Applications |
| Function | Solvent, Chemical Intermediate, Extraction Medium, Cleaning and Surface Preparation |
| Regions | North America, Europe, Asia Pacific, Latin America, Middle East & Africa |
Our Research Methodology
Considering the volatility of business today, traditional approaches to strategizing a game plan can be unfruitful if not detrimental. True ambiguity is no way to determine a forecast. A myriad of predetermined factors must be accounted for such as the degree of risk involved, the magnitude of circumstances, as well as conditions or consequences that are not known or unpredictable. To circumvent binary views that cast uncertainty, the application of market research intelligence to strategically posture, move, and enable actionable outcomes is necessary.
View Methodology
Quality Assured
Rigorous Validation Process

Confidentiality Assured
End-to-end Data Security

Custom Research Services
Tailored To Your Objectives
FAQs
The global ethyl acetate market is valued at US$ 4.6 billion in 2026, covering solvent and intermediate use across all grades and all five standard regions.
The market is projected to reach US$ 6.1 billion by 2033, growing at a 4.1% CAGR and adding an absolute opportunity of US$ 1.5 billion.
Paints, coatings and inks lead with 33.2% share in 2026, because flexographic and gravure printing inks depend on a fast-evaporating ester that redissolves dried resin.
Bio-based material from fermentation ethanol grows fastest at 7.8%, and Middle East & Africa is the fastest region at a 5.6% CAGR through 2033.
Asia Pacific holds the largest share at 58.0% in 2026, supported by its flexible packaging converting base, printing ink industry and integrated acetyls capacity.
Related Reports
Rigid Bulk Packaging Market Size, Share, Insights, Competitive Landscape, and Forecast 2026 to 2033
The global rigid bulk packaging market is valued at US$68.5 billion in 2026, reaching US$96.4 billion by 2033, growing at a 5.0% CAGR
Probiotics Packaging Market Size, Share, Insights, Competitive Landscape, and Forecast 2026 to 2033
Explore the probiotics packaging market, valued at US$ 1.4 billion in 2026 and projected to reach US$ 2.4 billion by 2033, growing at an 8.0% CAGR.
Epoxy Composites Market Size, Share, Insights, Competitive Landscape, and Forecast 2026 to 2033
Explore the epoxy composites market, projected to reach US$ 22.3 billion by 2033 at a 6.7% CAGR, with resin, reinforcement and regional insights.
Advanced Materials Market Size, Share, Insights, Competitive Landscape, and Forecast 2026 to 2033
Explore the advanced materials market, projected to reach US$ 121.08 billion by 2033 at a 6.6% CAGR, with product, application and regional insights.
Biopolymer Coatings Market Size, Share, Insights, Competitive Landscape, and Forecast 2026 to 2033
Explore the biopolymer coatings market, projected to reach US$ 2.5 billion by 2033 at a 7.6% CAGR, with product, technology and regional insights.
Dry Construction Market Size, Share, Insights, Competitive Landscape, and Forecast 2026 to 2033
Explore the dry construction market, projected to reach US$ 134.87 billion by 2033 at a 4.7% CAGR, with material, system and regional insights.