



Foldable Electric Scooter Market
Foldable Electric Scooter Market Size, Share, Insights, Competitive Landscape, and Forecast 2026 to 2033
Foldable Electric Scooter Market Size and Trend Analysis
How Fast Will the Foldable Electric Scooter Market Grow?
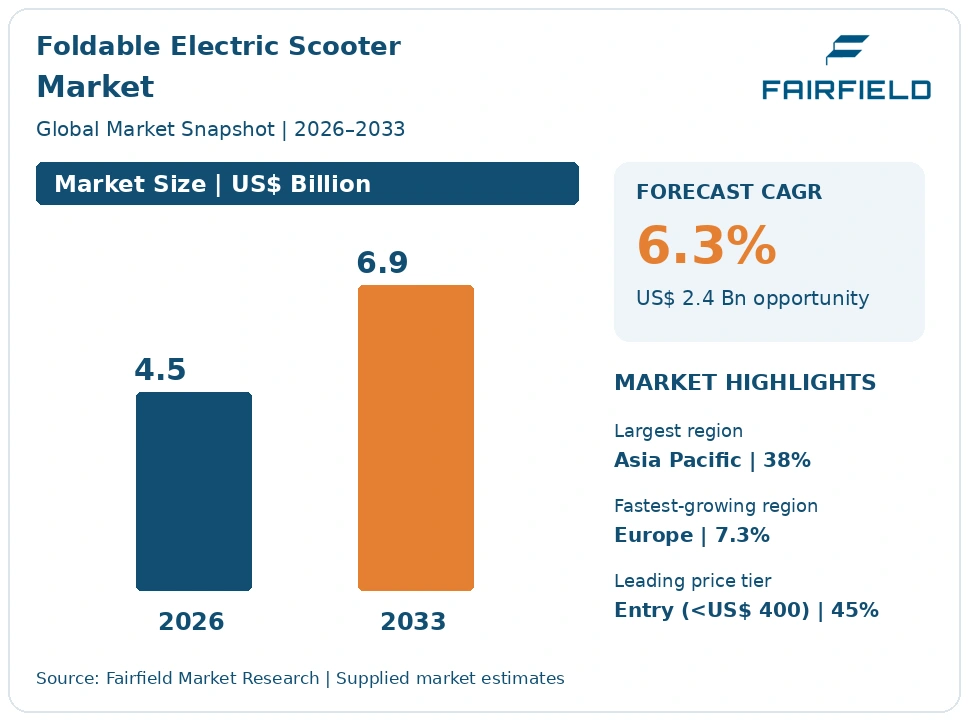
The global Foldable Electric Scooter market size is expected to be valued at US$ 4.5 billion in 2026 and projected to reach US$ 6.9 billion by 2033, growing at a CAGR of 6.3% between 2026 and 2033.
Growth has slowed from the 2020–2025 period, when the category expanded at roughly 9.8% a year on the back of rental fleet buying and first-time consumer purchases. Three factors now set the pace. Commuter use in cities with defined light-vehicle rules keeps replacement demand steady, certified higher-specification models lift average selling prices, and shared-fleet operators buy to replace worn vehicles rather than to seize new cities. Working against these, fire-safety rules on lithium-ion batteries have narrowed retail distribution and raised compliance costs. The direction is a slower, more regulated hardware market where value growth outpaces unit growth and where portability, certification and serviceability decide which brands keep shelf space.
Key Report Takeaways
- By Range Band, the 25–40 km band held 34% share in 2026, while the Above 60 km band is projected to expand at an 8.9% CAGR through 2033, as commuters replace first-generation scooters with models that survive a full week of trips.
- By Motor Power, the Up to 350 W class held 38% share in 2026, while the 501–750 W class is projected to grow at an 8.2% CAGR through 2033, driven by hill-climbing needs and heavier riders in commuter use.
- By Price Tier, the Entry tier below US$ 400 held 45% share in 2026, while the Premium tier above US$ 800 is projected to advance at an 8.4% CAGR through 2033, as certified brakes, lighting and battery packs become purchase conditions.
- By Distribution Channel, Online Retail held 52% share in 2026, while Specialty Retail and Service Dealers are projected to grow at a 7.9% CAGR through 2033, because repairs, battery replacement and warranty handling need a physical counter.
- By End Use, Personal Commuting held 61% share in 2026, while Commercial Last-Mile Delivery is projected to expand at an 8.6% CAGR through 2033, supported by courier work in dense city centres with restricted vehicle access.
- By geography, Asia Pacific held 38% share in 2026, while Europe is projected to grow fastest at a 7.3% CAGR through 2033, helped by national rules that give personal light electric vehicles a clear legal category.
Global Foldable Electric Scooter Market Trends and Insights
Drivers Impact Analysis
The two drivers below shape the pace of folding-frame scooter adoption through the forecast period.
| Driver | Impact on CAGR Forecast | Geographic Relevance | Impact Timeline |
| Clear legal categories for personal light electric vehicles | High | Europe, Asia Pacific, parts of North America | Medium term (2–4 years) |
| Portability advantage of folding frames in multimodal travel | Medium | Global, strongest in dense rail cities | Short term (≤2 years) |
Clear Light-Vehicle Rules Are Turning Folding Scooters Into Daily Commuter Hardware
Legal clarity converts folding scooters from novelty purchases into repeat commuter purchases. Where a city or country sets a speed ceiling, an age limit and a defined place to ride, retailers can stock confidently and buyers can plan a daily trip around the product. That certainty raises second-unit purchases within households, shortens replacement cycles and pushes buyers toward dearer models, because the scooter becomes transport rather than a weekend toy that sits in a hallway.
The mechanism is administrative rather than technical. National rules in France, Germany, Italy and Spain cap assisted speed at about 25 km/h and define where personal light electric vehicles may travel, while the European standard EN 17128 gives manufacturers a shared reference for brakes, frames and electrical systems. Rail operators that allow a folded scooter on board widen each station catchment, which is why commuter demand concentrates where short first-mile gaps meet dense networks.
Folding Portability Keeps This Category Ahead of Fixed-Frame Micromobility Products
Portability, not performance, remains the main purchase criterion in this category. Buyers compare folded dimensions, carry weight and how quickly the stem latches before they compare motor output. A scooter that fits under a desk, in a car boot or beside a train seat removes the two problems that stop people buying fixed-frame machines: secure parking and theft. That single attribute keeps folding models priced above comparable rigid designs and sustains demand among apartment dwellers.
The underlying cause is housing and parking, not transport policy. Dense cities offer little secure outdoor storage, and insurers and building managers increasingly discourage leaving powered vehicles in shared areas. Manufacturers respond with single-latch folding stems, carry handles and target weights near 12 kg to 18 kg, using magnesium and aluminium castings. Because this is a consumer electronics design problem, model cycles run short and feature changes arrive faster than they do in conventional vehicle programmes.
Restraints Impact Analysis
The two restraints below limit distribution, legal use and the size of the addressable base.
| Restraint | Impact on CAGR Forecast | Geographic Relevance | Impact Timeline |
| Lithium-ion battery fire risk and resulting certification and building rules | High | North America, Europe, Asia Pacific | Short term (≤2 years) |
| Inconsistent road-use law for privately owned scooters | High | Europe, North America, Latin America | Long term (≥4 years) |
Battery Fires in Residential Buildings Have Made Certification the Gate to Retail Shelves
Lithium-ion fires in apartment buildings have turned this product into a fire-safety and insurance question, and that now decides distribution. Large retailers and online marketplaces ask for UL 2272 listing for the electrical drive train and battery system, and several apply the related UL 2849 policy to light electric vehicle listings. Uncertified low-price imports lose shelf space. Landlords, insurers and building managers restrict indoor charging and storage, and some cities limit where devices may be kept.
The cause sits in cell quality, pack design and charging practice rather than in the vehicle itself. Thermal runaway typically follows damaged cells, poor welds, mismatched chargers or repaired packs with mixed-age cells. Certification adds cell sourcing, pack testing and documentation cost, and UN 38.3 transport testing adds further expense before a pack can ship. Local fire codes covering charging in corridors and stairwells then limit the practical rider base in multi-storey housing.
Inconsistent Road-Use Law Caps the Addressable Base for Privately Owned Scooters
Legal status remains genuinely inconsistent, and that caps the market more than any technical limit does. In the United Kingdom, privately owned electric scooters may be used only on private land with the owner's permission, while rental schemes run on public roads under separate authorisation. Buyers in such markets purchase into an unclear use case, retailers sell cautiously, and resale values stay soft. Elsewhere, rules differ between neighbouring cities in the same country.
The underlying cause is that vehicle classification law predates the product. Where no category exists, a scooter falls into motor vehicle rules that demand registration, insurance and type approval it was never designed to meet. Where categories do exist, speed caps, age limits, helmet rules and insurance plates differ, so one specification cannot serve every market. Manufacturers absorb the documentation and variant cost, and enforcement differences leave buyers genuinely confused.
Market Opportunities
Two revenue pools sit outside straightforward vehicle sales and are only partly served today.
Certified High-Specification Commuter Models Open a Premium Replacement Pool
Replacement buying by experienced riders is the clearest new revenue pool in this category. Owners of first-generation budget scooters now shop for hydraulic or drum brakes, brighter lighting, indicators, tubeless 10-inch tyres, suspension and a certified battery pack. These buyers accept prices above US$ 800 because the product has become daily transport. Average selling prices therefore rise even where unit volumes stay flat, lifting revenue without needing new riders to enter the category.
Brands with dealer networks, service counters and spare-parts logistics are best placed to capture this pool, because certified products need warranty handling and repair. Demand comes from daily commuters, from employers that allow scooters in buildings only when certified, and from insurers that price cover against listed equipment. Durability and labelling duties under the European Union's Batteries Regulation push suppliers toward better cells and clearer pack information, which supports the premium position.
Fleet Replacement and Spare Parts Build a Service Revenue Pool Beyond Vehicle Sales
Shared-fleet demand has become a replacement business, and that creates recurring service revenue rather than one-off vehicle revenue. After the land-grab era, operators consolidated, left unprofitable cities and moved to swappable batteries and sturdier vehicles that survive several seasons. Spending shifted from fleet expansion to packs, controllers, decks, brake assemblies and refurbishment. Margins on these parts are generally better than on complete vehicles, and the demand repeats on a predictable cycle.
Manufacturers that design serviceable vehicles with modular packs can capture most of this pool, alongside independent repair networks and refurbishers. The demand comes from operators holding multi-year municipal permits that specify vehicle lifespan, maintenance and end-of-life handling. Producer responsibility and collection duties under the European Union's Batteries Regulation, together with UN 38.3 testing rules for shipping packs, make organised reverse logistics a service that operators prefer to buy rather than build.
Segment Analysis
By Range Band: Mid-Range Models Lead While Long-Range Scooters Gain Ground
The 25–40 km band held 34% share in 2026, because it matches the distance most riders actually travel and keeps pack cost, weight and folded size within comfortable limits. Riders who commute five to ten kilometres each way can charge twice a week rather than nightly. The Above 60 km band is the fastest-growing, at an 8.9% CAGR through 2033, as experienced owners replace early purchases with scooters that handle a full week of trips and occasional longer rides. Larger packs require better thermal management and certified cells, which raises bill-of-materials cost and pushes these models into higher price tiers. The commercial effect is a steady shift of revenue toward bigger batteries, so suppliers that secure quality cells and pass certification testing protect margin while entry-level competitors fight on price alone.
By Motor Power: Low-Power Scooters Hold Volume as Mid-Power Units Accelerate
The Up to 350 W class held 38% share in 2026, largely because many jurisdictions set power or speed ceilings that favour modest motors, and because low-power scooters are lighter to carry. This class also dominates first-time purchases and gift buying. The 501–750 W class is expanding fastest, at an 8.2% CAGR through 2033, driven by hill-climbing demands in cities with gradients, heavier riders, and commuters carrying bags or delivery loads. Dual-braking requirements and sturdier forks accompany these motors, raising unit value. Regulatory ceilings keep the very highest outputs confined to private-land use in several markets, which limits the Above 750 W class. For manufacturers, the practical consequence is a two-platform strategy: a light compliant commuter model and a stronger model for rider weight and terrain, sharing folding hardware and controls.
By Price Tier: Entry Models Dominate Volume While Premium Scooters Capture Value
The Entry tier below US$ 400 held 45% share in 2026, a direct result of supply-base economics. Concentrated manufacturing in a handful of Chinese factories, shared component catalogues and short design cycles behave like consumer electronics, pushing prices down quickly. The Premium tier above US$ 800 is growing fastest, at an 8.4% CAGR through 2033, as certification, braking performance and lighting move from selling points to purchase conditions. Retailers and marketplaces that require listed electrical systems effectively filter out the cheapest imports, which shifts mix upward. Insurance and building-access rules reinforce the same movement, because certified equipment is easier to approve. The business implication is a hollowing middle: brands either compete on landed cost at volume or invest in testing, service and warranty to defend higher prices.
By Distribution Channel: Online Retail Leads While Service Dealers Grow Quickest
Online Retail held 52% share in 2026, reflecting a product that ships in a single box, is compared on specification tables and sells well through marketplaces and brand sites. Direct selling also suits short model cycles and frequent price moves. Specialty Retail and Service Dealers form the fastest-growing channel at a 7.9% CAGR through 2033, because certified scooters need test rides, warranty handling, brake servicing and battery replacement that a parcel network cannot provide. Marketplace listing policies that demand proof of electrical certification have pushed some unbranded sellers out, and physical dealers gained the resulting share. Direct Fleet Supply remains small and lumpy, tied to operator permit cycles. The implication is that aftersales capability is becoming a distribution asset rather than an overhead line.
By End Use: Personal Commuting Leads While Last-Mile Delivery Expands Fastest
Personal Commuting held 61% share in 2026, confirming that the category now sells mainly as transport for short daily trips and station connections rather than as recreation. Riders value folded size and reliable range over top speed. Commercial Last-Mile Delivery is the fastest-growing end use at an 8.6% CAGR through 2033, as couriers work in dense centres where vans face access limits, parking costs and low-emission zone charges. These riders demand serviceable brakes, bigger packs and quick pack swaps, and they replace equipment far more often than consumers. Shared Mobility Fleets now behave as a replacement channel after operator consolidation and city exits. The commercial implication is that durability specifications written for delivery work are migrating into premium consumer models.
Geography Analysis
North America Pairs Strong Commuter Demand With Strict Fire-Safety Oversight
North America held 22% share in the folding scooter market in 2026 and is projected to grow at a 5.4% CAGR through 2033, the slowest of the five regions. The United States and Canada show healthy commuter demand in dense cities, but building fire rules, insurer pressure and municipal restrictions on uncertified devices have narrowed distribution. New York City requires powered mobility devices sold or rented locally to carry recognised safety certification, and large retailers apply similar listing conditions nationally. State and city road rules vary widely, which complicates marketing. The clearest regional change is the move toward certified premium models sold with service support, as retailers consolidate assortments around brands that can document pack testing and provide warranty repair.
Which Region Is Growing Fastest in the Foldable Electric Scooter Market?
Europe is growing fastest, at a 7.3% CAGR through 2033, from a 29% share in 2026, because national law gives personal light electric vehicles a defined legal category. France, Germany, Italy and Spain set assisted speed limits near 25 km/h, specify where riders may travel and, in Germany, require an insurance plate. That clarity supports confident retail selling and daily commuting use. The standard EN 17128 provides a common safety reference, while the Batteries Regulation and the General Product Safety Regulation add obligations on pack information, traceability and marketplace accountability. The United Kingdom is the exception, since private scooters remain restricted to private land. Compliance costs favour established brands, and the region is shifting steadily toward certified, dearer commuter models.
Which Region Is Leading the Foldable Electric Scooter Market?
Asia Pacific leads with 38% share in 2026 and is forecast to grow at a 6.2% CAGR through 2033, because the supply base and the largest buying population sit in the same region. China hosts most assembly and nearly all cell, controller and motor supply, giving domestic brands a landed-cost advantage that shapes global pricing. India adds volume through short-trip urban demand, while Japan created a dedicated small motorised vehicle category that permits low-speed riding under defined conditions. Dense cities, extensive rail networks and limited car parking suit folding designs. The main regional change is a quality shift: export certification requirements are pulling domestic specifications upward, so the same factories now build both commodity and certified premium models.
Latin America Builds Slowly as Import Costs and Road Safety Limit Uptake
Latin America held 6% share in 2026 and is projected to grow at a 6.8% CAGR through 2033, with Brazil, Mexico, Colombia and Chile accounting for most sales. Urban congestion in large metropolitan areas makes short-trip riding attractive, and courier work provides a steady commercial base. Barriers are real: import duties and currency movement raise landed prices against local incomes, consumer financing is limited, and protected cycling infrastructure is thin outside a few cities such as Bogotá. Patchy enforcement of road rules also discourages cautious buyers. The main regional change is the growth of local repair and parts businesses, which extends vehicle life and makes mid-priced scooters viable where replacement is expensive.
Middle East & Africa Advances From a Small Base on Gulf City Regulation
Middle East & Africa accounted for 5% of sales in 2026 and is projected to expand at a 7.0% CAGR through 2033, the second-fastest pace from the smallest base. The United Arab Emirates has formal permit and rider-licensing arrangements in Dubai, with designated tracks and defined speed limits, and Saudi Arabia is adding micromobility provision in new urban districts. South Africa shows steady private demand in Cape Town and Johannesburg. Barriers include summer heat that shortens battery life and deters riding, limited protected lanes, and import logistics that raise prices. The main change is tourism and campus mobility, where defined private road networks let operators and retailers deploy without waiting for national road rules.
Competitive Landscape
The foldable electric scooter market is moderately concentrated, and concentration is far higher in manufacturing than in branding. A small group of Chinese manufacturers supplies the frames, controllers, motors and battery packs behind a long list of consumer labels, so dozens of brands compete on a shared component base. Segway-Ninebot, Xiaomi and Niu Technologies anchor global volume, while Razor USA and Micro Mobility Systems hold strong positions in specific retail channels and age groups. Below them sit regional specialists and private-label sellers whose survival depends on access to marketplace listings.
Competition runs on consumer electronics logic rather than vehicle logic. Brands compete on folded weight, claimed range, charge time, brake type, lighting, app features and price, and they refresh models on short cycles. Certification has become the real barrier to entry, because large retailers and marketplaces increasingly require documented electrical safety listings before a product can be sold. Apollo Scooters, Unagi Scooters, Pure Electric and Inokim compete by specification and service rather than price, while Minimotors and Kaabo serve high-performance enthusiasts.
Strategic activity has centred on three themes. Brands are consolidating model ranges around certified platforms, building dealer and service networks to handle warranty and battery replacement, and tightening cell sourcing to control fire risk and insurance exposure. Several have expanded spare-parts catalogues to serve fleet operators and repairers. Scooter sharing operators, meanwhile, have narrowed supplier lists and now specify swappable packs and longer service life rather than lowest purchase price.
Strategic direction across the group is converging on durability, documentation and aftersales. Vendors are investing in testing capability, traceable battery supply and repairability, because these determine retail access and fleet eligibility more than headline performance does.
Foldable Electric Scooter Industry Leaders
- Segway-Ninebot
- Xiaomi
- Niu Technologies
- Razor USA
- Micro Mobility Systems
Recent Industry Developments
- February 2024: The European Union's Batteries Regulation became applicable, introducing duties on carbon footprint declaration, recycled content, labelling and producer responsibility for the lithium-ion packs used in folding scooters – it raises compliance cost for importers and favours suppliers with traceable cell sourcing.
- December 2024: The European Union's General Product Safety Regulation became applicable, extending traceability, recall and online marketplace obligations to consumer products sold into the bloc – it makes marketplaces accountable for listings and squeezes uncertified low-cost imports out of major channels.
- August 2025: Extended producer responsibility and collection obligations under the European Union's Batteries Regulation took effect for battery producers – it turns end-of-life pack collection and recycling into an organised service cost that scooter brands and fleet operators must now fund.
Foldable Electric Scooter Market Report Scope
| Metric | Value |
| Study Period | 2020–2033 |
| Market Size 2026 | US$ 4.5 Billion |
| Market Size 2033 | US$ 6.9 Billion |
| CAGR 2026–2033 | 6.3% |
| Absolute Dollar Opportunity | US$ 2.4 Billion |
| Largest Market | Asia Pacific (38% share in 2026) |
| Fastest-Growing Market | Europe (7.3% CAGR) |
| Market Concentration | Medium |
| Major Players | Segway-Ninebot, Xiaomi, Niu Technologies, Razor USA |
This study covers folding-frame standing electric scooters sold to consumers and to shared-mobility fleet operators. It counts foldable models specifically, and excludes fixed-frame electric scooters, the wider micromobility market, electric motorcycles, mopeds and seated electric two-wheelers. Estimates cover vehicle sales, with the base year set at 2025 and a forecast period of 2026 to 2033. All values are reported in US$ Billion at manufacturer selling prices.
Foldable Electric Scooter Market Segmentation
Range Band
- Up to 25 km
- 25–40 km
- 40–60 km
- Above 60 km
Motor Power
- Up to 350 W
- 351–500 W
- 501–750 W
- Above 750 W
Price Tier
- Entry (below US$ 400)
- Mid (US$ 400–800)
- Premium (above US$ 800)
Distribution Channel
- Online Retail
- Specialty Retail and Service Dealers
- Mass Merchandisers and Electronics Retail
- Direct Fleet Supply
End Use
- Personal Commuting
- Leisure and Recreation
- Shared Mobility Fleets
- Commercial Last-Mile Delivery
Regions
- North America
- Europe
- Asia Pacific
- Latin America
- Middle East & Africa
- Executive Summary
- Global Foldable Electric Scooter Market Snapshot
- Future Projections
- Key Report Takeaways
- Regional Snapshot
- Market Overview
- Market Definition and Report Scope
- Historical Trends 2020–2025
- Market Dynamics
- Drivers
- Clear Light-Vehicle Rules Are Turning Folding Scooters Into Daily Commuter Hardware
- Folding Portability Keeps This Category Ahead of Fixed-Frame Micromobility Products
- Restraints
- Battery Fires in Residential Buildings Have Made Certification the Gate to Retail Shelves
- Inconsistent Road-Use Law Caps the Addressable Base for Privately Owned Scooters
- Market Opportunities
- Certified High-Specification Commuter Models Open a Premium Replacement Pool
- Fleet Replacement and Spare Parts Build a Service Revenue Pool Beyond Vehicle Sales
- Drivers
- Global Foldable Electric Scooter Market Outlook, 2020–2033
- Global Foldable Electric Scooter Market Outlook, by Range Band, Value (US$ Billion), 2020–2033
- Up to 25 km
- 25–40 km
- 40–60 km
- Above 60 km
- Global Foldable Electric Scooter Market Outlook, by Motor Power, Value (US$ Billion), 2020–2033
- Up to 350 W
- 351–500 W
- 501–750 W
- Above 750 W
- Global Foldable Electric Scooter Market Outlook, by Price Tier, Value (US$ Billion), 2020–2033
- Entry (below US$ 400)
- Mid (US$ 400–800)
- Premium (above US$ 800)
- Global Foldable Electric Scooter Market Outlook, by Distribution Channel, Value (US$ Billion), 2020–2033
- Online Retail
- Specialty Retail and Service Dealers
- Mass Merchandisers and Electronics Retail
- Direct Fleet Supply
- Global Foldable Electric Scooter Market Outlook, by End Use, Value (US$ Billion), 2020–2033
- Personal Commuting
- Leisure and Recreation
- Shared Mobility Fleets
- Commercial Last-Mile Delivery
- Global Foldable Electric Scooter Market Outlook, by Region, Value (US$ Billion), 2020–2033
- North America
- Europe
- Asia Pacific
- Latin America
- Middle East & Africa
- Global Foldable Electric Scooter Market Outlook, by Range Band, Value (US$ Billion), 2020–2033
- North America Foldable Electric Scooter Market Outlook, 2020–2033
- North America Foldable Electric Scooter Market Outlook, by Range Band, Value (US$ Billion), 2020–2033
- Up to 25 km
- 25–40 km
- 40–60 km
- Above 60 km
- North America Foldable Electric Scooter Market Outlook, by Motor Power, Value (US$ Billion), 2020–2033
- Up to 350 W
- 351–500 W
- 501–750 W
- Above 750 W
- North America Foldable Electric Scooter Market Outlook, by Price Tier, Value (US$ Billion), 2020–2033
- Entry (below US$ 400)
- Mid (US$ 400–800)
- Premium (above US$ 800)
- North America Foldable Electric Scooter Market Outlook, by Distribution Channel, Value (US$ Billion), 2020–2033
- Online Retail
- Specialty Retail and Service Dealers
- Mass Merchandisers and Electronics Retail
- Direct Fleet Supply
- North America Foldable Electric Scooter Market Outlook, by End Use, Value (US$ Billion), 2020–2033
- Personal Commuting
- Leisure and Recreation
- Shared Mobility Fleets
- Commercial Last-Mile Delivery
- North America Foldable Electric Scooter Market Outlook, by Country, Value (US$ Billion), 2020–2033
- United States Foldable Electric Scooter Market Outlook, by Range Band, 2020–2033
- United States Foldable Electric Scooter Market Outlook, by Motor Power, 2020–2033
- United States Foldable Electric Scooter Market Outlook, by Price Tier, 2020–2033
- United States Foldable Electric Scooter Market Outlook, by Distribution Channel, 2020–2033
- United States Foldable Electric Scooter Market Outlook, by End Use, 2020–2033
- Canada Foldable Electric Scooter Market Outlook, by Range Band, 2020–2033
- Canada Foldable Electric Scooter Market Outlook, by Motor Power, 2020–2033
- Canada Foldable Electric Scooter Market Outlook, by Price Tier, 2020–2033
- Canada Foldable Electric Scooter Market Outlook, by Distribution Channel, 2020–2033
- Canada Foldable Electric Scooter Market Outlook, by End Use, 2020–2033
- North America Foldable Electric Scooter Market Outlook, by Range Band, Value (US$ Billion), 2020–2033
- Europe Foldable Electric Scooter Market Outlook, 2020–2033
- Europe Foldable Electric Scooter Market Outlook, by Range Band, Value (US$ Billion), 2020–2033
- Up to 25 km
- 25–40 km
- 40–60 km
- Above 60 km
- Europe Foldable Electric Scooter Market Outlook, by Motor Power, Value (US$ Billion), 2020–2033
- Up to 350 W
- 351–500 W
- 501–750 W
- Above 750 W
- Europe Foldable Electric Scooter Market Outlook, by Price Tier, Value (US$ Billion), 2020–2033
- Entry (below US$ 400)
- Mid (US$ 400–800)
- Premium (above US$ 800)
- Europe Foldable Electric Scooter Market Outlook, by Distribution Channel, Value (US$ Billion), 2020–2033
- Online Retail
- Specialty Retail and Service Dealers
- Mass Merchandisers and Electronics Retail
- Direct Fleet Supply
- Europe Foldable Electric Scooter Market Outlook, by End Use, Value (US$ Billion), 2020–2033
- Personal Commuting
- Leisure and Recreation
- Shared Mobility Fleets
- Commercial Last-Mile Delivery
- Europe Foldable Electric Scooter Market Outlook, by Country, Value (US$ Billion), 2020–2033
- France Foldable Electric Scooter Market Outlook, by Range Band, 2020–2033
- France Foldable Electric Scooter Market Outlook, by Motor Power, 2020–2033
- France Foldable Electric Scooter Market Outlook, by Price Tier, 2020–2033
- France Foldable Electric Scooter Market Outlook, by Distribution Channel, 2020–2033
- France Foldable Electric Scooter Market Outlook, by End Use, 2020–2033
- Germany Foldable Electric Scooter Market Outlook, by Range Band, 2020–2033
- Germany Foldable Electric Scooter Market Outlook, by Motor Power, 2020–2033
- Germany Foldable Electric Scooter Market Outlook, by Price Tier, 2020–2033
- Germany Foldable Electric Scooter Market Outlook, by Distribution Channel, 2020–2033
- Germany Foldable Electric Scooter Market Outlook, by End Use, 2020–2033
- Italy Foldable Electric Scooter Market Outlook, by Range Band, 2020–2033
- Italy Foldable Electric Scooter Market Outlook, by Motor Power, 2020–2033
- Italy Foldable Electric Scooter Market Outlook, by Price Tier, 2020–2033
- Italy Foldable Electric Scooter Market Outlook, by Distribution Channel, 2020–2033
- Italy Foldable Electric Scooter Market Outlook, by End Use, 2020–2033
- Spain Foldable Electric Scooter Market Outlook, by Range Band, 2020–2033
- Spain Foldable Electric Scooter Market Outlook, by Motor Power, 2020–2033
- Spain Foldable Electric Scooter Market Outlook, by Price Tier, 2020–2033
- Spain Foldable Electric Scooter Market Outlook, by Distribution Channel, 2020–2033
- Spain Foldable Electric Scooter Market Outlook, by End Use, 2020–2033
- United Kingdom Foldable Electric Scooter Market Outlook, by Range Band, 2020–2033
- United Kingdom Foldable Electric Scooter Market Outlook, by Motor Power, 2020–2033
- United Kingdom Foldable Electric Scooter Market Outlook, by Price Tier, 2020–2033
- United Kingdom Foldable Electric Scooter Market Outlook, by Distribution Channel, 2020–2033
- United Kingdom Foldable Electric Scooter Market Outlook, by End Use, 2020–2033
- Europe Foldable Electric Scooter Market Outlook, by Range Band, Value (US$ Billion), 2020–2033
- Asia Pacific Foldable Electric Scooter Market Outlook, 2020–2033
- Asia Pacific Foldable Electric Scooter Market Outlook, by Range Band, Value (US$ Billion), 2020–2033
- Up to 25 km
- 25–40 km
- 40–60 km
- Above 60 km
- Asia Pacific Foldable Electric Scooter Market Outlook, by Motor Power, Value (US$ Billion), 2020–2033
- Up to 350 W
- 351–500 W
- 501–750 W
- Above 750 W
- Asia Pacific Foldable Electric Scooter Market Outlook, by Price Tier, Value (US$ Billion), 2020–2033
- Entry (below US$ 400)
- Mid (US$ 400–800)
- Premium (above US$ 800)
- Asia Pacific Foldable Electric Scooter Market Outlook, by Distribution Channel, Value (US$ Billion), 2020–2033
- Online Retail
- Specialty Retail and Service Dealers
- Mass Merchandisers and Electronics Retail
- Direct Fleet Supply
- Asia Pacific Foldable Electric Scooter Market Outlook, by End Use, Value (US$ Billion), 2020–2033
- Personal Commuting
- Leisure and Recreation
- Shared Mobility Fleets
- Commercial Last-Mile Delivery
- Asia Pacific Foldable Electric Scooter Market Outlook, by Country, Value (US$ Billion), 2020–2033
- China Foldable Electric Scooter Market Outlook, by Range Band, 2020–2033
- China Foldable Electric Scooter Market Outlook, by Motor Power, 2020–2033
- China Foldable Electric Scooter Market Outlook, by Price Tier, 2020–2033
- China Foldable Electric Scooter Market Outlook, by Distribution Channel, 2020–2033
- China Foldable Electric Scooter Market Outlook, by End Use, 2020–2033
- India Foldable Electric Scooter Market Outlook, by Range Band, 2020–2033
- India Foldable Electric Scooter Market Outlook, by Motor Power, 2020–2033
- India Foldable Electric Scooter Market Outlook, by Price Tier, 2020–2033
- India Foldable Electric Scooter Market Outlook, by Distribution Channel, 2020–2033
- India Foldable Electric Scooter Market Outlook, by End Use, 2020–2033
- Japan Foldable Electric Scooter Market Outlook, by Range Band, 2020–2033
- Japan Foldable Electric Scooter Market Outlook, by Motor Power, 2020–2033
- Japan Foldable Electric Scooter Market Outlook, by Price Tier, 2020–2033
- Japan Foldable Electric Scooter Market Outlook, by Distribution Channel, 2020–2033
- Japan Foldable Electric Scooter Market Outlook, by End Use, 2020–2033
- Asia Pacific Foldable Electric Scooter Market Outlook, by Range Band, Value (US$ Billion), 2020–2033
- Latin America Foldable Electric Scooter Market Outlook, 2020–2033
- Latin America Foldable Electric Scooter Market Outlook, by Range Band, Value (US$ Billion), 2020–2033
- Up to 25 km
- 25–40 km
- 40–60 km
- Above 60 km
- Latin America Foldable Electric Scooter Market Outlook, by Motor Power, Value (US$ Billion), 2020–2033
- Up to 350 W
- 351–500 W
- 501–750 W
- Above 750 W
- Latin America Foldable Electric Scooter Market Outlook, by Price Tier, Value (US$ Billion), 2020–2033
- Entry (below US$ 400)
- Mid (US$ 400–800)
- Premium (above US$ 800)
- Latin America Foldable Electric Scooter Market Outlook, by Distribution Channel, Value (US$ Billion), 2020–2033
- Online Retail
- Specialty Retail and Service Dealers
- Mass Merchandisers and Electronics Retail
- Direct Fleet Supply
- Latin America Foldable Electric Scooter Market Outlook, by End Use, Value (US$ Billion), 2020–2033
- Personal Commuting
- Leisure and Recreation
- Shared Mobility Fleets
- Commercial Last-Mile Delivery
- Latin America Foldable Electric Scooter Market Outlook, by Country, Value (US$ Billion), 2020–2033
- Brazil Foldable Electric Scooter Market Outlook, by Range Band, 2020–2033
- Brazil Foldable Electric Scooter Market Outlook, by Motor Power, 2020–2033
- Brazil Foldable Electric Scooter Market Outlook, by Price Tier, 2020–2033
- Brazil Foldable Electric Scooter Market Outlook, by Distribution Channel, 2020–2033
- Brazil Foldable Electric Scooter Market Outlook, by End Use, 2020–2033
- Mexico Foldable Electric Scooter Market Outlook, by Range Band, 2020–2033
- Mexico Foldable Electric Scooter Market Outlook, by Motor Power, 2020–2033
- Mexico Foldable Electric Scooter Market Outlook, by Price Tier, 2020–2033
- Mexico Foldable Electric Scooter Market Outlook, by Distribution Channel, 2020–2033
- Mexico Foldable Electric Scooter Market Outlook, by End Use, 2020–2033
- Colombia Foldable Electric Scooter Market Outlook, by Range Band, 2020–2033
- Colombia Foldable Electric Scooter Market Outlook, by Motor Power, 2020–2033
- Colombia Foldable Electric Scooter Market Outlook, by Price Tier, 2020–2033
- Colombia Foldable Electric Scooter Market Outlook, by Distribution Channel, 2020–2033
- Colombia Foldable Electric Scooter Market Outlook, by End Use, 2020–2033
- Chile Foldable Electric Scooter Market Outlook, by Range Band, 2020–2033
- Chile Foldable Electric Scooter Market Outlook, by Motor Power, 2020–2033
- Chile Foldable Electric Scooter Market Outlook, by Price Tier, 2020–2033
- Chile Foldable Electric Scooter Market Outlook, by Distribution Channel, 2020–2033
- Chile Foldable Electric Scooter Market Outlook, by End Use, 2020–2033
- Latin America Foldable Electric Scooter Market Outlook, by Range Band, Value (US$ Billion), 2020–2033
- Middle East & Africa Foldable Electric Scooter Market Outlook, 2020–2033
- Middle East & Africa Foldable Electric Scooter Market Outlook, by Range Band, Value (US$ Billion), 2020–2033
- Up to 25 km
- 25–40 km
- 40–60 km
- Above 60 km
- Middle East & Africa Foldable Electric Scooter Market Outlook, by Motor Power, Value (US$ Billion), 2020–2033
- Up to 350 W
- 351–500 W
- 501–750 W
- Above 750 W
- Middle East & Africa Foldable Electric Scooter Market Outlook, by Price Tier, Value (US$ Billion), 2020–2033
- Entry (below US$ 400)
- Mid (US$ 400–800)
- Premium (above US$ 800)
- Middle East & Africa Foldable Electric Scooter Market Outlook, by Distribution Channel, Value (US$ Billion), 2020–2033
- Online Retail
- Specialty Retail and Service Dealers
- Mass Merchandisers and Electronics Retail
- Direct Fleet Supply
- Middle East & Africa Foldable Electric Scooter Market Outlook, by End Use, Value (US$ Billion), 2020–2033
- Personal Commuting
- Leisure and Recreation
- Shared Mobility Fleets
- Commercial Last-Mile Delivery
- Middle East & Africa Foldable Electric Scooter Market Outlook, by Country, Value (US$ Billion), 2020–2033
- United Arab Emirates Foldable Electric Scooter Market Outlook, by Range Band, 2020–2033
- United Arab Emirates Foldable Electric Scooter Market Outlook, by Motor Power, 2020–2033
- United Arab Emirates Foldable Electric Scooter Market Outlook, by Price Tier, 2020–2033
- United Arab Emirates Foldable Electric Scooter Market Outlook, by Distribution Channel, 2020–2033
- United Arab Emirates Foldable Electric Scooter Market Outlook, by End Use, 2020–2033
- Saudi Arabia Foldable Electric Scooter Market Outlook, by Range Band, 2020–2033
- Saudi Arabia Foldable Electric Scooter Market Outlook, by Motor Power, 2020–2033
- Saudi Arabia Foldable Electric Scooter Market Outlook, by Price Tier, 2020–2033
- Saudi Arabia Foldable Electric Scooter Market Outlook, by Distribution Channel, 2020–2033
- Saudi Arabia Foldable Electric Scooter Market Outlook, by End Use, 2020–2033
- South Africa Foldable Electric Scooter Market Outlook, by Range Band, 2020–2033
- South Africa Foldable Electric Scooter Market Outlook, by Motor Power, 2020–2033
- South Africa Foldable Electric Scooter Market Outlook, by Price Tier, 2020–2033
- South Africa Foldable Electric Scooter Market Outlook, by Distribution Channel, 2020–2033
- South Africa Foldable Electric Scooter Market Outlook, by End Use, 2020–2033
- Middle East & Africa Foldable Electric Scooter Market Outlook, by Range Band, Value (US$ Billion), 2020–2033
- Competitive Landscape
- Market Concentration and Industry Leaders
- Competitive Differentiation
- Strategic Moves and Market Direction
- Recent Industry Developments
- Company Profiles
- Segway-Ninebot
- Xiaomi
- Niu Technologies
- Yadea
- Razor USA
- Micro Mobility Systems
- Pure Electric
- Apollo Scooters
- Unagi Scooters
- Minimotors
- Kaabo
- Inokim
- GOTRAX
- Appendix
- Research Methodology
- Report Assumptions
- Acronyms and Abbreviations
Range Band
- Up to 25 km
- 25–40 km
- 40–60 km
- Above 60 km
Motor Power
- Up to 350 W
- 351–500 W
- 501–750 W
- Above 750 W
Price Tier
- Entry (below US$ 400)
- Mid (US$ 400–800)
- Premium (above US$ 800)
Distribution Channel
- Online Retail
- Specialty Retail and Service Dealers
- Mass Merchandisers and Electronics Retail
- Direct Fleet Supply
End Use
- Personal Commuting
- Leisure and Recreation
- Shared Mobility Fleets
- Commercial Last-Mile Delivery
Regions
- North America
- Europe
- Asia Pacific
- Latin America
- Middle East & Africa
Our Research Methodology
Considering the volatility of business today, traditional approaches to strategizing a game plan can be unfruitful if not detrimental. True ambiguity is no way to determine a forecast. A myriad of predetermined factors must be accounted for such as the degree of risk involved, the magnitude of circumstances, as well as conditions or consequences that are not known or unpredictable. To circumvent binary views that cast uncertainty, the application of market research intelligence to strategically posture, move, and enable actionable outcomes is necessary.
View Methodology
Quality Assured
Rigorous Validation Process

Confidentiality Assured
End-to-end Data Security

Custom Research Services
Tailored To Your Objectives
FAQs
The market is valued at US$ 4.5 billion in 2026, covering folding-frame standing scooters sold to consumers and to shared-mobility fleet operators worldwide.
Sales are projected to reach US$ 6.9 billion by 2033, a 6.3% CAGR and an absolute opportunity of US$ 2.4 billion over the forecast period.
The Entry tier below US$ 400 leads with 45% share in 2026, supported by concentrated manufacturing and short consumer electronics style design cycles.
Commercial Last-Mile Delivery grows fastest at an 8.6% CAGR through 2033, as couriers work in dense centres where vans face access and parking limits.
Asia Pacific leads with 38% share in 2026, and concentration is medium, with a small manufacturing base supplying many competing consumer brands.
Related Reports
Smart Oil Dipstick Market Size, Share, Insights, Competitive Landscape, and Forecast 2026 to 2033
Smart Oil Dipstick Market is projected to rise from US$ 4.03 billion in 2026 to US$ 13.02 billion by 2033 at an 18.2% CAGR. Explore key uses and trends.
Rail Glazing Market Size, Share, Insights, Competitive Landscape, and Forecast 2026 to 2033
Rail Glazing Market is projected to grow from US$ 2.37 billion in 2026 to US$ 3.56 billion by 2033 at a 6.0% CAGR. Explore materials and applications.
Passenger Vehicle ADAS Market Size, Share, Insights, Competitive Landscape, and Forecast 2026 to 2033
Passenger Vehicle ADAS Market is set to grow from US$ 36.7 billion in 2026 to US$ 115.5 billion by 2033 at a 17.8% CAGR. Explore sensors and trends.
Container Fleet Market Size, Share, Insights, Competitive Landscape, and Forecast 2026 to 2033
Explore the container fleet market, projected to reach US$ 26.8 billion by 2033 at a 5.4% CAGR, with container types, ownership and regional insights.
Micro-mobility Charging Infrastructure Market Size, Share, Insights, Competitive Landscape, and Forecast 2026 to 2033
The global micro-mobility charging infrastructure market is valued at US$9.06 billion in 2026, reaching US$34.02 billion by 2033, growing at a 20.8% CAGR
eCTOL Aircraft Market Size, Share, Insights, Competitive Landscape, and Forecast 2026 to 2033
Explore the eCTOL aircraft market, projected to reach US$ 11.14 billion by 2033 at a 10.6% CAGR, with propulsion, application and regional insights.