Biosolids Market Outlook
Global Biosolids Market Presents Effective Solution for Reusing Waste Material
It is estimated that around 80% (90% in developing countries) of the wastewater, worldwide, is released into the environment untreated. Wastewater sewage contains nutrients that can be used for agriculture purpose. As the resources around the world become scarce and expensive, it is important to convert wastewater into a beneficial asset. Biosolids, organic materials derived from the wastewater treatment of domestic and industrial sewage sludge, have gathered a significant movement as an alternative to dispose of digested municipal sludge.

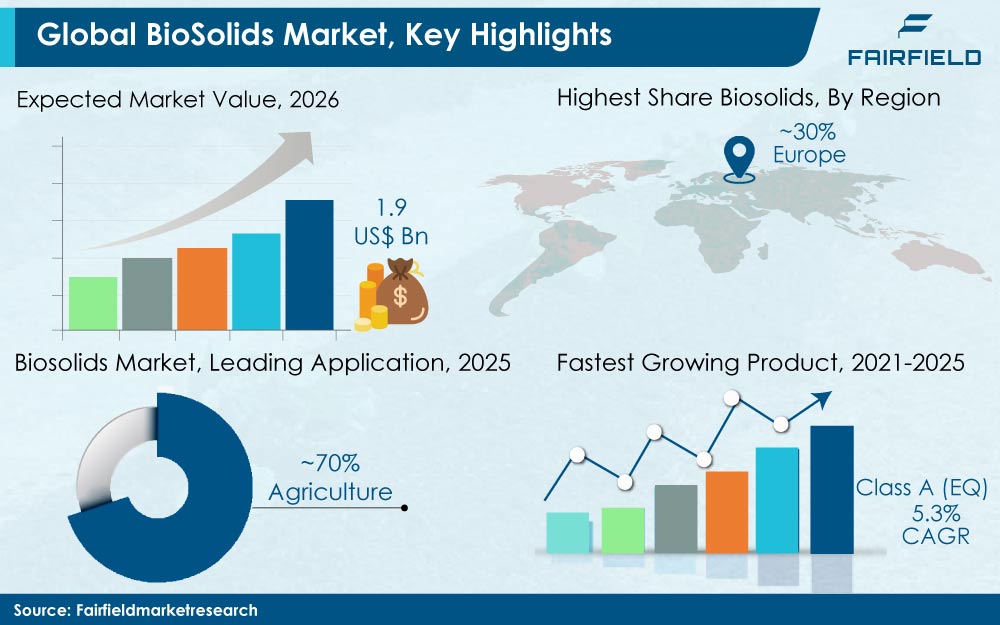
In 2018, the global biosolids market was valued at US$1.4 Bn and is expected to reach US$1.9 Bn by 2025, registering a healthy growth of 4.7% between 2021 and 2025. It is estimated that more than 35 million tonnes of biosolids were produced (for beneficial use) around the globe in the year 2018. Europe alone accounted for more than 25% of the global consumption in 2018. European Commission and European Governments have supported biosolids as best environmental solutions for waste disposal. The U.S., largest producer in North America, consumes most of the biosolids for land application. All of these findings indicate that the global biosolids market is slated to witness exponential rise in the coming years.
Countries in Asia Pacific region such as China and India are investing in the development of sludge management strategies and selecting better routes for sludge treatment and disposal instead of adopting landfilling and incineration. China is projected to surpass North America in the coming years as the country has invested heavily in wastewater treatment technologies for environmental protection.
Class A and Class A (EQ) to Account for 50% Share in Global Biosolids Market
Based upon regulations, biosolids can be classified as Class A, Class B, and Class A (EQ). Class A biosolids are free of pathogens and can be used in applications where public contact is likely. Class A meets the standards set by governing bodies such as the U.S. EPA. On the other hand, Class B has low level of pathogens and is used in agricultural or land reclamation applications. However, due to bad odour, high vector attraction, and pathogens there is significant shift of customers from Class B to Class A and Class A (EQ). Together, they are expected to account for more than 50% of the total biosolids market by the end of forecast period. Furthermore, Class B also attracts a lot of attention from regulatory authorities and cannot be applied in home lawns and gardens.
In terms of consumption, agriculture accounted for more than 60% of the biosolids market in 2018. For their high nutrition value, containing micro and macro nutrients, biosolids in agriculture are used as fertilizers, soil replacement products or a soil conditioner. Other key applications of biosolids include forestry and landscaping, land reclamation, construction materials, and heat generation.
Government Backs Biosolids Management Program for Circular Economy
Foremost factor supporting the rising consumption of biosolids is increasing pressure from regulatory bodies to phase out landfilling, stringent regulations on wastewater, sewage treatment, and waste disposal. The European Union (EU) and the U.S. Government is closely scrutinizing landfill and incineration aspects and imposition of strict laws. Biosolids in land application offers greenhouse gas benefits with carbon recycling and nourishing vegetation for further CO2 capture. Biosolids have a major role to play in circular economies. The recycling of biosolids into agriculture is recognised by the U.K. Government and EU as the best environmental option.
The global biosolids market makes a valid case for eliminating the need for commercial fertilizers. There is a growing trend towards the use of biosolids in amenity horticulture (floriculture, greenhouse container, arboriculture, etc.). Biosolids offers various benefits such as reducing the dependency on synthetic fertilizers, lower greenhouse emissions, improve water holding capacity, and improve soil structure. Biosolids are also expected to play an important role in treatment and reclamation of former mining sites as they can upgrade the mined land and assist in vegetation establishment.
Malodour Creates Negative Publicity for Global Biosolids Market
In the past few years, malodour from biosolids has become a bothersome aspect in customer perception. Organizations such as EPA are emphasizing on need to get better support from the public to make these biosolids programs a successful model. Effectively and safely managing biosolids is also a major challenge for the community as they are produced in large quantities. Public and other stakeholders must understand that biosolids are the product of modern sanitation and are not optional. Treatment and disposal of wastewater solids is key to sanitation and waste management.
Transportation (and the cost of moving) of disposal water/waste and difficulties in raising capital for new plants are few factors likely to restrict the market growth.
Synergies with Fertilizer Companies Opens New Avenues for Biosolids Manufacturers
Companies operating in the global biosolids market such as Cleanaway, SUEZ, Veolia, and Thames Water have integrated business operations. These companies offer end-to-end business solutions and hold strong positions in their respective regions. Companies are also coming up new strategies to form a partnership with fertilizer companies to develop new application avenues.
In 2019, Aries Clean Energy received approvals for its world’s first large scale biosolids gasification plant. This will convert waste into renewable energy and biochar. With the need of cost competitive technologies and innovation, many companies are expected to come up with disruptive technologies over the next few years to come. Companies in the U.S such as Mannco are focused on developing new technologies to produce low cost, energy efficient and exceptional quality (EQ) biosolids.
The Global Biosolids Market is Segmented as Below:
Product Coverage
- Class A
- Class B
- Class A (EQ)
Application Coverage
- Agriculture
- Forestry
- Land Reclamation
- (Construction Materials, Energy Generation etc.)
Geographical Coverage
- North America
- U.S.
- Canada
- Europe
- Germany
- France
- UK
- Italy
- Spain
- Russia
- Rest of Europe
- Asia Pacific
- China
- Japan
- India
- Australia and New Zealand
- Rest of Asia Pacific
- Latin America
- Brazil
- Mexico
- Rest of Latin America
- Middle East & Africa
- GCC
- South Africa
- Egypt
- Rest of Middle East & Africa
Leading Companies
- SUEZ
- Veolia Environnement S.A.
- Severn Trent Water
- Cambi
- Black & Veatch
- Cleanaway
- Englobe Corporation
- Casella Waste Systems Inc.
- FCC Group
- Remondis SE & Co. KG
Inside This Report You Will Find:
1. Executive Summary
2. Market Overview
3. Production Output, 2017 - 2020
4. Price Trends Analysis and Future Projects, 2017 - 2025
5. Global Biosolids Market Outlook, 2017 - 2025
6. North America Biosolids Market Outlook, 2017 - 2025
7. Europe Biosolids Market Outlook, 2017 - 2025
8. Asia Pacific Biosolids Market Outlook, 2017 - 2025
9. Latin America Biosolids Market Outlook, 2017 - 2025
10. Middle East & Africa Biosolids Market Outlook, 2017 - 2025
11. Competitive Landscape
12. Appendix
Post Sale Support, Research Updates & Offerings:
We value the trust shown by our customers in Fairfield Market Research. We support our clients through our post sale support, research updates and offerings.
- The report will be prepared in a PPT format and will be delivered in a PDF format.
- Additionally, Market Estimation and Forecast numbers will be shared in Excel Workbook.
- If a report being sold was published over a year ago, we will offer a complimentary copy of the updated research report along with Market Estimation and Forecast numbers within 2-3 weeks’ time of the sale.
- If we update this research study within the next 2 quarters, post purchase of the report, we will offer a Complimentary copy of the updated Market Estimation and Forecast numbers in Excel Workbook.
- If there is a geopolitical conflict, pandemic, recession, and the like which can impact global economic scenario and business activity, which might entirely alter the market dynamics or future projections in the industry, we will create a Research Update upon your request at a nominal charge.
1. Executive Summary
1.1. Global Biosolids Market Snapshot
1.2. Future Projections
1.3. Key Market Trends
1.4. Analyst Recommendations
2. Market Overview
2.1. Market Definitions and Segmentations
2.2. Market Dynamics
2.2.1. Drivers
2.2.2. Restraints
2.2.3. Market Opportunities
2.3. Biosolids Management Components
2.4. Porter’s Five Forces Analysis
2.5. Covid-19 Impact Analysis
2.5.1. Supply
2.5.2. Demand
2.6. Economic Overview
3. Production Output, 2017 - 2020
4. Price Trends Analysis and Future Projects, 2017 - 2025
4.1. Price Trends Analysis and Future Projects, by Product, 2017 - 2025
4.2. Regional Average Price Analysis, 2017 - 2025
5. Global Biosolids Market Outlook, 2017 - 2025
5.1. Global Biosolids Market Outlook, by Product, Volume (Kilo Tons) and Value (US$ Mn), 2017 - 2025
5.1.1. Key Highlights
5.1.1.1. Class A
5.1.1.2. Class B
5.1.1.3. Class A (EQ)
5.2. Global Biosolids Market Outlook, by Application, Volume (Kilo Tons) and Value (US$ Mn), 2017 - 2025
5.2.1. Key Highlights
5.2.1.1. Agriculture
5.2.1.2. Forestry
5.2.1.3. Land Reclamation
5.2.1.4. Misc. (Construction Materials, Energy Generation etc.)
5.3. Global Biosolids Market Outlook, by Region, Volume (Kilo Tons) and Value (US$ Mn), 2017 - 2025
5.3.1. Key Highlights
5.3.1.1. North America
5.3.1.2. Europe
5.3.1.3. Asia Pacific
5.3.1.4. Latin America
5.3.1.5. Middle East & Africa
6. North America Biosolids Market Outlook, 2017 - 2025
6.1. North America Biosolids Market Outlook, by Product, Volume (Kilo Tons) and Value (US$ Mn), 2017 - 2025
6.1.1. Key Highlights
6.1.1.1. Class A
6.1.1.2. Class B
6.1.1.3. Class A (EQ)
6.1.2. BPS Analysis/Market Attractiveness Analysis
6.2. North America Biosolids Market Outlook, by Application, Volume (Kilo Tons) and Value (US$ Mn), 2017 - 2025
6.2.1. Key Highlights
6.2.1.1. Agriculture
6.2.1.2. Forestry
6.2.1.3. Land Reclamation
6.2.1.4. Misc. (Construction Materials, Energy Generation etc.)
6.2.2. BPS Analysis/Market Attractiveness Analysis
6.3. North America Biosolids Market Outlook, by Country, Volume (Kilo Tons) and Value (US$ Mn), 2017 - 2025
6.3.1. Key Highlights
6.3.1.1. U.S. Biosolids Market by Product, Volume (Kilo Tons) and Value (US$ Mn), 2017 - 2025
6.3.1.2. U.S. Biosolids Market by Application, Volume (Kilo Tons) and Value (US$ Mn), 2017 - 2025
6.3.1.3. Canada Biosolids Market by Product, Volume (Kilo Tons) and Value (US$ Mn), 2017 - 2025
6.3.1.4. Canada Biosolids Market by Application, Volume (Kilo Tons) and Value (US$ Mn), 2017 - 2025
6.3.2. BPS Analysis/Market Attractiveness Analysis
7. Europe Biosolids Market Outlook, 2017 - 2025
7.1. Europe Biosolids Market Outlook, by Product, Volume (Kilo Tons) and Value (US$ Mn), 2017 - 2025
7.1.1. Key Highlights
7.1.1.1. Class A
7.1.1.2. Class B
7.1.1.3. Class A (EQ)
7.1.2. BPS Analysis/Market Attractiveness Analysis
7.2. Europe Biosolids Market Outlook, by Application, Volume (Kilo Tons) and Value (US$ Mn), 2017 - 2025
7.2.1. Key Highlights
7.2.1.1. Agriculture
7.2.1.2. Forestry
7.2.1.3. Land Reclamation
7.2.1.4. Misc. (Construction Materials, Energy Generation etc.)
7.2.2. BPS Analysis/Market Attractiveness Analysis
7.3. Europe Biosolids Market Outlook, by Country, Volume (Kilo Tons) and Value (US$ Mn), 2017 - 2025
7.3.1. Key Highlights
7.3.1.1. Germany Biosolids Market by Product, Volume (Kilo Tons) and Value (US$ Mn), 2017 - 2025
7.3.1.2. Germany Biosolids Market by Application, Volume (Kilo Tons) and Value (US$ Mn), 2017 - 2025
7.3.1.3. U.K. Biosolids Market by Product, Volume (Kilo Tons) and Value (US$ Mn), 2017 - 2025
7.3.1.4. U.K. Biosolids Market by Application, Volume (Kilo Tons) and Value (US$ Mn), 2017 - 2025
7.3.1.5. France Biosolids Market by Product, Volume (Kilo Tons) and Value (US$ Mn), 2017 - 2025
7.3.1.6. France Biosolids Market by Application, Volume (Kilo Tons) and Value (US$ Mn), 2017 - 2025
7.3.1.7. Italy Biosolids Market by Product, Volume (Kilo Tons) and Value (US$ Mn), 2017 - 2025
7.3.1.8. Italy Biosolids Market by Application, Volume (Kilo Tons) and Value (US$ Mn), 2017 - 2025
7.3.1.9. Spain Biosolids Market by Product, Volume (Kilo Tons) and Value (US$ Mn), 2017 - 2025
7.3.1.10. Spain Biosolids Market by Application, Volume (Kilo Tons) and Value (US$ Mn), 2017 - 2025
7.3.1.11. Russia Biosolids Market by Product, Volume (Kilo Tons) and Value (US$ Mn), 2017 - 2025
7.3.1.12. Russia Biosolids Market by Application, Volume (Kilo Tons) and Value (US$ Mn), 2017 - 2025
7.3.1.13. Rest of Europe Biosolids Market by Product, Volume (Kilo Tons) and Value (US$ Mn), 2017 - 2025
7.3.1.14. Rest of Europe Biosolids Market by Application, Volume (Kilo Tons) and Value (US$ Mn), 2017 - 2025
7.3.2. BPS Analysis/Market Attractiveness Analysis
8. Asia Pacific Biosolids Market Outlook, 2017 - 2025
8.1. Asia Pacific Biosolids Market Outlook, by Product, Volume (Kilo Tons) and Value (US$ Mn), 2017 - 2025
8.1.1. Key Highlights
8.1.1.1. Class A
8.1.1.2. Class B
8.1.1.3. Class A (EQ)
8.1.2. BPS Analysis/Market Attractiveness Analysis
8.2. Asia Pacific Biosolids Market Outlook, by Application, Volume (Kilo Tons) and Value (US$ Mn), 2017 - 2025
8.2.1. Key Highlights
8.2.1.1. Agriculture
8.2.1.2. Forestry
8.2.1.3. Land Reclamation
8.2.1.4. Misc. (Construction Materials, Energy Generation etc.)
8.2.2. BPS Analysis/Market Attractiveness Analysis
8.3. Asia Pacific Biosolids Market Outlook, by Country, Volume (Kilo Tons) and Value (US$ Mn), 2017 - 2025
8.3.1. Key Highlights
8.3.1.1. China Biosolids Market by Product, Volume (Kilo Tons) and Value (US$ Mn), 2017 - 2025
8.3.1.2. China Biosolids Market by Application, Volume (Kilo Tons) and Value (US$ Mn), 2017 - 2025
8.3.1.3. Japan Biosolids Market by Product, Volume (Kilo Tons) and Value (US$ Mn), 2017 - 2025
8.3.1.4. Japan Biosolids Market by Application, Volume (Kilo Tons) and Value (US$ Mn), 2017 - 2025
8.3.1.5. South Korea Biosolids Market by Product, Volume (Kilo Tons) and Value (US$ Mn), 2017 - 2025
8.3.1.6. South Korea Biosolids Market by Application, Volume (Kilo Tons) and Value (US$ Mn), 2017 - 2025
8.3.1.7. India Biosolids Market by Product, Volume (Kilo Tons) and Value (US$ Mn), 2017 - 2025
8.3.1.8. India Biosolids Market by Application, Volume (Kilo Tons) and Value (US$ Mn), 2017 - 2025
8.3.1.9. Australia and New Zealand Biosolids Market by Product, Volume (Kilo Tons) and Value (US$ Mn), 2017 - 2025
8.3.1.10. Australia and New Zealand Biosolids Market by Application, Volume (Kilo Tons) and Value (US$ Mn), 2017 - 2025
8.3.1.11. Rest of Asia Pacific Biosolids Market by Product, Volume (Kilo Tons) and Value (US$ Mn), 2017 - 2025
8.3.1.12. Rest of Asia Pacific Biosolids Market by Application, Volume (Kilo Tons) and Value (US$ Mn), 2017 - 2025
8.3.2. BPS Analysis/Market Attractiveness Analysis
9. Latin America Biosolids Market Outlook, 2017 - 2025
9.1. Latin America Biosolids Market Outlook, by Product, Volume (Kilo Tons) and Value (US$ Mn), 2017 - 2025
9.1.1. Key Highlights
9.1.1.1. Class A
9.1.1.2. Class B
9.1.1.3. Class A (EQ)
9.1.2. BPS Analysis/Market Attractiveness Analysis
9.2. Latin America Biosolids Market Outlook, by Application, Volume (Kilo Tons) and Value (US$ Mn), 2017 - 2025
9.2.1. Key Highlights
9.2.1.1. Agriculture
9.2.1.2. Forestry
9.2.1.3. Land Reclamation
9.2.1.4. Misc. (Construction Materials, Energy Generation etc.)
9.2.2. BPS Analysis/Market Attractiveness Analysis
9.3. Latin America Biosolids Market Outlook, by Country, Volume (Kilo Tons) and Value (US$ Mn), 2017 - 2025
9.3.1. Key Highlights
9.3.1.1. Brazil Biosolids Market by Product, Volume (Kilo Tons) and Value (US$ Mn), 2017 - 2025
9.3.1.2. Brazil Biosolids Market by Application, Volume (Kilo Tons) and Value (US$ Mn), 2017 - 2025
9.3.1.3. Mexico Biosolids Market by Product, Volume (Kilo Tons) and Value (US$ Mn), 2017 - 2025
9.3.1.4. Mexico Biosolids Market by Application, Volume (Kilo Tons) and Value (US$ Mn), 2017 - 2025
9.3.1.5. Rest of Latin America Biosolids Market by Product, Volume (Kilo Tons) and Value (US$ Mn), 2017 - 2025
9.3.1.6. Rest of Latin America Biosolids Market by Application, Volume (Kilo Tons) and Value (US$ Mn), 2017 - 2025
9.3.2. BPS Analysis/Market Attractiveness Analysis
10. Middle East & Africa Biosolids Market Outlook, 2017 - 2025
10.1. Middle East & Africa Biosolids Market Outlook, by Product, Volume (Kilo Tons) and Value (US$ Mn), 2017 - 2025
10.1.1. Key Highlights
10.1.1.1. Class A
10.1.1.2. Class B
10.1.1.3. Class A (EQ)
10.1.2. BPS Analysis/Market Attractiveness Analysis
10.2. Middle East & Africa Biosolids Market Outlook, by Application, Volume (Kilo Tons) and Value (US$ Mn), 2017 - 2025
10.2.1. Key Highlights
10.2.1.1. Agriculture
10.2.1.2. Forestry
10.2.1.3. Land Reclamation
10.2.1.4. Misc. (Construction Materials, Energy Generation etc.)
10.2.2. BPS Analysis/Market Attractiveness Analysis
10.3. Middle East & Africa Biosolids Market Outlook, by Country, Volume (Kilo Tons) and Value (US$ Mn), 2017 - 2025
10.3.1. Key Highlights
10.3.1.1. GCC Biosolids Market by Product, Volume (Kilo Tons) and Value (US$ Mn), 2017 - 2025
10.3.1.2. GCC Biosolids Market by Application, Volume (Kilo Tons) and Value (US$ Mn), 2017 - 2025
10.3.1.3. South Africa Biosolids Market by Product, Volume (Kilo Tons) and Value (US$ Mn), 2017 - 2025
10.3.1.4. South Africa Biosolids Market by Application, Volume (Kilo Tons) and Value (US$ Mn), 2017 - 2025
10.3.1.5. Egypt Biosolids Market by Product, Volume (Kilo Tons) and Value (US$ Mn), 2017 - 2025
10.3.1.6. Egypt Biosolids Market by Application, Volume (Kilo Tons) and Value (US$ Mn), 2017 - 2025
10.3.1.7. Rest of Middle East & Africa Biosolids Market by Product, Volume (Kilo Tons) and Value (US$ Mn), 2017 - 2025
10.3.1.8. Rest of Middle East & Africa Biosolids Market by Application, Volume (Kilo Tons) and Value (US$ Mn), 2017 - 2025
10.3.2. BPS Analysis/Market Attractiveness Analysis
11. Competitive Landscape
11.1. Biosolids Market Structure
11.2. Company Market Share Analysis, 2019
11.3. Company Profiles
11.3.1. SUEZ
11.3.1.1. Company Overview
11.3.1.2. Product Portfolio
11.3.1.3. Financial Overview
11.3.1.4. Business Strategies and Development
11.3.2. Veolia Environnement S.A.
11.3.2.1. Company Overview
11.3.2.2. Product Portfolio
11.3.2.3. Financial Overview
11.3.2.4. Business Strategies and Development
11.3.3. Severn Trent Water
11.3.3.1. Company Overview
11.3.3.2. Product Portfolio
11.3.3.3. Financial Overview
11.3.3.4. Business Strategies and Development
11.3.4. Cambi
11.3.4.1. Company Overview
11.3.4.2. Product Portfolio
11.3.4.3. Financial Overview
11.3.4.4. Business Strategies and Development
11.3.5. Black & Veatch
11.3.5.1. Company Overview
11.3.5.2. Product Portfolio
11.3.5.3. Financial Overview
11.3.5.4. Business Strategies and Development
11.3.6. Cleanaway
11.3.6.1. Company Overview
11.3.6.2. Product Portfolio
11.3.6.3. Financial Overview
11.3.6.4. Business Strategies and Development
11.3.7. Englobe Corporation
11.3.7.1. Company Overview
11.3.7.2. Product Portfolio
11.3.7.3. Financial Overview
11.3.7.4. Business Strategies and Development
11.3.8. Casella Waste Systems Inc.
11.3.8.1. Company Overview
11.3.8.2. Product Portfolio
11.3.8.3. Financial Overview
11.3.8.4. Business Strategies and Development
11.3.9. FCC Group
11.3.9.1. Company Overview
11.3.9.2. Product Portfolio
11.3.9.3. Financial Overview
11.3.9.4. Business Strategies and Development
11.3.10. Remondis SE & Co. KG
11.3.10.1. Company Overview
11.3.10.2. Product Portfolio
11.3.10.3. Financial Overview
11.3.10.4. Business Strategies and Development
12. Appendix
12.1. Research Methodology
12.2. Report Assumptions
12.3. Acronyms and Abbreviations
|
BASE YEAR |
HISTORICAL DATA |
FORECAST PERIOD |
UNITS |
|||
|
2019 |
2017 - 2019 |
2021 - 2025 |
Value: US$ Million Volume: Kilo Tons |
|||
|
REPORT FEATURES |
DETAILS |
|
Product Coverage |
|
|
Application Coverage |
|
|
Geographical Coverage |
|
|
Leading Companies |
|
|
Report Highlights |
Market Estimates and Forecast, Market Dynamics, Industry Trends, Competition Landscape, Product-, Application-, Region-, Country-wise Trends & Analysis, COVID-19 Impact Analysis (Demand and Supply), Key Trends |