



High Speed Rail Market
High Speed Rail Market Size, Share, Insights, Competitive Landscape, and Forecast 2026 to 2033
High Speed Rail Market Size and Trend Analysis
What Is Driving High Speed Rail Spending Through 2033?
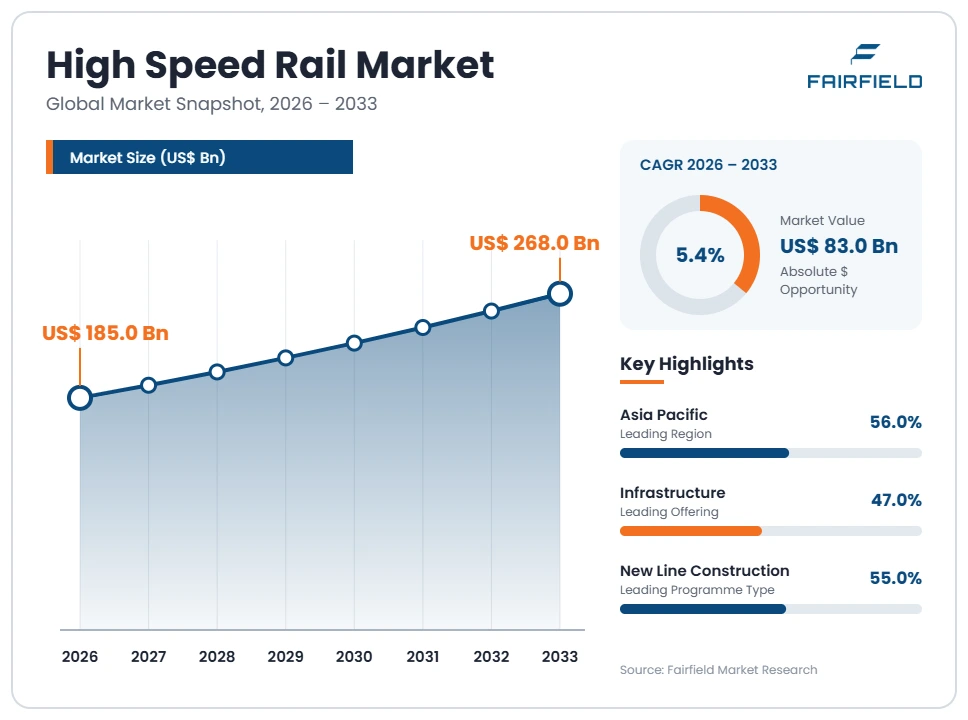
The global high speed rail market size is expected to be valued at US$ 185.0 billion in 2026 and projected to reach US$ 268.0 billion by 2033, growing at a CAGR of 5.4% between 2026 and 2033.
The figure measures annual spend across rolling stock, infrastructure, signalling and train control, and operations and maintenance services. It follows the UIC convention, counting new lines designed for 250 km/h and above together with upgraded lines carrying services at 200 km/h and above. Between 2020 and 2025 spending grew at a CAGR of about 4.6%, held back by construction delays and post-pandemic ridership recovery. Three factors support the forecast: committed national construction programmes in a small group of countries, digital train control rollout across legacy networks, and replacement of ageing trainsets on mature systems. This is state investment spending rather than consumer demand, so the pipeline moves with public budgets.
Key Report Takeaways
- By Offering: Infrastructure held 47% share in 2026, while signalling and train control is projected to expand at a 7.9% CAGR through 2033, as digital train control replaces incompatible national systems on existing lines.
- By Speed Class: Services at 250–299 km/h held 46% share in 2026, while very high speed operation above 300 km/h is projected to grow at a 6.6% CAGR through 2033, as new alignments are designed for higher line speeds from the outset.
- By Programme Type: New line construction held 55% share in 2026, while renewal and replacement is projected to rise at a 7.2% CAGR through 2033, because the earliest high speed assets have reached the end of their design life.
- By Funding Model: Public funding held 74% share in 2026, while public-private partnership structures are projected to advance at a 7.6% CAGR through 2033, as treasuries seek to move construction and availability risk off the public balance sheet.
- By Geography: Asia Pacific held 56% share in 2026, while Middle East & Africa is projected to record an 8.4% CAGR through 2033, from a small base of national network programmes now entering construction.
Global High Speed Rail Market Trends and Insights
Drivers Impact Analysis
Both principal drivers are policy decisions rather than market responses to passenger demand.
| Driver | Impact on CAGR Forecast | Geographic Relevance | Impact Timeline |
| Committed national construction programmes funded from public budgets | High | Asia Pacific, Middle East & Africa | Long term (≥4 years) |
| Digital train control migration across existing and new high speed lines | High | Europe, Asia Pacific | Medium term (2–4 years) |
State Construction Programmes, Not Passenger Demand, Set the Spending Pipeline
High speed rail is built when a government decides to fund it, so the addressable market is a pipeline of national programmes rather than a demand curve. A small group of countries accounts for most global spend, and within those countries the yearly figure tracks the construction schedule of approved projects. Suppliers forecast from published programme commitments, not from ridership growth.
The mechanism is political and regional rather than financial. Governments approve these schemes to connect secondary cities, relieve congested conventional corridors, shift traffic from short-haul aviation and distribute regional development, which means appraisal weighs wider economic benefit alongside fare revenue. The European Union Trans-European Transport Network framework sets core network deadlines that member states plan against, and national transport budgets then convert those commitments into contracted civil works and vehicle orders.
Digital Train Control Migration Creates a Distinct Signalling Spend Wave
Signalling and train control is the fastest-growing part of the market, and the cause is a deliberate migration programme rather than traffic growth. Networks are replacing incompatible national systems with a common standard so that trains can cross borders without multiple onboard systems. The work covers trackside equipment, onboard fitment of existing fleets, radio infrastructure, testing and authorisation of each new configuration.
The mechanism is an explicit deployment obligation. The European Rail Traffic Management System and its ETCS component are mandated for new and upgraded lines under the European Union technical specifications for interoperability, with a published deployment plan setting the sequence for core corridors. The European Union Agency for Railways authorises trackside projects and vehicle types, which concentrates this spend into defined, dated work packages that suppliers can plan engineering capacity around.
Restraints Impact Analysis
Both restraints act on programme approval rather than on supplier capability.
| Restraint | Impact on CAGR Forecast | Geographic Relevance | Impact Timeline |
| Cost overruns and schedule slippage on land acquisition, tunnelling and civil works | High | Global | Long term (≥4 years) |
| Weak farebox cover and narrow distance-band economics limit viable corridors | Medium | Europe, North America, Latin America | Long term (≥4 years) |
Cost Overruns on Civil Works Make New Programme Approval Harder
Cost growth and schedule slippage are the norm rather than the exception on these programmes, and they directly slow the approval of the next ones. Several high-profile schemes have been rescoped, phased or curtailed after estimates rose during detailed design, which removes contracted work from the supplier pipeline and lengthens the gap between successive vehicle and systems orders.
The cost sources are specific and civil rather than technological. Land acquisition in built-up corridors, tunnelling through uncertain ground, viaducts, station rebuilding and utility diversion dominate the capital estimate, and all four are priced before ground conditions are fully known. Long consenting and public inquiry processes add further escalation on top of that. Environmental and noise impact requirements for new rail infrastructure can also force alignment changes or additional mitigation structures well after a budget has been published.
Weak Farebox Cover and Distance-Band Economics Limit Viable Corridors
Few high speed lines recover their capital cost from fares, which caps the number of corridors that can be justified anywhere. The economics only favour high speed rail within a distance band of roughly 300 to 800 kilometres, between city pairs with enough population density, where the journey beats flying once airport access and security time are counted. Outside that band, aviation or conventional rail wins.
The underlying causes are operating and financing structure. Debt service on civil works dominates the cost base, ridership forecasts carry wide error margins, and competing conventional rail upgrades deliver part of the benefit for a fraction of the outlay. Long lead times compound the problem, since programmes span several electoral cycles and remain exposed to policy reversal before any revenue arrives. Interoperability and signalling migration costs add further to legacy network business cases.
Market Opportunities
Two pools sit outside new line construction and are less exposed to programme cancellation.
Trainset Replacement on Mature Networks Opens a Recurring Vehicle Pool
Fleet replacement on established high speed networks is a predictable revenue pool that does not depend on new construction approval. The earliest high speed vehicles have reached the end of their design life, and their operators must order successors to hold service levels, which creates repeat orders in countries where no further route building is planned.
Rolling stock manufacturers and their traction, braking and interior suppliers can capture this work, with national operators and leasing companies forming the customer group. The demand arises from asset ageing rather than traffic growth, which makes it more stable than greenfield work. Replacement vehicles must meet current rolling stock and energy technical specifications for interoperability and carry current train control equipment, which raises content value per vehicle compared with the sets being retired.
Long-Life Maintenance and Depot Contracts Open an Annuity Revenue Pool
Maintenance over a long asset life is the steadiest revenue pool in this market, since high speed vehicles and track remain in service for decades and require scheduled heavy overhaul throughout. Multi-year availability contracts attached to vehicle supply convert a one-off sale into predictable annual income, with depot equipment, spares holdings and heavy overhaul work included in the scope.
Vehicle manufacturers, independent maintenance providers and depot equipment suppliers can capture it, with operators and infrastructure managers as customers. The demand is created by safety case obligations: national railway safety authorities require documented maintenance regimes and competent entities in charge of maintenance, which favours suppliers holding design authority. Condition monitoring and data services attached to these contracts raise margin above the parts and labour base, and extend the supplier relationship across the whole asset life.
Segment Analysis
- By Offering: Infrastructure Dominates Spend While Signalling Grows Fastest
Infrastructure held 47% share in 2026, the largest share of annual spend, because track and slab track, electrification, overhead line and the civil works and stations attributable to the system absorb most of the capital in any construction programme. Earthworks, tunnels and viaducts alone can exceed the combined cost of vehicles and control systems on a difficult alignment.
Signalling and train control is the fastest-growing offering at a 7.9% CAGR through 2033, despite holding a smaller share, driven by migration to common digital train control on both new and legacy lines. Onboard retrofit of existing fleets adds volume beyond trackside work.
Rolling stock and operations and maintenance services make up the balance, with services growing steadily as installed fleets age. The implication is that suppliers with signalling and services positions see smoother revenue than those dependent on vehicle orders alone.
- By Speed Class: Mid-Band Services Lead While Very High Speed Expands Quickest
Services operating at 250–299 km/h held 46% share in 2026, because most of the installed high speed network was designed for this band and because it balances journey time against energy use, track wear and construction cost. Lines in this class also connect more readily to conventional networks at their ends.
Very high speed operation above 300 km/h is the fastest-growing class at a 6.6% CAGR through 2033, as new alignments are designed for higher line speeds from the start and some existing routes are cleared for faster running after signalling upgrade.
Higher speed services at 200–249 km/h, typically on upgraded conventional lines, hold the remainder and serve regional corridors where full high speed construction cannot be justified. The implication is that design speed is chosen against terrain and corridor length, not as a national statement of capability.
- By Programme Type: New Construction Leads While Renewal Accelerates
New line construction held 55% share in 2026, because countries still building their networks dominate global spending and because greenfield alignments carry the heaviest civil works content. This share is also the most volatile part of the market, since a single rescoped programme can move the annual figure materially.
Renewal and replacement is the fastest-growing programme type at a 7.2% CAGR through 2033. The first generation of high speed track, electrification and vehicles has reached the point where overhaul and replacement are unavoidable, and this work proceeds regardless of whether new routes are approved.
Network extension and upgrade covers the balance, adding branches, connecting chords and station capacity to existing systems. The implication for suppliers is that renewal work offers lower unit value but far greater forecast reliability than new construction.
- By Funding Model: Public Budgets Lead While Partnership Structures Gain Share
Public funding held 74% share in 2026, confirming that this market is a state investment decision. Governments carry the construction and demand risk because few lines recover capital cost from fares, and sovereign borrowing remains the cheapest way to finance assets with design lives measured in decades.
Public-private partnership structures are the fastest-growing funding model at a 7.6% CAGR through 2033, as treasuries seek to transfer construction and availability risk and to spread payments across the operating period. Availability-based payment mechanisms are more common than revenue risk transfer, since ridership forecasts remain unreliable.
Concession and private investment accounts for the remainder and is concentrated in a few corridors with unusually strong traffic. The implication is that contractors increasingly need balance sheet capacity and financing expertise alongside engineering capability to bid credibly.
Geography Analysis
- North America Builds Selectively Against Strong Aviation and Highway Competition
North America held 6% share in 2026, a small position for a large economy, because low population density outside a few corridors and entrenched aviation and highway travel weaken the business case. The United States has a limited number of corridors within the distance band where high speed services compete well, and land acquisition through developed areas is slow and costly.
Federal and state programmes support corridor development and planning work, while the Federal Railroad Administration sets the safety and equipment rules that govern vehicle design and operation. Canada has advanced corridor planning studies. Growth comes from planning, design and early civil works rather than from vehicle deliveries. The barrier is political continuity, since programmes here have repeatedly outlasted the administrations that approved them.
- Europe Combines Network Extension With Costly Signalling Migration
Europe held 27% share in 2026, second largest, and its spending profile differs from other regions by weighting signalling and renewal more heavily than greenfield construction. France, Spain, Italy and Germany operate the largest networks, and much of their current work extends, upgrades and renews lines rather than opening new corridors.
Regulation shapes spend directly. The technical specifications for interoperability covering infrastructure, rolling stock, energy and control-command and signalling set the design rules, and the European Union Agency for Railways authorises vehicles and trackside projects. The Trans-European Transport Network framework sets corridor deadlines that member states budget against. The main cost pressure is migrating legacy national signalling to ETCS while keeping existing traffic running, which extends programme duration and raises possession costs.
- Which Region Is Leading the High Speed Rail Market?
Asia Pacific leads with 56% share in 2026, because China has built and continues to extend by far the largest high speed network in the world and sustains the highest annual construction spend of any country. Scale brings standardised designs, domestic supply chains and repeat civil works contracts that hold unit costs below those seen elsewhere.
Japan continues extending its network and replacing early fleets, Korea and Taiwan operate mature systems, and India has a major corridor under construction with associated depot and training investment. State ownership of infrastructure and vehicle procurement keeps decision-making centralised, which allows long programmes to proceed across electoral cycles. The change shaping the region is a gradual shift of spend from pure route building toward maintenance, renewal and signalling as networks mature.
- Latin America Keeps High Speed Plans Largely at Study and Appraisal Stage
Latin America held 4% share in 2026, the smallest regional position, with most activity confined to feasibility studies, corridor appraisal and early procurement rather than construction. Brazil and Mexico account for most of the spend through studies and limited works on priority corridors.
The barriers are financing capacity, currency exposure on imported vehicles and systems, and the competing claim of urban and conventional rail investment that serves more passengers per unit of capital. Long project timelines sit poorly with fiscal cycles. The opportunity is a staged approach, upgrading existing conventional corridors for higher speed running first, which delivers part of the benefit at lower cost and builds the engineering and regulatory capability needed for later work.
- Which Region Is Growing Fastest in the High Speed Rail Market?
Middle East & Africa is the fastest-growing region at an 8.4% CAGR through 2033, from 7% share in 2026, because several national network programmes have moved from planning into construction at the same time. Saudi Arabia, Egypt and Morocco carry most of this activity, supported by sovereign funding and export credit.
Growth rates are high partly because the base is small, and the work is concentrated in civil engineering, electrification and initial fleet supply rather than in renewal. Favourable terrain on several alignments keeps civil costs below those of mountainous corridors elsewhere. The barriers are local skills availability, climate effects on track and vehicle systems, and reliance on imported technology. The opportunity is long maintenance and training contracts attached to initial system supply.
Competitive Landscape
The market is highly concentrated at the system level and moderately concentrated below it. A small number of rolling stock and signalling groups can deliver complete high speed systems with the required safety authorisations, and barriers to entry are severe: reference fleets in commercial service, type approval, long-cycle engineering capability and balance sheet strength to carry multi-year programmes. Civil works are less concentrated, with large national contractors and joint ventures competing for tunnelling, viaduct and station packages, though only a handful operate across multiple continents.
Competition is decided on whole-life cost, programme delivery record and compliance rather than on headline vehicle price. Buyers examine guaranteed availability, energy consumption per seat, maintenance intervals, authorisation risk and local content commitments, since most procurements carry industrial participation requirements. Financing capability matters increasingly as partnership structures spread. Entry mostly happens through joint ventures and technology transfer agreements with domestic manufacturers in countries building their first networks, which creates new regional suppliers over time rather than new global ones.
Strategic activity centres on consolidation among signalling and train control suppliers, on long-term framework agreements that bundle vehicle supply with multi-decade maintenance, and on building local assembly and depot capability inside customer countries. Bundled supply and maintenance matters competitively because it locks in revenue across the asset life and gives the original manufacturer design authority over modifications. Local content commitments matter because they are frequently decisive in tender evaluation.
Vendor strategy is moving toward platform standardisation across speed classes, digital train control capability as a core competence, and service revenue as a hedge against the lumpiness of vehicle orders. Suppliers also position for renewal work on networks where new construction has stopped.
Recent Industry Developments
- September 2023: The European Union’s revised technical specification for interoperability for control-command and signalling took effect, updating the European Rail Traffic Management System deployment requirements – setting the technical baseline that trackside and onboard signalling tenders must now meet.
- July 2024: The revised Trans-European Transport Network Regulation entered into force in the European Union, setting staged completion deadlines for the core and extended core networks and minimum line speed requirements for core passenger lines – converting corridor policy into dated national planning obligations.
- November 2025: The European Commission set out a plan for developing high speed rail connections between major European cities, addressing missing links, interoperability barriers, ticketing and financing – signalling continued policy support for network extension across member states.
Companies Covered in the Report
- CRRC Corporation Limited
- Alstom SA
- Siemens Mobility GmbH
- Hitachi Rail
- Stadler Rail AG
- Talgo S.A.
- Hyundai Rotem Company
- Kawasaki Heavy Industries, Ltd.
- China Railway Construction Corporation Limited
- China Railway Group Limited
- Vinci SA
- Ferrovial SE
- Knorr-Bremse AG
- Vossloh AG
High Speed Rail Market Report Scope
| Metric | Value |
| Study Period | 2020–2033 |
| Market Size 2026 | US$ 185.0 Billion |
| Market Size 2033 | US$ 268.0 Billion |
| CAGR 2026–2033 | 5.4% |
| Absolute Dollar Opportunity | US$ 83.0 Billion |
| Largest Market | Asia Pacific (56% share in 2026) |
| Fastest-Growing Market | Middle East & Africa (8.4% CAGR) |
| Market Concentration | High |
| Major Players | CRRC Corporation Limited, Alstom SA, Siemens Mobility GmbH, Hitachi Rail, Stadler Rail AG |
High Speed Rail Market Segmentation
Offering
- Rolling Stock
- Infrastructure
- Signalling and Train Control
- Operations and Maintenance Services
Speed Class
- Higher Speed (200–249 km/h)
- High Speed (250–299 km/h)
- Very High Speed (300 km/h and Above)
Programme Type
- New Line Construction
- Network Extension and Upgrade
- Renewal and Replacement
Funding Model
- Public Funding
- Public-Private Partnership
- Concession and Private Investment
Regions
- North America
- Europe
- Asia Pacific
- Latin America
- Middle East & Africa
- Executive Summary
- Global High Speed Rail Market Snapshot
- Future Projections, 2026-2033
- Key Market Trends
- Regional Snapshot
- Market Overview
- Market Definition and Report Scope
- Historical Market Trends, 2020-2025
- Market Dynamics
- Drivers Impact Analysis
- State Construction Programmes, Not Passenger Demand, Set the Spending Pipeline
- Digital Train Control Migration Creates a Distinct Signalling Spend Wave
- Restraints Impact Analysis
- Cost Overruns on Civil Works Make New Programme Approval Harder
- Weak Farebox Cover and Distance-Band Economics Limit Viable Corridors
- Market Opportunities
- Trainset Replacement on Mature Networks Opens a Recurring Vehicle Pool
- Long-Life Maintenance and Depot Contracts Open an Annuity Revenue Pool
- Drivers Impact Analysis
- Global High Speed Rail Market Outlook, 2020-2033
- Global High Speed Rail Market Outlook, by Offering, Value (US$ Billion), 2020-2033
- Rolling Stock
- Infrastructure
- Signalling and Train Control
- Operations and Maintenance Services
- Global High Speed Rail Market Outlook, by Speed Class, Value (US$ Billion), 2020-2033
- Higher Speed (200–249 km/h)
- High Speed (250–299 km/h)
- Very High Speed (300 km/h and Above)
- Global High Speed Rail Market Outlook, by Programme Type, Value (US$ Billion), 2020-2033
- New Line Construction
- Network Extension and Upgrade
- Renewal and Replacement
- Global High Speed Rail Market Outlook, by Funding Model, Value (US$ Billion), 2020-2033
- Public Funding
- Public-Private Partnership
- Concession and Private Investment
- Global High Speed Rail Market Outlook, by Region, Value (US$ Billion), 2020-2033
- North America
- Europe
- Asia Pacific
- Latin America
- Middle East & Africa
- Global High Speed Rail Market Outlook, by Offering, Value (US$ Billion), 2020-2033
- North America High Speed Rail Market Outlook, 2020-2033
- North America High Speed Rail Market Outlook, by Offering, Value (US$ Billion), 2020-2033
- Rolling Stock
- Infrastructure
- Signalling and Train Control
- Operations and Maintenance Services
- North America High Speed Rail Market Outlook, by Speed Class, Value (US$ Billion), 2020-2033
- Higher Speed (200–249 km/h)
- High Speed (250–299 km/h)
- Very High Speed (300 km/h and Above)
- North America High Speed Rail Market Outlook, by Programme Type, Value (US$ Billion), 2020-2033
- New Line Construction
- Network Extension and Upgrade
- Renewal and Replacement
- North America High Speed Rail Market Outlook, by Funding Model, Value (US$ Billion), 2020-2033
- Public Funding
- Public-Private Partnership
- Concession and Private Investment
- North America High Speed Rail Market Outlook, by Country, Value (US$ Billion), 2020-2033
- United States High Speed Rail Market Outlook, by Offering, 2020-2033
- United States High Speed Rail Market Outlook, by Speed Class, 2020-2033
- United States High Speed Rail Market Outlook, by Programme Type, 2020-2033
- United States High Speed Rail Market Outlook, by Funding Model, 2020-2033
- Canada High Speed Rail Market Outlook, by Offering, 2020-2033
- Canada High Speed Rail Market Outlook, by Speed Class, 2020-2033
- Canada High Speed Rail Market Outlook, by Programme Type, 2020-2033
- Canada High Speed Rail Market Outlook, by Funding Model, 2020-2033
- North America High Speed Rail Market Outlook, by Offering, Value (US$ Billion), 2020-2033
- Europe High Speed Rail Market Outlook, 2020-2033
- Europe High Speed Rail Market Outlook, by Offering, Value (US$ Billion), 2020-2033
- Rolling Stock
- Infrastructure
- Signalling and Train Control
- Operations and Maintenance Services
- Europe High Speed Rail Market Outlook, by Speed Class, Value (US$ Billion), 2020-2033
- Higher Speed (200–249 km/h)
- High Speed (250–299 km/h)
- Very High Speed (300 km/h and Above)
- Europe High Speed Rail Market Outlook, by Programme Type, Value (US$ Billion), 2020-2033
- New Line Construction
- Network Extension and Upgrade
- Renewal and Replacement
- Europe High Speed Rail Market Outlook, by Funding Model, Value (US$ Billion), 2020-2033
- Public Funding
- Public-Private Partnership
- Concession and Private Investment
- Europe High Speed Rail Market Outlook, by Country, Value (US$ Billion), 2020-2033
- France High Speed Rail Market Outlook, by Offering, 2020-2033
- France High Speed Rail Market Outlook, by Speed Class, 2020-2033
- France High Speed Rail Market Outlook, by Programme Type, 2020-2033
- France High Speed Rail Market Outlook, by Funding Model, 2020-2033
- Spain High Speed Rail Market Outlook, by Offering, 2020-2033
- Spain High Speed Rail Market Outlook, by Speed Class, 2020-2033
- Spain High Speed Rail Market Outlook, by Programme Type, 2020-2033
- Spain High Speed Rail Market Outlook, by Funding Model, 2020-2033
- Italy High Speed Rail Market Outlook, by Offering, 2020-2033
- Italy High Speed Rail Market Outlook, by Speed Class, 2020-2033
- Italy High Speed Rail Market Outlook, by Programme Type, 2020-2033
- Italy High Speed Rail Market Outlook, by Funding Model, 2020-2033
- Germany High Speed Rail Market Outlook, by Offering, 2020-2033
- Germany High Speed Rail Market Outlook, by Speed Class, 2020-2033
- Germany High Speed Rail Market Outlook, by Programme Type, 2020-2033
- Germany High Speed Rail Market Outlook, by Funding Model, 2020-2033
- Europe High Speed Rail Market Outlook, by Offering, Value (US$ Billion), 2020-2033
- Asia Pacific High Speed Rail Market Outlook, 2020-2033
- Asia Pacific High Speed Rail Market Outlook, by Offering, Value (US$ Billion), 2020-2033
- Rolling Stock
- Infrastructure
- Signalling and Train Control
- Operations and Maintenance Services
- Asia Pacific High Speed Rail Market Outlook, by Speed Class, Value (US$ Billion), 2020-2033
- Higher Speed (200–249 km/h)
- High Speed (250–299 km/h)
- Very High Speed (300 km/h and Above)
- Asia Pacific High Speed Rail Market Outlook, by Programme Type, Value (US$ Billion), 2020-2033
- New Line Construction
- Network Extension and Upgrade
- Renewal and Replacement
- Asia Pacific High Speed Rail Market Outlook, by Funding Model, Value (US$ Billion), 2020-2033
- Public Funding
- Public-Private Partnership
- Concession and Private Investment
- Asia Pacific High Speed Rail Market Outlook, by Country, Value (US$ Billion), 2020-2033
- China High Speed Rail Market Outlook, by Offering, 2020-2033
- China High Speed Rail Market Outlook, by Speed Class, 2020-2033
- China High Speed Rail Market Outlook, by Programme Type, 2020-2033
- China High Speed Rail Market Outlook, by Funding Model, 2020-2033
- Japan High Speed Rail Market Outlook, by Offering, 2020-2033
- Japan High Speed Rail Market Outlook, by Speed Class, 2020-2033
- Japan High Speed Rail Market Outlook, by Programme Type, 2020-2033
- Japan High Speed Rail Market Outlook, by Funding Model, 2020-2033
- Korea High Speed Rail Market Outlook, by Offering, 2020-2033
- Korea High Speed Rail Market Outlook, by Speed Class, 2020-2033
- Korea High Speed Rail Market Outlook, by Programme Type, 2020-2033
- Korea High Speed Rail Market Outlook, by Funding Model, 2020-2033
- Taiwan High Speed Rail Market Outlook, by Offering, 2020-2033
- Taiwan High Speed Rail Market Outlook, by Speed Class, 2020-2033
- Taiwan High Speed Rail Market Outlook, by Programme Type, 2020-2033
- Taiwan High Speed Rail Market Outlook, by Funding Model, 2020-2033
- India High Speed Rail Market Outlook, by Offering, 2020-2033
- India High Speed Rail Market Outlook, by Speed Class, 2020-2033
- India High Speed Rail Market Outlook, by Programme Type, 2020-2033
- India High Speed Rail Market Outlook, by Funding Model, 2020-2033
- Asia Pacific High Speed Rail Market Outlook, by Offering, Value (US$ Billion), 2020-2033
- Latin America High Speed Rail Market Outlook, 2020-2033
- Latin America High Speed Rail Market Outlook, by Offering, Value (US$ Billion), 2020-2033
- Rolling Stock
- Infrastructure
- Signalling and Train Control
- Operations and Maintenance Services
- Latin America High Speed Rail Market Outlook, by Speed Class, Value (US$ Billion), 2020-2033
- Higher Speed (200–249 km/h)
- High Speed (250–299 km/h)
- Very High Speed (300 km/h and Above)
- Latin America High Speed Rail Market Outlook, by Programme Type, Value (US$ Billion), 2020-2033
- New Line Construction
- Network Extension and Upgrade
- Renewal and Replacement
- Latin America High Speed Rail Market Outlook, by Funding Model, Value (US$ Billion), 2020-2033
- Public Funding
- Public-Private Partnership
- Concession and Private Investment
- Latin America High Speed Rail Market Outlook, by Country, Value (US$ Billion), 2020-2033
- Brazil High Speed Rail Market Outlook, by Offering, 2020-2033
- Brazil High Speed Rail Market Outlook, by Speed Class, 2020-2033
- Brazil High Speed Rail Market Outlook, by Programme Type, 2020-2033
- Brazil High Speed Rail Market Outlook, by Funding Model, 2020-2033
- Mexico High Speed Rail Market Outlook, by Offering, 2020-2033
- Mexico High Speed Rail Market Outlook, by Speed Class, 2020-2033
- Mexico High Speed Rail Market Outlook, by Programme Type, 2020-2033
- Mexico High Speed Rail Market Outlook, by Funding Model, 2020-2033
- Latin America High Speed Rail Market Outlook, by Offering, Value (US$ Billion), 2020-2033
- Middle East & Africa High Speed Rail Market Outlook, 2020-2033
- Middle East & Africa High Speed Rail Market Outlook, by Offering, Value (US$ Billion), 2020-2033
- Rolling Stock
- Infrastructure
- Signalling and Train Control
- Operations and Maintenance Services
- Middle East & Africa High Speed Rail Market Outlook, by Speed Class, Value (US$ Billion), 2020-2033
- Higher Speed (200–249 km/h)
- High Speed (250–299 km/h)
- Very High Speed (300 km/h and Above)
- Middle East & Africa High Speed Rail Market Outlook, by Programme Type, Value (US$ Billion), 2020-2033
- New Line Construction
- Network Extension and Upgrade
- Renewal and Replacement
- Middle East & Africa High Speed Rail Market Outlook, by Funding Model, Value (US$ Billion), 2020-2033
- Public Funding
- Public-Private Partnership
- Concession and Private Investment
- Middle East & Africa High Speed Rail Market Outlook, by Country, Value (US$ Billion), 2020-2033
- Saudi Arabia High Speed Rail Market Outlook, by Offering, 2020-2033
- Saudi Arabia High Speed Rail Market Outlook, by Speed Class, 2020-2033
- Saudi Arabia High Speed Rail Market Outlook, by Programme Type, 2020-2033
- Saudi Arabia High Speed Rail Market Outlook, by Funding Model, 2020-2033
- Egypt High Speed Rail Market Outlook, by Offering, 2020-2033
- Egypt High Speed Rail Market Outlook, by Speed Class, 2020-2033
- Egypt High Speed Rail Market Outlook, by Programme Type, 2020-2033
- Egypt High Speed Rail Market Outlook, by Funding Model, 2020-2033
- Morocco High Speed Rail Market Outlook, by Offering, 2020-2033
- Morocco High Speed Rail Market Outlook, by Speed Class, 2020-2033
- Morocco High Speed Rail Market Outlook, by Programme Type, 2020-2033
- Morocco High Speed Rail Market Outlook, by Funding Model, 2020-2033
- Middle East & Africa High Speed Rail Market Outlook, by Offering, Value (US$ Billion), 2020-2033
- Competitive Landscape
- Market Concentration and Industry Leaders
- Competitive Differentiation
- Strategic Initiatives
- Recent Industry Developments
- Company Profiles
- CRRC Corporation Limited
- Alstom SA
- Siemens Mobility GmbH
- Hitachi Rail
- Stadler Rail AG
- Talgo S.A.
- Hyundai Rotem Company
- Kawasaki Heavy Industries, Ltd.
- China Railway Construction Corporation Limited
- China Railway Group Limited
- Vinci SA
- Ferrovial SE
- Knorr-Bremse AG
- Vossloh AG
- Appendix
- Research Methodology
- Report Assumptions
- Acronyms and Abbreviations
Offering
- Rolling Stock
- Infrastructure
- Signalling and Train Control
- Operations and Maintenance Services
Speed Class
- Higher Speed (200–249 km/h)
- High Speed (250–299 km/h)
- Very High Speed (300 km/h and Above)
Programme Type
- New Line Construction
- Network Extension and Upgrade
- Renewal and Replacement
Funding Model
- Public Funding
- Public-Private Partnership
- Concession and Private Investment
Regions
- North America
- Europe
- Asia Pacific
- Latin America
- Middle East & Africa
Our Research Methodology
Considering the volatility of business today, traditional approaches to strategizing a game plan can be unfruitful if not detrimental. True ambiguity is no way to determine a forecast. A myriad of predetermined factors must be accounted for such as the degree of risk involved, the magnitude of circumstances, as well as conditions or consequences that are not known or unpredictable. To circumvent binary views that cast uncertainty, the application of market research intelligence to strategically posture, move, and enable actionable outcomes is necessary.
View Methodology
Quality Assured
Rigorous Validation Process

Confidentiality Assured
End-to-end Data Security

Custom Research Services
Tailored To Your Objectives
FAQs
Annual spend is valued at US$ 185.0 billion in 2026, covering rolling stock, infrastructure, signalling and train control, and maintenance services together.
Spending is projected to reach US$ 268.0 billion by 2033 at a 5.4% CAGR, an absolute opportunity of US$ 83.0 billion over the period.
Infrastructure accounts for 47% of spend in 2026, since track, electrification, civil works and stations dominate the capital cost of any programme.
Signalling and train control grows fastest among offerings at 7.9%, while Middle East & Africa leads regional growth at an 8.4% CAGR.
Asia Pacific leads with 56% share in 2026, and system-level supply is highly concentrated among a small group of qualified manufacturers.
Related Reports
Used Vehicle Market Size, Share, Insights, Competitive Landscape, and Forecast 2026 to 2033
The global used vehicle market is valued at US$1.7 trillion in 2026, reaching US$2.6 trillion by 2033, growing at a 6.3% CAGR
Logistics Market Size, Share, Insights, Competitive Landscape, and Forecast 2026 to 2033
The global logistics market is valued at US$3.7 trillion in 2026, reaching US$6.1 trillion by 2033, growing at a 7.4% CAGR
Hypercar Market Size, Share, Insights, Competitive Landscape, and Forecast 2026 to 2033
The global hypercar market is valued at US$18.1 billion in 2026, reaching US$60.8 billion by 2033, growing at an 18.9% CAGR
Farm Tire Market Size, Share, Insights, Competitive Landscape, and Forecast 2026 to 2033
The global farm tire market is valued at US$5.9 billion in 2026, reaching US$9.4 billion by 2033, growing at a 6.9% CAGR
Cold Chain Logistics Market Size, Share, Insights, Competitive Landscape, and Forecast 2026 to 2033
The Cold Chain Logistics Market is set to grow from US$ 412.3 billion in 2026 to US$ 976.0 billion by 2033 at a 13.1% CAGR. Explore key segments.
Automotive Heat Exchanger Market Size, Share, Insights, Competitive Landscape, and Forecast 2026 to 2033
The Automotive Heat Exchanger Market is projected to rise from US$ 27.6 billion in 2026 to US$ 31.3 billion by 2033 at a 1.8% CAGR. Explore key segments.