



Industrial Robotics Market
Industrial Robotics Market Size, Share, Insights, Competitive Landscape, and Forecast 2026 to 2033
Industrial Robotics Market Size and Trend Analysis
What Is the Growth Outlook for Industrial Robotics?
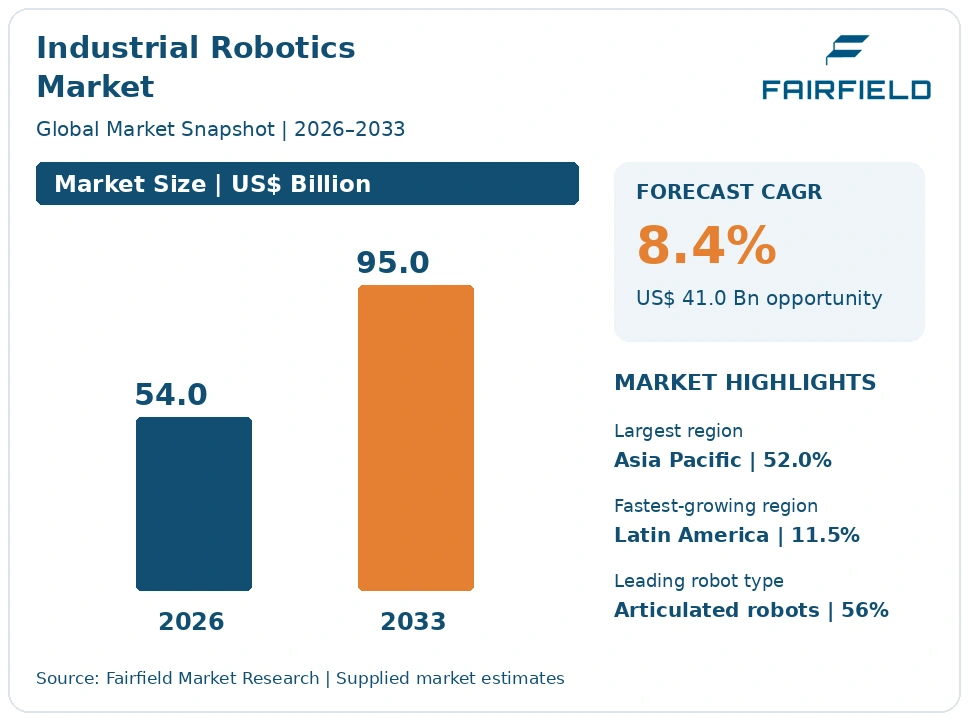
The global Industrial Robotics market size is expected to be valued at US$ 54.0 billion in 2026 and projected to reach US$ 95.0 billion by 2033, growing at a CAGR of 8.4% between 2026 and 2033.
The sector expanded at close to a 7.2% CAGR between 2020 and 2025, with a steep installation surge in 2021 and 2022 followed by a flat period as manufacturers worked through backlogs. Three forces set the forward trajectory. Production labour is scarce and wages are rising faster than output prices in most advanced manufacturing economies. Robot demand is migrating out of automotive body shops into electronics, battery, logistics and general industry, which together install more units than vehicle assembly now does. Collaborative models and simpler programming are pulling in smaller manufacturers. Growth will stay cyclical, because robot orders track industrial capital spending with little lag.
Key Report Takeaways
- By Robot Type: Articulated Robots held 56.0% share in 2026, while Collaborative Robots are projected to expand at a 15.2% CAGR through 2033, as force-limited designs remove the need for fixed guarding in small workcells.
- By Component: Robots held 41.0% share in 2026, while Robot Software is projected to grow at a 12.6% CAGR through 2033, because offline programming and fleet management tools cut the engineering hours each deployment consumes.
- By Payload Capacity: The 16–60 kg class held 32.0% share in 2026, while robots up to 16 kg are projected to grow at a 9.8% CAGR through 2033, driven by electronics assembly, testing and laboratory handling tasks.
- By End-Use Industry: Automotive held 28.0% share in 2026, while Logistics and Warehousing is projected to grow at a 13.4% CAGR through 2033, supported by depalletising, piece picking and parcel induction applications.
- By Geography: Asia Pacific held 52.0% share in 2026, while Latin America is projected to grow at an 11.5% CAGR through 2033, as vehicle and appliance production relocates closer to end markets.
Global Industrial Robotics Market Trends and Insights
Drivers Impact Analysis
Two forces explain most incremental demand for factory automation robots across the forecast period.
| Driver | Impact on CAGR Forecast | Geographic Relevance | Impact Timeline |
| Scarcity of production labour and rising manufacturing wages | High | North America, Europe, Asia Pacific | Short term (≤2 years) |
| Migration of robot demand from automotive body shops into electronics, battery and general industry | High | Asia Pacific, North America, Europe | Medium term (2–4 years) |
Scarce Production Labour Turns Industrial Robot Purchases Into a Staffing Decision
Labour availability, not labour cost alone, is now the strongest reason manufacturers buy robots. Plants in Japan, Germany, South Korea and the United States cannot fill welding, machine tending, palletising and press shop roles at any realistic wage, and warehouses face annual turnover that makes training uneconomic. When a line runs short-handed, a robot protects output rather than cutting headcount, which changes how finance teams evaluate the request.
The mechanism is demographic and durable. Working-age populations are shrinking in the economies that host the densest manufacturing bases, while the share of school leavers entering skilled trades keeps falling. Wage inflation in logistics has outpaced general inflation since the pandemic, shortening payback on palletising and depalletising cells to well under two years. Night shifts and physically punishing tasks are automated first, because those are the hardest positions to staff consistently.
Electronics, Battery and General Industry Demand Displaces Automotive as the Volume Driver
The centre of gravity in robot installations has shifted away from vehicle body shops, which widens the addressable market considerably. Electronics assembly, battery cell and module production, food processing, metal fabrication and warehouse operations now absorb more units each year than automotive assembly. These buyers order in smaller batches, specify lighter payloads and change products more often, so they value flexibility over the cycle-time optimisation that defined automotive lines.
Battery and electronics plants create the clearest pull. Cell manufacturing requires precise handling of foils, stacks and modules in controlled atmospheres, and module assembly uses large numbers of small articulated and SCARA units. Logistics operators automate depalletising, parcel induction and mixed-case palletising, where product variety previously defeated fixed equipment. Improved gripping and vision guidance has made these tasks reliable enough for continuous operation, which is what unlocked the volume.
Restraints Impact Analysis
Both constraints below sit outside the robot itself, which is why falling robot prices have not removed them.
| Restraint | Impact on CAGR Forecast | Geographic Relevance | Impact Timeline |
| Integration and engineering cost running two to three times the robot price | High | Global, sharpest in Latin America and Middle East & Africa | Long term (≥4 years) |
| Cyclical industrial capital spending producing sharp swings in order books | Medium | Asia Pacific, Europe, North America | Short term (≤2 years) |
Integration Cost Several Times the Robot Price Blocks Smaller Manufacturers
A robot arm is a minority of the project cost, and that arithmetic keeps many plants out of the market. Tooling, fixtures, safety guarding, conveyors, controls, vision, commissioning and operator training typically add two to three times the arm price before a cell produces a single part. A buyer quoted a competitive figure for the robot often sees a total project cost that fails the internal hurdle rate, so the enquiry stops at the quotation stage.
The cost source is engineering time, not components. Each cell is effectively bespoke, requiring gripper design, cycle simulation, risk assessment and programming by people in short supply. Qualified systems integrators and robot programmers are booked months ahead in every major market, which raises day rates and lengthens schedules. Smaller manufacturers have no internal automation engineer to specify the work, so they also pay for the scoping phase.
Order Book Volatility From Cyclical Capital Spending Destabilises Robot Supply Chains
Robot demand follows industrial capital expenditure closely, and that cyclicality makes capacity planning difficult across the supply chain. Order intake can fall by a quarter within two or three quarters when automotive or electronics investment pauses, then rebound as sharply when programmes restart. Suppliers of reducers, servo motors and controllers face the same swing amplified by inventory effects, producing shortages in upswings and written-down stock in downturns.
The cause lies in how robots are purchased. They are bought as part of discrete production programmes, so spending clusters around new model launches, plant construction and capacity expansions rather than arriving steadily. Interest rates and trade policy shift those decisions quickly. Because lead times for precision reducers and large castings run long, vendors must commit to components before demand is confirmed, which leaves them exposed when a programme slips.
Market Opportunities
Robots-as-a-Service Converts Capital Approval Into an Operating Line for Mid-Sized Plants
Subscription and outcome-based pricing open a customer pool that outright purchase cannot reach. Under a robots-as-a-service arrangement the supplier retains the asset and charges monthly, per shift or per unit handled, removing the capital approval that stops most mid-sized projects. The revenue is recurring and includes service, spares and software, so lifetime value per installation is higher than a single equipment sale even at a lower headline price.
Integrators, finance-backed specialists and robot builders with captive leasing arms are positioned to capture it. Demand is strongest among contract manufacturers, third-party logistics operators and food processors, whose own contracts run for fixed terms and who resist owning assets beyond that horizon. Standardised, redeployable cells make the model workable, because the supplier can recover and re-let hardware when a contract ends rather than writing it off.
Small and Mid-Sized Manufacturers Become Reachable Through Collaborative Robots and No-Code Programming
The installed base of smaller manufacturers is the largest untapped pool in robotic systems integration, and simpler products are finally making it addressable. Force-limited collaborative arms can often work beside people without full perimeter guarding after a risk assessment, which cuts cell footprint and installation cost. Guided setup tools let a production supervisor teach a palletising or machine tending task in hours rather than commissioning a bespoke program.
Robot builders, distributors and regional integrators with a standardised product catalogue are best placed to serve this demand. Job shops, metal fabricators, plastics moulders and small food producers create it, since each wants one or two cells rather than a line. Application kits that bundle an arm, gripper, base and pre-built software for a named task convert a custom engineering project into a configurable purchase with a published price.
Segment Analysis
By Robot Type: Articulated Arms Hold the Installed Base While Collaborative Models Grow Quickest
Articulated Robots accounted for 56.0% of market value in 2026, the dominant share, because six-axis arms cover welding, material handling, machine tending, painting and assembly with one mechanical platform. Their reach and payload range suit automotive and metal fabrication, and a mature accessory ecosystem keeps project risk low. SCARA Robots hold a solid position in high-speed electronics assembly, while Delta Robots serve food and pharmaceutical packaging.
Collaborative Robots are the fastest-growing type at a 15.2% CAGR through 2033. Force and power limiting, validated against established safety requirements, allows many applications to run without fixed guarding, which cuts floor space and installation cost. Simplified teaching lowers the skill threshold for setup. The business implication is that unit growth and value growth are diverging, as collaborative models add many installations at lower average selling prices than traditional arms.
By Component: Robot Hardware Leads Revenue as Software Captures the Fastest Expansion
Robots themselves represented 41.0% of market value in 2026, with systems integration services the next largest block, reflecting how much engineering each deployment still requires. Controllers and end-of-arm tooling follow, and gripper content per cell has risen as applications move toward variable products. Hardware leads because every project begins with the arm and because replacement demand in mature plants is steady.
Robot Software is the fastest-growing component at a 12.6% CAGR to 2033. Offline programming, simulation, fleet management and vision-guidance packages reduce the engineering hours a cell consumes, which is the single biggest project cost. Software also renews annually, giving suppliers revenue between equipment cycles. For vendors, the strategic consequence is that control over the programming environment increasingly determines which arms an integrator specifies.
By Payload Capacity: Mid-Range Arms Dominate While Light Payload Classes Expand Fastest
The 16–60 kg payload class held 32.0% of revenue in 2026, the leading position, because it covers the widest span of practical tasks: machine tending, spot welding, carton palletising and general material handling. It is the workhorse range in metal fabrication and appliance production. Classes above 225 kg remain tied to automotive body handling and heavy press lines, where volumes are lower but unit values are high.
Robots up to 16 kg are growing fastest at a 9.8% CAGR through 2033. Electronics assembly, testing, laboratory automation, medical device production and small-part machine tending all sit in this band, and most collaborative models fall inside it. Lighter arms need smaller safety zones and less floor preparation. The implication for suppliers is that growth volume is concentrating where price competition is sharpest and differentiation depends on software and tooling.
By End-Use Industry: Automotive Still Leads Spending While Logistics Grows at the Fastest Rate
Automotive accounted for 28.0% of robot spending in 2026 and remains the largest single industry, although its share has fallen steadily. Body-in-white welding, press tending and paint application still use dense robot populations, and electric vehicle programmes have added battery pack and electric drive assembly lines. Electrical and Electronics is the second largest, with very high unit counts at lower average values.
Logistics and Warehousing is the fastest-growing industry at a 13.4% CAGR through 2033. Depalletising, mixed-case palletising, parcel induction and piece picking became viable once gripping and vision guidance improved enough to handle unpredictable items. Staffing difficulty in distribution centres accelerates approval. The wider consequence is that warehouse robotics buyers specify differently from factories, valuing throughput per hour, rapid redeployment and uptime guarantees over absolute cycle time.
Geography Analysis
North America Builds Industrial Robot Demand on Reshoring and Warehouse Automation
North America held 19.5% of global industrial robot revenue in 2026 and is forecast to grow at an 8.0% CAGR through 2033. The United States drives the region, where policy-backed construction of semiconductor, battery and pharmaceutical plants arrives with automation specified from the design stage. Warehouse and parcel operations form the second pillar, having moved from pilot cells to multi-site rollouts of palletising and induction systems.
Mexico is an increasingly important production base for vehicles, appliances and wiring harnesses, and Canada contributes automotive components and metal fabrication. Integrator capacity is the binding constraint, with qualified engineering teams booked far ahead and day rates high. The most consequential change is the growth of standardised application cells sold with fixed scope and price, which lets smaller plants buy automation without commissioning a bespoke engineering study.
Europe Anchors Robot Demand in Machinery Safety Rules and General Industry
Europe accounted for 23.0% of the market in 2026, with a forecast 7.2% CAGR to 2033, the slowest of the five regions. Germany is the centre of demand and supply, combining vehicle assembly, machine tool integration and a dense base of component and integrator firms. Italy contributes packaging machinery and metal fabrication, France aerospace and food production, and Poland and Czechia growing contract manufacturing capacity.
Safety regulation shapes specification more here than elsewhere. ISO 10218-1 and ISO 10218-2 set the requirements for robots and robot systems, ISO/TS 15066 informed collaborative operation practice, and IEC 61496 governs the electro-sensitive protective equipment used in place of guarding. ISO 3691-4 applies where driverless industrial trucks share space with robot cells. Weak industrial capital spending is the brake, partly offset by battery plant construction.
Which Region Is Leading the Industrial Robotics Market?
Asia Pacific leads the industrial robotics market with a 52.0% revenue share in 2026 and is forecast to grow at an 8.6% CAGR through 2033. The region leads because it hosts most of the world’s electronics assembly, lithium-ion cell manufacturing and vehicle production, the three activities that install the most robots per unit of output.
China is by far the largest single market and now also a major producer, with domestic builders supplying a growing share of units sold at home. Japan and South Korea combine very high robot density in their own plants with export of arms, controllers and precision reducers. Taiwan anchors electronics and semiconductor handling demand, and India is adding vehicle, appliance and electronics capacity that is automated from the first line. Falling domestic robot prices continue to widen the buyer base.
Which Region Is Growing Fastest in the Industrial Robotics Market?
Latin America is growing fastest in the industrial robotics market, at an 11.5% CAGR between 2026 and 2033, from a 3.5% share in 2026. Mexico supplies most of that growth, as vehicle, appliance and electronics plants relocated closer to their end markets are built with welding, handling and palletising cells specified at design stage rather than retrofitted later.
Brazil contributes food, beverage, packaging and agricultural machinery demand, with palletising the common entry application. Barriers are real: integrator networks are thin outside a few industrial corridors, imported equipment carries duty and currency exposure, and spare parts logistics lengthen downtime. Vendor training programmes and technical institutes are slowly building local commissioning skills. The change that matters most is customer quality requirements set abroad, which make documented, repeatable automated processes a condition of supply.
Middle East & Africa Adds Robot Capacity Around Industrial Diversification Programmes
Middle East & Africa held 2.0% of the market in 2026 and is projected to grow at a 10.2% CAGR through 2033 from a very small base. Saudi Arabia and the United Arab Emirates account for most activity, funding food processing, building products, pharmaceutical packaging and large distribution centres under industrial diversification programmes that specify automation in new facilities rather than existing ones.
South Africa contributes vehicle and component assembly with an established robot population, while Morocco and Egypt add wiring harness and electronics work tied to supply chains elsewhere. Barriers include a thin integrator base, limited availability of robot programmers, and maintenance skills that must be imported for several years after commissioning. The useful change is the growth of vendor-operated training centres, which shortens the period during which plants depend on external support.
Competitive Landscape
The industrial robotics market is moderately concentrated. A small group of established builders accounts for a large majority of arms shipped, led by FANUC Corporation, Yaskawa Electric Corporation, ABB Ltd. and KUKA AG, with Kawasaki Heavy Industries, Ltd., Mitsubishi Electric Corporation, DENSO Corporation and Seiko Epson Corporation holding strong positions in specific payload classes and applications. Concentration is far lower one level down: systems integration, end-of-arm tooling and application software are fragmented across thousands of regional firms, which is where most project value is earned. Chinese builders including Estun Automation Co., Ltd. and Siasun Robot & Automation Co., Ltd. have taken a rising share of domestic installations, compressing prices in the mid-payload range.
Competition is decided by total installed cost and support reach rather than arm specification, since mechanical performance is broadly comparable within a payload class. Buyers weigh the density of the local service network, spare parts availability, the quality of the programming environment and the number of integrators certified on the platform. Collaborative specialists such as Universal Robots A/S entered by changing the purchase experience rather than the mechanics, selling through distributors with published prices and application kits.
Consolidation has been steady and defensive. Builders have absorbed gripper, vision software and integration firms to control more of the project value, while large integrators have merged to serve multi-site customers. Component suppliers of precision reducers and servo drives remain a chokepoint that shapes everyone’s capacity.
Strategic direction is converging on reducing engineering hours per cell. Vendors invest in simulation, reusable application templates, fleet management software and training capacity, because the shortage of skilled integrators limits how fast demand can be served.
Industrial Robotics Industry Leaders
- FANUC Corporation
- Yaskawa Electric Corporation
- ABB Ltd.
- KUKA AG
- Kawasaki Heavy Industries, Ltd.
Recent Industry Developments
2025: A revised edition of ISO 10218-1, covering safety requirements for industrial robots themselves, was published – robot builders must now evidence conformity against updated functional safety and validation requirements, which raises the documentation burden for lower-cost entrants.
2025: A revised edition of ISO 10218-2, covering robot systems, cells and integration, was published, consolidating collaborative-operation requirements previously held in the technical specification ISO/TS 15066 – integrators now work from a single normative basis for force-limited applications instead of a standard plus guidance.
January 2027: The EU Machinery Regulation, Regulation (EU) 2023/1230, becomes applicable and replaces the Machinery Directive – robot cells placed on the European Union market face revised conformity assessment duties covering software updates, cybersecurity and digital documentation.
Industrial Robotics Market Report Scope
| Metric | Value |
| Study Period | 2020–2033 |
| Market Size 2026 | US$ 54.0 Billion |
| Market Size 2033 | US$ 95.0 Billion |
| CAGR 2026–2033 | 8.4% |
| Absolute Dollar Opportunity | US$ 41.0 Billion |
| Largest Market | Asia Pacific (52.0% share in 2026) |
| Fastest-Growing Market | Latin America (11.5% CAGR) |
| Market Concentration | Medium |
| Major Players | FANUC Corporation, Yaskawa Electric Corporation, ABB Ltd., KUKA AG, Kawasaki Heavy Industries, Ltd. |
This report covers articulated, SCARA, cartesian, delta and collaborative robots, together with the controllers, end-of-arm tooling, robot software and systems integration services sold with them. It examines robotics in its own right as a component of the wider industrial automation market, and robot vision systems are covered separately. The base year is 2025, the forecast period runs from 2026 to 2033, and values are stated in US$ Billion.
Industrial Robotics Market Segmentation
Robot Type
- Articulated Robots
- SCARA Robots
- Cartesian Robots
- Delta Robots
- Collaborative Robots
Component
- Robots
- Controllers
- End-of-Arm Tooling
- Robot Software
- Systems Integration Services
Payload Capacity
- Up to 16 kg
- 16–60 kg
- 60–225 kg
- Above 225 kg
End-Use Industry
- Automotive
- Electrical and Electronics
- Metals and Machinery
- Food and Beverage
- Plastics and Chemicals
- Logistics and Warehousing
- Pharmaceuticals
Regions
- North America
- Europe
- Asia Pacific
- Latin America
- Middle East & Africa
- Executive Summary
- Global Industrial Robotics Market Snapshot
- Future Projections
- Key Report Takeaways
- Regional Snapshot
- Market Overview
- Market Definition and Report Scope
- Historical Trends 2020–2025
- Market Dynamics
- Drivers
- Scarce Production Labour Turns Industrial Robot Purchases Into a Staffing Decision
- Electronics, Battery and General Industry Demand Displaces Automotive as the Volume Driver
- Restraints
- Integration Cost Several Times the Robot Price Blocks Smaller Manufacturers
- Order Book Volatility From Cyclical Capital Spending Destabilises Robot Supply Chains
- Market Opportunities
- Robots-as-a-Service Converts Capital Approval Into an Operating Line for Mid-Sized Plants
- Small and Mid-Sized Manufacturers Become Reachable Through Collaborative Robots and No-Code Programming
- Drivers
- Global Industrial Robotics Market Outlook, 2020–2033
- Global Industrial Robotics Market Outlook, by Robot Type, Value (US$ Billion), 2020–2033
- Articulated Robots
- SCARA Robots
- Cartesian Robots
- Delta Robots
- Collaborative Robots
- Global Industrial Robotics Market Outlook, by Component, Value (US$ Billion), 2020–2033
- Robots
- Controllers
- End-of-Arm Tooling
- Robot Software
- Systems Integration Services
- Global Industrial Robotics Market Outlook, by Payload Capacity, Value (US$ Billion), 2020–2033
- Up to 16 kg
- 16–60 kg
- 60–225 kg
- Above 225 kg
- Global Industrial Robotics Market Outlook, by End-Use Industry, Value (US$ Billion), 2020–2033
- Automotive
- Electrical and Electronics
- Metals and Machinery
- Food and Beverage
- Plastics and Chemicals
- Logistics and Warehousing
- Pharmaceuticals
- Global Industrial Robotics Market Outlook, by Region, Value (US$ Billion), 2020–2033
- North America
- Europe
- Asia Pacific
- Latin America
- Middle East & Africa
- Global Industrial Robotics Market Outlook, by Robot Type, Value (US$ Billion), 2020–2033
- North America Industrial Robotics Market Outlook, 2020–2033
- North America Industrial Robotics Market Outlook, by Robot Type, Value (US$ Billion), 2020–2033
- Articulated Robots
- SCARA Robots
- Cartesian Robots
- Delta Robots
- Collaborative Robots
- North America Industrial Robotics Market Outlook, by Component, Value (US$ Billion), 2020–2033
- Robots
- Controllers
- End-of-Arm Tooling
- Robot Software
- Systems Integration Services
- North America Industrial Robotics Market Outlook, by Payload Capacity, Value (US$ Billion), 2020–2033
- Up to 16 kg
- 16–60 kg
- 60–225 kg
- Above 225 kg
- North America Industrial Robotics Market Outlook, by End-Use Industry, Value (US$ Billion), 2020–2033
- Automotive
- Electrical and Electronics
- Metals and Machinery
- Food and Beverage
- Plastics and Chemicals
- Logistics and Warehousing
- Pharmaceuticals
- North America Industrial Robotics Market Outlook, by Country, Value (US$ Billion), 2020–2033
- United States Industrial Robotics Market Outlook, by Robot Type, 2020–2033
- United States Industrial Robotics Market Outlook, by Component, 2020–2033
- United States Industrial Robotics Market Outlook, by Payload Capacity, 2020–2033
- United States Industrial Robotics Market Outlook, by End-Use Industry, 2020–2033
- Mexico Industrial Robotics Market Outlook, by Robot Type, 2020–2033
- Mexico Industrial Robotics Market Outlook, by Component, 2020–2033
- Mexico Industrial Robotics Market Outlook, by Payload Capacity, 2020–2033
- Mexico Industrial Robotics Market Outlook, by End-Use Industry, 2020–2033
- Canada Industrial Robotics Market Outlook, by Robot Type, 2020–2033
- Canada Industrial Robotics Market Outlook, by Component, 2020–2033
- Canada Industrial Robotics Market Outlook, by Payload Capacity, 2020–2033
- Canada Industrial Robotics Market Outlook, by End-Use Industry, 2020–2033
- North America Industrial Robotics Market Outlook, by Robot Type, Value (US$ Billion), 2020–2033
- Europe Industrial Robotics Market Outlook, 2020–2033
- Europe Industrial Robotics Market Outlook, by Robot Type, Value (US$ Billion), 2020–2033
- Articulated Robots
- SCARA Robots
- Cartesian Robots
- Delta Robots
- Collaborative Robots
- Europe Industrial Robotics Market Outlook, by Component, Value (US$ Billion), 2020–2033
- Robots
- Controllers
- End-of-Arm Tooling
- Robot Software
- Systems Integration Services
- Europe Industrial Robotics Market Outlook, by Payload Capacity, Value (US$ Billion), 2020–2033
- Up to 16 kg
- 16–60 kg
- 60–225 kg
- Above 225 kg
- Europe Industrial Robotics Market Outlook, by End-Use Industry, Value (US$ Billion), 2020–2033
- Automotive
- Electrical and Electronics
- Metals and Machinery
- Food and Beverage
- Plastics and Chemicals
- Logistics and Warehousing
- Pharmaceuticals
- Europe Industrial Robotics Market Outlook, by Country, Value (US$ Billion), 2020–2033
- Germany Industrial Robotics Market Outlook, by Robot Type, 2020–2033
- Germany Industrial Robotics Market Outlook, by Component, 2020–2033
- Germany Industrial Robotics Market Outlook, by Payload Capacity, 2020–2033
- Germany Industrial Robotics Market Outlook, by End-Use Industry, 2020–2033
- Italy Industrial Robotics Market Outlook, by Robot Type, 2020–2033
- Italy Industrial Robotics Market Outlook, by Component, 2020–2033
- Italy Industrial Robotics Market Outlook, by Payload Capacity, 2020–2033
- Italy Industrial Robotics Market Outlook, by End-Use Industry, 2020–2033
- France Industrial Robotics Market Outlook, by Robot Type, 2020–2033
- France Industrial Robotics Market Outlook, by Component, 2020–2033
- France Industrial Robotics Market Outlook, by Payload Capacity, 2020–2033
- France Industrial Robotics Market Outlook, by End-Use Industry, 2020–2033
- Poland Industrial Robotics Market Outlook, by Robot Type, 2020–2033
- Poland Industrial Robotics Market Outlook, by Component, 2020–2033
- Poland Industrial Robotics Market Outlook, by Payload Capacity, 2020–2033
- Poland Industrial Robotics Market Outlook, by End-Use Industry, 2020–2033
- Czechia Industrial Robotics Market Outlook, by Robot Type, 2020–2033
- Czechia Industrial Robotics Market Outlook, by Component, 2020–2033
- Czechia Industrial Robotics Market Outlook, by Payload Capacity, 2020–2033
- Czechia Industrial Robotics Market Outlook, by End-Use Industry, 2020–2033
- Europe Industrial Robotics Market Outlook, by Robot Type, Value (US$ Billion), 2020–2033
- Asia Pacific Industrial Robotics Market Outlook, 2020–2033
- Asia Pacific Industrial Robotics Market Outlook, by Robot Type, Value (US$ Billion), 2020–2033
- Articulated Robots
- SCARA Robots
- Cartesian Robots
- Delta Robots
- Collaborative Robots
- Asia Pacific Industrial Robotics Market Outlook, by Component, Value (US$ Billion), 2020–2033
- Robots
- Controllers
- End-of-Arm Tooling
- Robot Software
- Systems Integration Services
- Asia Pacific Industrial Robotics Market Outlook, by Payload Capacity, Value (US$ Billion), 2020–2033
- Up to 16 kg
- 16–60 kg
- 60–225 kg
- Above 225 kg
- Asia Pacific Industrial Robotics Market Outlook, by End-Use Industry, Value (US$ Billion), 2020–2033
- Automotive
- Electrical and Electronics
- Metals and Machinery
- Food and Beverage
- Plastics and Chemicals
- Logistics and Warehousing
- Pharmaceuticals
- Asia Pacific Industrial Robotics Market Outlook, by Country, Value (US$ Billion), 2020–2033
- China Industrial Robotics Market Outlook, by Robot Type, 2020–2033
- China Industrial Robotics Market Outlook, by Component, 2020–2033
- China Industrial Robotics Market Outlook, by Payload Capacity, 2020–2033
- China Industrial Robotics Market Outlook, by End-Use Industry, 2020–2033
- Japan Industrial Robotics Market Outlook, by Robot Type, 2020–2033
- Japan Industrial Robotics Market Outlook, by Component, 2020–2033
- Japan Industrial Robotics Market Outlook, by Payload Capacity, 2020–2033
- Japan Industrial Robotics Market Outlook, by End-Use Industry, 2020–2033
- South Korea Industrial Robotics Market Outlook, by Robot Type, 2020–2033
- South Korea Industrial Robotics Market Outlook, by Component, 2020–2033
- South Korea Industrial Robotics Market Outlook, by Payload Capacity, 2020–2033
- South Korea Industrial Robotics Market Outlook, by End-Use Industry, 2020–2033
- Taiwan Industrial Robotics Market Outlook, by Robot Type, 2020–2033
- Taiwan Industrial Robotics Market Outlook, by Component, 2020–2033
- Taiwan Industrial Robotics Market Outlook, by Payload Capacity, 2020–2033
- Taiwan Industrial Robotics Market Outlook, by End-Use Industry, 2020–2033
- India Industrial Robotics Market Outlook, by Robot Type, 2020–2033
- India Industrial Robotics Market Outlook, by Component, 2020–2033
- India Industrial Robotics Market Outlook, by Payload Capacity, 2020–2033
- India Industrial Robotics Market Outlook, by End-Use Industry, 2020–2033
- Asia Pacific Industrial Robotics Market Outlook, by Robot Type, Value (US$ Billion), 2020–2033
- Latin America Industrial Robotics Market Outlook, 2020–2033
- Latin America Industrial Robotics Market Outlook, by Robot Type, Value (US$ Billion), 2020–2033
- Articulated Robots
- SCARA Robots
- Cartesian Robots
- Delta Robots
- Collaborative Robots
- Latin America Industrial Robotics Market Outlook, by Component, Value (US$ Billion), 2020–2033
- Robots
- Controllers
- End-of-Arm Tooling
- Robot Software
- Systems Integration Services
- Latin America Industrial Robotics Market Outlook, by Payload Capacity, Value (US$ Billion), 2020–2033
- Up to 16 kg
- 16–60 kg
- 60–225 kg
- Above 225 kg
- Latin America Industrial Robotics Market Outlook, by End-Use Industry, Value (US$ Billion), 2020–2033
- Automotive
- Electrical and Electronics
- Metals and Machinery
- Food and Beverage
- Plastics and Chemicals
- Logistics and Warehousing
- Pharmaceuticals
- Latin America Industrial Robotics Market Outlook, by Country, Value (US$ Billion), 2020–2033
- Brazil Industrial Robotics Market Outlook, by Robot Type, 2020–2033
- Brazil Industrial Robotics Market Outlook, by Component, 2020–2033
- Brazil Industrial Robotics Market Outlook, by Payload Capacity, 2020–2033
- Brazil Industrial Robotics Market Outlook, by End-Use Industry, 2020–2033
- Latin America Industrial Robotics Market Outlook, by Robot Type, Value (US$ Billion), 2020–2033
- Middle East & Africa Industrial Robotics Market Outlook, 2020–2033
- Middle East & Africa Industrial Robotics Market Outlook, by Robot Type, Value (US$ Billion), 2020–2033
- Articulated Robots
- SCARA Robots
- Cartesian Robots
- Delta Robots
- Collaborative Robots
- Middle East & Africa Industrial Robotics Market Outlook, by Component, Value (US$ Billion), 2020–2033
- Robots
- Controllers
- End-of-Arm Tooling
- Robot Software
- Systems Integration Services
- Middle East & Africa Industrial Robotics Market Outlook, by Payload Capacity, Value (US$ Billion), 2020–2033
- Up to 16 kg
- 16–60 kg
- 60–225 kg
- Above 225 kg
- Middle East & Africa Industrial Robotics Market Outlook, by End-Use Industry, Value (US$ Billion), 2020–2033
- Automotive
- Electrical and Electronics
- Metals and Machinery
- Food and Beverage
- Plastics and Chemicals
- Logistics and Warehousing
- Pharmaceuticals
- Middle East & Africa Industrial Robotics Market Outlook, by Country, Value (US$ Billion), 2020–2033
- Saudi Arabia Industrial Robotics Market Outlook, by Robot Type, 2020–2033
- Saudi Arabia Industrial Robotics Market Outlook, by Component, 2020–2033
- Saudi Arabia Industrial Robotics Market Outlook, by Payload Capacity, 2020–2033
- Saudi Arabia Industrial Robotics Market Outlook, by End-Use Industry, 2020–2033
- United Arab Emirates Industrial Robotics Market Outlook, by Robot Type, 2020–2033
- United Arab Emirates Industrial Robotics Market Outlook, by Component, 2020–2033
- United Arab Emirates Industrial Robotics Market Outlook, by Payload Capacity, 2020–2033
- United Arab Emirates Industrial Robotics Market Outlook, by End-Use Industry, 2020–2033
- South Africa Industrial Robotics Market Outlook, by Robot Type, 2020–2033
- South Africa Industrial Robotics Market Outlook, by Component, 2020–2033
- South Africa Industrial Robotics Market Outlook, by Payload Capacity, 2020–2033
- South Africa Industrial Robotics Market Outlook, by End-Use Industry, 2020–2033
- Morocco Industrial Robotics Market Outlook, by Robot Type, 2020–2033
- Morocco Industrial Robotics Market Outlook, by Component, 2020–2033
- Morocco Industrial Robotics Market Outlook, by Payload Capacity, 2020–2033
- Morocco Industrial Robotics Market Outlook, by End-Use Industry, 2020–2033
- Egypt Industrial Robotics Market Outlook, by Robot Type, 2020–2033
- Egypt Industrial Robotics Market Outlook, by Component, 2020–2033
- Egypt Industrial Robotics Market Outlook, by Payload Capacity, 2020–2033
- Egypt Industrial Robotics Market Outlook, by End-Use Industry, 2020–2033
- Middle East & Africa Industrial Robotics Market Outlook, by Robot Type, Value (US$ Billion), 2020–2033
- Competitive Landscape
- Market Concentration and Industry Leaders
- Competitive Differentiation
- Strategic Moves and Market Direction
- Recent Industry Developments
- Company Profiles
- FANUC Corporation
- Yaskawa Electric Corporation
- ABB Ltd.
- KUKA AG
- Kawasaki Heavy Industries, Ltd.
- Mitsubishi Electric Corporation
- DENSO Corporation
- Seiko Epson Corporation
- Universal Robots A/S
- Stäubli International AG
- Comau S.p.A.
- NACHI-FUJIKOSHI CORP.
- OMRON Corporation
- Estun Automation Co., Ltd.
- Siasun Robot & Automation Co., Ltd.
- Appendix
- Research Methodology
- Report Assumptions
- Acronyms and Abbreviations
Robot Type
- Articulated Robots
- SCARA Robots
- Cartesian Robots
- Delta Robots
- Collaborative Robots
Component
- Robots
- Controllers
- End-of-Arm Tooling
- Robot Software
- Systems Integration Services
Payload Capacity
- Up to 16 kg
- 16–60 kg
- 60–225 kg
- Above 225 kg
End-Use Industry
- Automotive
- Electrical and Electronics
- Metals and Machinery
- Food and Beverage
- Plastics and Chemicals
- Logistics and Warehousing
- Pharmaceuticals
Regions
- North America
- Europe
- Asia Pacific
- Latin America
- Middle East & Africa
Our Research Methodology
Considering the volatility of business today, traditional approaches to strategizing a game plan can be unfruitful if not detrimental. True ambiguity is no way to determine a forecast. A myriad of predetermined factors must be accounted for such as the degree of risk involved, the magnitude of circumstances, as well as conditions or consequences that are not known or unpredictable. To circumvent binary views that cast uncertainty, the application of market research intelligence to strategically posture, move, and enable actionable outcomes is necessary.
View Methodology
Quality Assured
Rigorous Validation Process

Confidentiality Assured
End-to-end Data Security

Custom Research Services
Tailored To Your Objectives
FAQs
The industrial robotics market is valued at US$ 54.0 billion in 2026, covering robots with their controllers, tooling, software and integration services.
The market is projected to reach US$ 95.0 billion by 2033, growing at an 8.4% CAGR and adding US$ 41.0 billion across the forecast period.
Articulated Robots lead with 56.0% share in 2026, because six-axis arms cover welding, handling, machine tending and assembly on one platform.
Collaborative Robots grow fastest at a 15.2% CAGR, since force-limited designs often avoid fixed guarding and can be taught without specialist programming.
Asia Pacific holds 52.0% share in 2026, led by China, Japan and South Korea across electronics, battery and vehicle production.
Related Reports
Inkjet Printers Market Size, Share, Insights, Competitive Landscape, and Forecast 2026 to 2033
The global inkjet printers market is valued at US$50.4 billion in 2026, reaching US$58.8 billion by 2033, growing at a 2.2% CAGR
LED Lighting Market Size, Share, Insights, Competitive Landscape, and Forecast 2026 to 2033
The LED lighting market is projected to grow from US$84.0 billion in 2026 to US$112.0 billion by 2033 at a 4.2% CAGR. Explore segments and trends.
LTE Advanced Pro Market Size, Share, Insights, Competitive Landscape, and Forecast 2026 to 2033
The LTE Advanced Pro market is forecast to grow from US$ 22.30 billion in 2026 to US$ 42.91 billion by 2033 at a 9.8% CAGR.
Advanced Semiconductor Cooling Systems Market Size, Share, Insights, Competitive Landscape, and Forecast 2026 to 2033
The advanced semiconductor cooling systems market is projected to grow from US$ 6.8 billion in 2026 to US$ 24.9 billion by 2033 at a 20.4% CAGR.
Plastic Transistors Market Size, Share, Insights, Competitive Landscape, and Forecast 2026 to 2033
The global plastic transistors market is valued at US$0.4 billion in 2026, reaching US$0.9 billion by 2033, growing at a 12.3% CAGR
Multi-Access Edge Computing Market Size, Share, Insights, Competitive Landscape, and Forecast 2026 to 2033
Explore the multi-access edge computing market, valued at US$ 4.2 billion in 2026 and projected to reach US$ 9.8 billion by 2033 at a 12.9% CAGR.