



Intelligent Pumps Market
Intelligent Pumps Market Size, Share, Insights, Competitive Landscape, and Forecast 2026 to 2033
Intelligent Pumps Market Size and Trend Analysis
How Big Will the Intelligent Pumps Market Become?
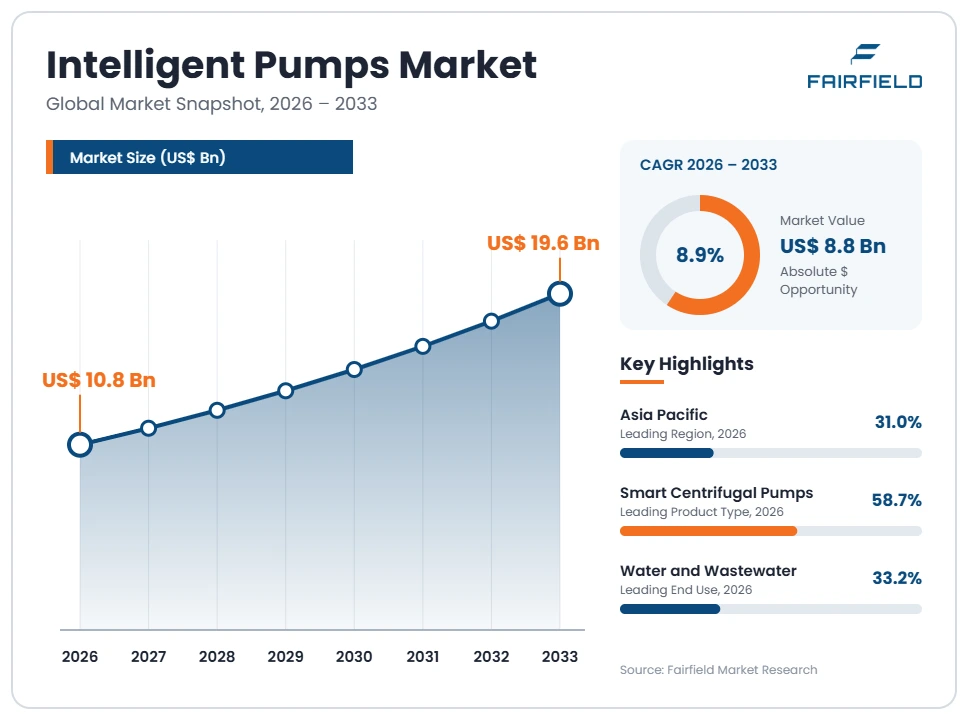
The global Intelligent Pumps market size is expected to be valued at US$ 10.8 billion in 2026 and projected to reach US$ 19.6 billion by 2033, growing at a CAGR of 8.9% between 2026 and 2033.
The market expanded from roughly US$ 6.2 billion in 2020 to US$ 9.9 billion in 2025, a historical CAGR near 9.8%. Figures count pump units with integrated drives, sensors and controls, plus standalone intelligent pump controllers and the associated monitoring and analytics software; bare pumps and separately sold drives are excluded. Three forces sustain growth. Electricity cost pressure makes variable speed operation the default specification. Efficiency regulation has pulled motors and drives into mandatory scope. Utilities and plant operators now want condition data to plan maintenance. Growth is steady, since replacement cycles rather than new capacity drive most demand.
Key Report Takeaways
- By Product Type: Smart Centrifugal Pumps held 58.7% share in 2026, while Monitoring and Analytics Software is projected to expand at a 13.8% CAGR through 2033, as operators buy condition insight separately from the hardware that generates it.
- By Connectivity: Wired industrial networks held 61.4% share in 2026, while Wireless connectivity is projected to expand at a 12.9% CAGR through 2033, driven by distributed water assets where cabling costs exceed the instrument value.
- By Power Rating: The 5 kW to 50 kW band held 44.3% share in 2026, while units up to 5 kW are projected to expand at a 9.8% CAGR through 2033, led by high-efficiency circulators in building services retrofits.
- By End Use: Water and Wastewater held 33.2% share in 2026, while Agriculture and Irrigation is projected to expand at a 11.2% CAGR through 2033, as solar-powered and remotely scheduled irrigation pumping spreads across water-stressed regions.
- By Geography: Asia Pacific held 31% share in 2026, while Middle East & Africa is projected to expand at a 11.4% CAGR through 2033, supported by desalination, water network renewal and non-revenue water reduction programmes.
Global Intelligent Pumps Market Trends and Insights
Drivers Impact Analysis
Two forces explain most of the shift from bare pumps toward intelligent pumping systems.
| Driver | Impact on CAGR Forecast | Geographic Relevance | Impact Timeline |
| Pumping energy cost and efficiency regulation | High | Europe, North America | Medium term (2–4 years) |
| Condition monitoring to avoid unplanned downtime | High | Asia Pacific, Middle East & Africa | Long term (≥4 years) |
Pumping Energy Costs and Efficiency Rules Make Variable Speed the Default Specification
Energy cost is the central reason buyers choose intelligent pumps, because pumping consumes a very large share of industrial and municipal electricity. Fixed-speed pumps are sized for a worst-case duty they rarely meet, then throttled, which wastes energy continuously. A pump with an integrated variable frequency drive matches flow to actual demand, and because power follows roughly the cube of speed, modest speed reductions deliver disproportionate savings.
Regulation has made this mandatory rather than optional. Commission Regulation (EU) No 547/2012 sets a minimum efficiency index for water pumps, and Commission Regulation (EU) 2019/1781 brought electric motors and variable speed drives into scope with defined IE efficiency classes. The extended product approach rates pump, motor and drive together as a system, and the United States Department of Energy applies a pump energy index to certain clean water pumps.
Condition Monitoring Converts Pump Failures From Emergencies Into Scheduled Work
Avoiding unplanned downtime drives intelligent pump adoption in process industries, where a failed pump can halt an entire production line. Embedded sensors measuring vibration, bearing temperature, power signature and differential pressure detect cavitation, dry running, seal wear and impeller fouling well before failure. Operators can then schedule the repair, order parts and avoid both emergency labour rates and lost output.
The mechanism is the collapse in the cost of embedded electronics and connectivity. Sensors, processing and a communications stack can now be built into the pump or its controller for a fraction of a traditional standalone monitoring installation. ISO 14414 provides a recognised framework for pump system energy assessment, and Hydraulic Institute standards give common definitions for performance and testing, so monitored data can be compared against an agreed baseline rather than vendor claims.
Restraints Impact Analysis
Two obstacles slow conversion of the large installed base of conventional pumps.
| Restraint | Impact on CAGR Forecast | Geographic Relevance | Impact Timeline |
| First-cost premium over bare pumps in price-led tenders | High | Asia Pacific, Latin America | Short term (≤2 years) |
| Operational technology cybersecurity exposure once pumps are networked | Medium | Europe, North America | Medium term (2–4 years) |
First-Cost Premium Over Bare Pumps Keeps Price-Led Tenders on Conventional Equipment
The purchase price gap against a bare pump is the most common reason intelligent units lose a tender. An integrated drive, sensor package and controller can add a substantial premium to the equipment line, and many municipal and contractor-led procurements still award on lowest capital cost. Where the buyer installs the asset and a different budget pays the electricity bill, the lifecycle argument never reaches the decision maker.
The cost sits in specific components, not in vague complexity. Power electronics, the drive enclosure and its thermal management, instrumentation, and the certification and electromagnetic compatibility testing required for a motor-drive assembly all add cost. Installation adds more, since drives need harmonic mitigation, cable screening and sometimes transformer capacity. Life cycle cost tendering and energy performance contracts are the practical counterweight, but both remain minority procurement routes.
Cybersecurity Exposure of Networked Pumps Delays Utility and Plant Rollouts
Security review has become a genuine brake on connected pump deployment, particularly in water utilities and critical process plants. Once a pump controller carries a network address and a remote access path, it enters the operational technology attack surface. Security teams increasingly block or delay installations that lack network segmentation, authenticated access, signed firmware updates and a documented vulnerability disclosure process.
The underlying cause is the mismatch between asset lifetimes and software lifecycles. A pump may run for twenty years, while its embedded software needs patching for the whole period, and many controllers were designed before secure-by-default was expected. Regulation has raised the bar: the NIS2 Directive extends cybersecurity obligations to water and wastewater operators in the European Union, and the Cyber Resilience Act will impose security requirements on products with digital elements.
Market Opportunities
Two revenue pools lie beyond the sale of intelligent pump hardware itself.
Pumping-as-a-Service and Energy Performance Contracts Open a Recurring Revenue Pool
Selling guaranteed pumping performance rather than equipment is the clearest untapped revenue pool, because it removes the first-cost barrier that blocks conversion today. Under an energy performance contract, the supplier funds the intelligent pump, drive and controls and is repaid from verified energy and maintenance savings. Revenue becomes recurring and multi-year, and the supplier retains the asset data that makes the next renewal easier to win.
Municipal water utilities, hospitals, district heating operators and large commercial estates are the natural customers, because they have constrained capital budgets and verifiable energy baselines. Pump manufacturers with financing partners, energy service companies and specialist system integrators can capture the work. Measurement credibility is the enabler, and ISO 14414 assessments give both sides an agreed method for establishing and verifying the baseline.
Non-Revenue Water Reduction Creates a Pressure Management and Analytics Opportunity
Pressure management for leakage control is an emerging revenue pool that sits in software and controls rather than in pump iron. Distribution networks in many cities lose a very large share of treated water through leaks, and leak rates rise steeply with excess pressure. Intelligent pumps and booster sets that modulate pressure by district metered area reduce both leakage and pipe burst frequency, and the saving is measured in treated water, energy and repair cost at once.
Water utilities and their regulators create this demand, since leakage targets, drought restrictions and tariff mechanisms increasingly penalise losses rather than simply recording them. Pump suppliers with hydraulic network modelling and analytics capability, together with instrumentation and district metering vendors, are positioned to capture it, usually through multi-year monitoring contracts attached to booster station refurbishment programmes.
Segment Analysis
- By Product Type: Smart Centrifugal Pumps Lead While Monitoring and Analytics Software Scales Fastest
Smart Centrifugal Pumps held 58.7% of 2026 revenue, because centrifugal designs dominate water, wastewater, building services and most process duties, and they benefit most from variable speed control. Integrating the drive onto the motor terminal box also simplifies installation, which is why original equipment buyers favour packaged units over separately specified components.
Monitoring and Analytics Software is growing fastest at a 13.8% CAGR to 2033. Operators increasingly buy condition insight as a subscription that spans mixed fleets, including pumps from several manufacturers, rather than accepting one vendor’s closed portal. Intelligent pump controllers form a middle layer, retrofitting intelligence onto existing bare pumps without replacing the hydraulic asset.
The implication is that recurring software revenue is becoming a strategic battleground, and vendors that keep data locked to their own hardware risk losing the analytics layer to independent platforms.
- By Connectivity: Wired Networks Hold the Installed Base as Wireless Deployment Accelerates
Wired connectivity accounted for 61.4% of the market in 2026, reflecting the dominance of industrial Ethernet and fieldbus links inside plants, treatment works and plant rooms. Wired links are deterministic, powered, easier to secure through physical segmentation, and already present wherever a programmable controller or building management system exists.
Wireless connectivity is the fastest-growing segment at a 12.9% CAGR. Cellular, low-power wide-area and Wi-Fi links suit geographically dispersed assets such as borehole pumps, irrigation sets, sewer lift stations and remote booster stations, where trenching a cable costs more than the instrument. Hybrid architectures, with wired control inside the plant and a wireless backhaul for analytics, are becoming the common compromise.
For vendors, the implication is that security architecture, not radio range, is now the decisive technical requirement in connected pump tenders.
- By Power Rating: Mid-Range Units Dominate Revenue While Small Pumps Grow Quickest
The 5 kW to 50 kW band held 44.3% share in 2026, the largest of the three power classes. This range covers most municipal booster sets, commercial heating and cooling circulation, and medium process duties, so it combines high unit volumes with meaningful average selling prices and almost universal drive integration.
Units up to 5 kW are expanding fastest at a 9.8% CAGR. Growth is concentrated in high-efficiency electronically commutated circulators for heating and domestic hot water, and in small solar-powered irrigation and borehole pumps. Efficiency rules for circulators pushed this class toward integrated electronics earlier than any other, and replacement demand in existing buildings is now very large.
Above 50 kW, adoption is near saturation on new installations, so growth depends on retrofits and on analytics rather than on new drive penetration.
- By End Use: Water and Wastewater Leads While Agriculture and Irrigation Grows Fastest
Water and Wastewater generated 33.2% of 2026 revenue, the largest end use, because utilities operate enormous pump fleets that run continuously and account for a dominant share of a utility’s electricity bill. Pressure management, leakage reduction and energy targets all push utilities toward variable speed pumps with remote monitoring across distribution and treatment assets.
Agriculture and Irrigation is the fastest-growing end use at a 11.2% CAGR to 2033. Water scarcity, groundwater abstraction limits and the falling cost of solar pumping are driving adoption of controllers that schedule irrigation remotely and protect pumps against dry running. Building services, industrial process and oil and gas remain substantial, with building services the largest source of small-pump retrofit volume.
The implication is that growth is coming from distributed, outdoor assets rather than from traditional plant-room applications.
Geography Analysis
- North America Converts Ageing Water Infrastructure Into Intelligent Pump Demand
North America held 29% of the market in 2026 and is forecast to grow at an 8.2% CAGR, with the United States contributing most and Canada adding steady municipal demand. Ageing water and wastewater infrastructure, federal infrastructure funding and high commercial electricity tariffs combine to favour variable speed pumps with monitoring over like-for-like replacement of bare units.
Regulation reinforces the shift. The United States Department of Energy energy conservation standards apply a pump energy index to certain clean water pumps, and Hydraulic Institute standards give specifiers common performance definitions. The main barrier is cybersecurity review in water utilities, which lengthens approval cycles for connected equipment. The clearest regional opportunity is retrofit of existing booster and lift stations with intelligent controllers rather than full pump replacement.
- Europe Uses Ecodesign Rules to Push System-Level Pump Efficiency
Europe accounted for 28% of the market in 2026, growing at an 8.0% CAGR. Germany, Italy, France, the United Kingdom and the Nordic countries lead, supported by a dense base of pump manufacturers and by industrial electricity prices that make efficiency investment pay back quickly. Penetration of variable speed technology is already the highest of any region.
Policy is the defining factor. Commission Regulation (EU) No 547/2012 set a minimum efficiency index for water pumps, Commission Regulation (EU) 2019/1781 brought motors and variable speed drives into scope, and the extended product approach rates the pump, motor and drive as one system. Growth is therefore driven less by first-time adoption than by analytics, system optimisation and compliance with cybersecurity obligations for water operators.
- Which Region Is Leading the Intelligent Pumps Market?
Asia Pacific is leading the intelligent pumps market with 31% share in 2026 and a 9.9% CAGR to 2033. China, India, Japan, South Korea and Australia drive demand through continuing urban water and wastewater construction, large industrial process capacity, and manufacturing of pumps and motors at scale within the region itself.
Leadership rests on installed volume rather than on the highest technology penetration. Industrial electricity costs, provincial energy intensity targets in China and national efficiency labelling in India are moving buyers from bare pumps toward units with integrated drives. The main change ahead is the spread of monitoring in irrigation and groundwater pumping, where India has the largest agricultural pump population and strong policy pressure to reduce electricity and water use.
- Latin America Modernises Municipal Pumping Against Tight Capital Budgets
Latin America represented 6% of the market in 2026 with a 9.0% CAGR. Brazil, Mexico, Chile, Peru and Colombia account for most demand, split between municipal water networks, mining process duties and food processing. Mining in Chile and Peru is a notable buyer of intelligent slurry and process pumping, where downtime costs are high enough to justify monitoring.
Barriers are mainly financial and institutional: tight municipal capital budgets, lowest-price tendering, currency exposure on imported drives and a shortage of commissioning expertise. The opportunity lies in non-revenue water reduction, since leakage rates in many networks are high and pressure management delivers measurable savings in treated water, pumping energy and pipe repair costs.
- Which Region Is Growing Fastest in the Intelligent Pumps Market?
Middle East & Africa is growing fastest in the intelligent pumps market, at a 11.4% CAGR between 2026 and 2033, from a 6% share in 2026. Saudi Arabia, the United Arab Emirates, Qatar, Egypt and South Africa lead demand through desalination capacity, long-distance water transmission, network renewal programmes and industrial diversification projects.
Water scarcity is the decisive factor. Desalinated water carries a high energy and capital cost per cubic metre, so pumping efficiency and leakage control matter more than in water-rich regions. Barriers include high ambient temperatures that stress drive electronics, dust ingress, and a shortage of technicians able to commission and interpret pump analytics. The main opportunity is bundling intelligent pumps with long-term service and performance contracts on large utility projects.
Competitive Landscape
The intelligent pumps market is moderately concentrated. A group of established European, North American and Japanese manufacturers holds the majority of value in integrated drive pumps, supported by long-standing relationships with water utilities, consulting engineers and original equipment manufacturers. Below that tier sits a large field of regional pump makers in Asia Pacific competing on price in simpler duties, alongside drive and automation suppliers that address the same energy problem from the electrical side. Consolidation has been incremental, mostly through acquisitions of controls, instrumentation and analytics capability rather than of hydraulic manufacturing.
Competition is shifting from hydraulic performance to system intelligence. Vendors still compete on efficiency at duty point, materials, mean time between failures and service network coverage, but the differentiators that decide large tenders now include control algorithm quality, openness of data interfaces, cybersecurity posture, and the quality of fault diagnostics. Entrants come from two directions: industrial automation and drive suppliers extending into pump control, and independent software vendors offering fleet analytics that work across mixed-brand installations.
Strategic activity concentrates on building service and software businesses around the installed base. Manufacturers are developing subscription monitoring offers, certifying products against emerging cybersecurity requirements, expanding local assembly and service capacity in growth regions, and partnering with energy service companies so that first cost stops blocking conversion from bare pumps.
Strategic direction across the sector is converging on the extended product view. Vendors increasingly sell a guaranteed system outcome covering pump, motor, drive and controls, rather than components measured individually, and position data services as the durable part of the relationship.
Recent Industry Developments
- July 2023: The second tier of Commission Regulation (EU) 2019/1781 took effect, extending IE2 requirements to smaller motors and keeping variable speed drives within mandatory efficiency scope – it made drive-integrated pumping the compliant default across the European Union.
- January 2024: The Corporate Sustainability Reporting Directive began applying to the first wave of large undertakings for financial year 2024 – mandatory energy and emissions disclosure gave industrial pump users a reporting reason to meter and optimise pumping systems.
- October 2024: The transposition deadline for the NIS2 Directive fell due in the European Union, bringing water and wastewater operators into a stricter cybersecurity regime – it raised security requirements for connected pump controllers and remote access.
- December 2024: The Cyber Resilience Act, Regulation (EU) 2024/2847, entered into force, with its main obligations applying from December 2027 – it imposes secure development, vulnerability handling and update duties on products with digital elements, including pump controllers.
Companies Covered in the Report
- Grundfos
- Xylem
- KSB
- Wilo
- Sulzer
- Flowserve
- Ebara Corporation
- Danfoss
- ABB
- Pentair
- Kirloskar Brothers
- Armstrong Fluid Technology
- Franklin Electric
- SPX FLOW
Intelligent Pumps Market Report Scope
| Metric | Value |
| Study Period | 2020–2033 |
| Market Size 2026 | US$ 10.8 Billion |
| Market Size 2033 | US$ 19.6 Billion |
| CAGR 2026–2033 | 8.9% |
| Absolute Dollar Opportunity | US$ 8.8 Billion |
| Largest Market | Asia Pacific (31% share in 2026) |
| Fastest-Growing Market | Middle East & Africa (11.4% CAGR) |
| Market Concentration | Medium |
| Major Players | Grundfos, Xylem, KSB, Wilo, Sulzer |
Intelligent Pumps Market Segmentation
Product Type
- Smart Centrifugal Pumps
- Smart Positive Displacement Pumps
- Intelligent Pump Controllers
- Monitoring and Analytics Software
Connectivity
- Wired
- Wireless
- Hybrid
Power Rating
- Up to 5 kW
- 5 kW to 50 kW
- Above 50 kW
End Use
- Water and Wastewater
- Building Services
- Industrial Process
- Oil and Gas
- Agriculture and Irrigation
Regions
- North America
- Europe
- Asia Pacific
- Latin America
- Middle East & Africa
- Executive Summary
- Global Intelligent Pumps Market Snapshot
- Future Projections
- Key Report Takeaways
- Regional Snapshot
- Market Overview
- Market Definition and Report Scope
- Historical Trends 2020–2025
- Market Dynamics
- Drivers
- Pumping Energy Costs and Efficiency Rules Make Variable Speed the Default Specification
- Condition Monitoring Converts Pump Failures From Emergencies Into Scheduled Work
- Restraints
- First-Cost Premium Over Bare Pumps Keeps Price-Led Tenders on Conventional Equipment
- Cybersecurity Exposure of Networked Pumps Delays Utility and Plant Rollouts
- Market Opportunities
- Pumping-as-a-Service and Energy Performance Contracts Open a Recurring Revenue Pool
- Non-Revenue Water Reduction Creates a Pressure Management and Analytics Opportunity
- Drivers
- Global Intelligent Pumps Market Outlook, 2020–2033
- Global Intelligent Pumps Market Outlook, by Product Type, Value (US$ Billion), 2020–2033
- Smart Centrifugal Pumps
- Smart Positive Displacement Pumps
- Intelligent Pump Controllers
- Monitoring and Analytics Software
- Global Intelligent Pumps Market Outlook, by Connectivity, Value (US$ Billion), 2020–2033
- Wired
- Wireless
- Hybrid
- Global Intelligent Pumps Market Outlook, by Power Rating, Value (US$ Billion), 2020–2033
- Up to 5 kW
- 5 kW to 50 kW
- Above 50 kW
- Global Intelligent Pumps Market Outlook, by End Use, Value (US$ Billion), 2020–2033
- Water and Wastewater
- Building Services
- Industrial Process
- Oil and Gas
- Agriculture and Irrigation
- Global Intelligent Pumps Market Outlook, by Region, Value (US$ Billion), 2020–2033
- North America
- Europe
- Asia Pacific
- Latin America
- Middle East & Africa
- Global Intelligent Pumps Market Outlook, by Product Type, Value (US$ Billion), 2020–2033
- North America Intelligent Pumps Market Outlook, 2020–2033
- North America Intelligent Pumps Market Outlook, by Product Type, Value (US$ Billion), 2020–2033
- Smart Centrifugal Pumps
- Smart Positive Displacement Pumps
- Intelligent Pump Controllers
- Monitoring and Analytics Software
- North America Intelligent Pumps Market Outlook, by Connectivity, Value (US$ Billion), 2020–2033
- Wired
- Wireless
- Hybrid
- North America Intelligent Pumps Market Outlook, by Power Rating, Value (US$ Billion), 2020–2033
- Up to 5 kW
- 5 kW to 50 kW
- Above 50 kW
- North America Intelligent Pumps Market Outlook, by End Use, Value (US$ Billion), 2020–2033
- Water and Wastewater
- Building Services
- Industrial Process
- Oil and Gas
- Agriculture and Irrigation
- North America Intelligent Pumps Market Outlook, by Country, Value (US$ Billion), 2020–2033
- United States Intelligent Pumps Market Outlook, by Product Type, 2020–2033
- United States Intelligent Pumps Market Outlook, by Connectivity, 2020–2033
- United States Intelligent Pumps Market Outlook, by Power Rating, 2020–2033
- United States Intelligent Pumps Market Outlook, by End Use, 2020–2033
- Canada Intelligent Pumps Market Outlook, by Product Type, 2020–2033
- Canada Intelligent Pumps Market Outlook, by Connectivity, 2020–2033
- Canada Intelligent Pumps Market Outlook, by Power Rating, 2020–2033
- Canada Intelligent Pumps Market Outlook, by End Use, 2020–2033
- North America Intelligent Pumps Market Outlook, by Product Type, Value (US$ Billion), 2020–2033
- Europe Intelligent Pumps Market Outlook, 2020–2033
- Europe Intelligent Pumps Market Outlook, by Product Type, Value (US$ Billion), 2020–2033
- Smart Centrifugal Pumps
- Smart Positive Displacement Pumps
- Intelligent Pump Controllers
- Monitoring and Analytics Software
- Europe Intelligent Pumps Market Outlook, by Connectivity, Value (US$ Billion), 2020–2033
- Wired
- Wireless
- Hybrid
- Europe Intelligent Pumps Market Outlook, by Power Rating, Value (US$ Billion), 2020–2033
- Up to 5 kW
- 5 kW to 50 kW
- Above 50 kW
- Europe Intelligent Pumps Market Outlook, by End Use, Value (US$ Billion), 2020–2033
- Water and Wastewater
- Building Services
- Industrial Process
- Oil and Gas
- Agriculture and Irrigation
- Europe Intelligent Pumps Market Outlook, by Country, Value (US$ Billion), 2020–2033
- Germany Intelligent Pumps Market Outlook, by Product Type, 2020–2033
- Germany Intelligent Pumps Market Outlook, by Connectivity, 2020–2033
- Germany Intelligent Pumps Market Outlook, by Power Rating, 2020–2033
- Germany Intelligent Pumps Market Outlook, by End Use, 2020–2033
- Italy Intelligent Pumps Market Outlook, by Product Type, 2020–2033
- Italy Intelligent Pumps Market Outlook, by Connectivity, 2020–2033
- Italy Intelligent Pumps Market Outlook, by Power Rating, 2020–2033
- Italy Intelligent Pumps Market Outlook, by End Use, 2020–2033
- France Intelligent Pumps Market Outlook, by Product Type, 2020–2033
- France Intelligent Pumps Market Outlook, by Connectivity, 2020–2033
- France Intelligent Pumps Market Outlook, by Power Rating, 2020–2033
- France Intelligent Pumps Market Outlook, by End Use, 2020–2033
- United Kingdom Intelligent Pumps Market Outlook, by Product Type, 2020–2033
- United Kingdom Intelligent Pumps Market Outlook, by Connectivity, 2020–2033
- United Kingdom Intelligent Pumps Market Outlook, by Power Rating, 2020–2033
- United Kingdom Intelligent Pumps Market Outlook, by End Use, 2020–2033
- Nordic countries Intelligent Pumps Market Outlook, by Product Type, 2020–2033
- Nordic countries Intelligent Pumps Market Outlook, by Connectivity, 2020–2033
- Nordic countries Intelligent Pumps Market Outlook, by Power Rating, 2020–2033
- Nordic countries Intelligent Pumps Market Outlook, by End Use, 2020–2033
- Europe Intelligent Pumps Market Outlook, by Product Type, Value (US$ Billion), 2020–2033
- Asia Pacific Intelligent Pumps Market Outlook, 2020–2033
- Asia Pacific Intelligent Pumps Market Outlook, by Product Type, Value (US$ Billion), 2020–2033
- Smart Centrifugal Pumps
- Smart Positive Displacement Pumps
- Intelligent Pump Controllers
- Monitoring and Analytics Software
- Asia Pacific Intelligent Pumps Market Outlook, by Connectivity, Value (US$ Billion), 2020–2033
- Wired
- Wireless
- Hybrid
- Asia Pacific Intelligent Pumps Market Outlook, by Power Rating, Value (US$ Billion), 2020–2033
- Up to 5 kW
- 5 kW to 50 kW
- Above 50 kW
- Asia Pacific Intelligent Pumps Market Outlook, by End Use, Value (US$ Billion), 2020–2033
- Water and Wastewater
- Building Services
- Industrial Process
- Oil and Gas
- Agriculture and Irrigation
- Asia Pacific Intelligent Pumps Market Outlook, by Country, Value (US$ Billion), 2020–2033
- China Intelligent Pumps Market Outlook, by Product Type, 2020–2033
- China Intelligent Pumps Market Outlook, by Connectivity, 2020–2033
- China Intelligent Pumps Market Outlook, by Power Rating, 2020–2033
- China Intelligent Pumps Market Outlook, by End Use, 2020–2033
- India Intelligent Pumps Market Outlook, by Product Type, 2020–2033
- India Intelligent Pumps Market Outlook, by Connectivity, 2020–2033
- India Intelligent Pumps Market Outlook, by Power Rating, 2020–2033
- India Intelligent Pumps Market Outlook, by End Use, 2020–2033
- Japan Intelligent Pumps Market Outlook, by Product Type, 2020–2033
- Japan Intelligent Pumps Market Outlook, by Connectivity, 2020–2033
- Japan Intelligent Pumps Market Outlook, by Power Rating, 2020–2033
- Japan Intelligent Pumps Market Outlook, by End Use, 2020–2033
- South Korea Intelligent Pumps Market Outlook, by Product Type, 2020–2033
- South Korea Intelligent Pumps Market Outlook, by Connectivity, 2020–2033
- South Korea Intelligent Pumps Market Outlook, by Power Rating, 2020–2033
- South Korea Intelligent Pumps Market Outlook, by End Use, 2020–2033
- Australia Intelligent Pumps Market Outlook, by Product Type, 2020–2033
- Australia Intelligent Pumps Market Outlook, by Connectivity, 2020–2033
- Australia Intelligent Pumps Market Outlook, by Power Rating, 2020–2033
- Australia Intelligent Pumps Market Outlook, by End Use, 2020–2033
- Asia Pacific Intelligent Pumps Market Outlook, by Product Type, Value (US$ Billion), 2020–2033
- Latin America Intelligent Pumps Market Outlook, 2020–2033
- Latin America Intelligent Pumps Market Outlook, by Product Type, Value (US$ Billion), 2020–2033
- Smart Centrifugal Pumps
- Smart Positive Displacement Pumps
- Intelligent Pump Controllers
- Monitoring and Analytics Software
- Latin America Intelligent Pumps Market Outlook, by Connectivity, Value (US$ Billion), 2020–2033
- Wired
- Wireless
- Hybrid
- Latin America Intelligent Pumps Market Outlook, by Power Rating, Value (US$ Billion), 2020–2033
- Up to 5 kW
- 5 kW to 50 kW
- Above 50 kW
- Latin America Intelligent Pumps Market Outlook, by End Use, Value (US$ Billion), 2020–2033
- Water and Wastewater
- Building Services
- Industrial Process
- Oil and Gas
- Agriculture and Irrigation
- Latin America Intelligent Pumps Market Outlook, by Country, Value (US$ Billion), 2020–2033
- Brazil Intelligent Pumps Market Outlook, by Product Type, 2020–2033
- Brazil Intelligent Pumps Market Outlook, by Connectivity, 2020–2033
- Brazil Intelligent Pumps Market Outlook, by Power Rating, 2020–2033
- Brazil Intelligent Pumps Market Outlook, by End Use, 2020–2033
- Mexico Intelligent Pumps Market Outlook, by Product Type, 2020–2033
- Mexico Intelligent Pumps Market Outlook, by Connectivity, 2020–2033
- Mexico Intelligent Pumps Market Outlook, by Power Rating, 2020–2033
- Mexico Intelligent Pumps Market Outlook, by End Use, 2020–2033
- Chile Intelligent Pumps Market Outlook, by Product Type, 2020–2033
- Chile Intelligent Pumps Market Outlook, by Connectivity, 2020–2033
- Chile Intelligent Pumps Market Outlook, by Power Rating, 2020–2033
- Chile Intelligent Pumps Market Outlook, by End Use, 2020–2033
- Peru Intelligent Pumps Market Outlook, by Product Type, 2020–2033
- Peru Intelligent Pumps Market Outlook, by Connectivity, 2020–2033
- Peru Intelligent Pumps Market Outlook, by Power Rating, 2020–2033
- Peru Intelligent Pumps Market Outlook, by End Use, 2020–2033
- Colombia Intelligent Pumps Market Outlook, by Product Type, 2020–2033
- Colombia Intelligent Pumps Market Outlook, by Connectivity, 2020–2033
- Colombia Intelligent Pumps Market Outlook, by Power Rating, 2020–2033
- Colombia Intelligent Pumps Market Outlook, by End Use, 2020–2033
- Latin America Intelligent Pumps Market Outlook, by Product Type, Value (US$ Billion), 2020–2033
- Middle East & Africa Intelligent Pumps Market Outlook, 2020–2033
- Middle East & Africa Intelligent Pumps Market Outlook, by Product Type, Value (US$ Billion), 2020–2033
- Smart Centrifugal Pumps
- Smart Positive Displacement Pumps
- Intelligent Pump Controllers
- Monitoring and Analytics Software
- Middle East & Africa Intelligent Pumps Market Outlook, by Connectivity, Value (US$ Billion), 2020–2033
- Wired
- Wireless
- Hybrid
- Middle East & Africa Intelligent Pumps Market Outlook, by Power Rating, Value (US$ Billion), 2020–2033
- Up to 5 kW
- 5 kW to 50 kW
- Above 50 kW
- Middle East & Africa Intelligent Pumps Market Outlook, by End Use, Value (US$ Billion), 2020–2033
- Water and Wastewater
- Building Services
- Industrial Process
- Oil and Gas
- Agriculture and Irrigation
- Middle East & Africa Intelligent Pumps Market Outlook, by Country, Value (US$ Billion), 2020–2033
- Saudi Arabia Intelligent Pumps Market Outlook, by Product Type, 2020–2033
- Saudi Arabia Intelligent Pumps Market Outlook, by Connectivity, 2020–2033
- Saudi Arabia Intelligent Pumps Market Outlook, by Power Rating, 2020–2033
- Saudi Arabia Intelligent Pumps Market Outlook, by End Use, 2020–2033
- United Arab Emirates Intelligent Pumps Market Outlook, by Product Type, 2020–2033
- United Arab Emirates Intelligent Pumps Market Outlook, by Connectivity, 2020–2033
- United Arab Emirates Intelligent Pumps Market Outlook, by Power Rating, 2020–2033
- United Arab Emirates Intelligent Pumps Market Outlook, by End Use, 2020–2033
- Qatar Intelligent Pumps Market Outlook, by Product Type, 2020–2033
- Qatar Intelligent Pumps Market Outlook, by Connectivity, 2020–2033
- Qatar Intelligent Pumps Market Outlook, by Power Rating, 2020–2033
- Qatar Intelligent Pumps Market Outlook, by End Use, 2020–2033
- Egypt Intelligent Pumps Market Outlook, by Product Type, 2020–2033
- Egypt Intelligent Pumps Market Outlook, by Connectivity, 2020–2033
- Egypt Intelligent Pumps Market Outlook, by Power Rating, 2020–2033
- Egypt Intelligent Pumps Market Outlook, by End Use, 2020–2033
- South Africa Intelligent Pumps Market Outlook, by Product Type, 2020–2033
- South Africa Intelligent Pumps Market Outlook, by Connectivity, 2020–2033
- South Africa Intelligent Pumps Market Outlook, by Power Rating, 2020–2033
- South Africa Intelligent Pumps Market Outlook, by End Use, 2020–2033
- Middle East & Africa Intelligent Pumps Market Outlook, by Product Type, Value (US$ Billion), 2020–2033
- Competitive Landscape
- Market Concentration and Industry Leaders
- Competitive Differentiation
- Strategic Moves and Market Direction
- Recent Industry Developments
- Company Profiles
- Grundfos
- Xylem
- KSB
- Wilo
- Sulzer
- Flowserve
- Ebara Corporation
- Danfoss
- ABB
- Pentair
- Kirloskar Brothers
- Armstrong Fluid Technology
- Franklin Electric
- SPX FLOW
- Appendix
- Research Methodology
- Report Assumptions
- Acronyms and Abbreviations
Product Type
- Smart Centrifugal Pumps
- Smart Positive Displacement Pumps
- Intelligent Pump Controllers
- Monitoring and Analytics Software
Connectivity
- Wired
- Wireless
- Hybrid
Power Rating
- Up to 5 kW
- 5 kW to 50 kW
- Above 50 kW
End Use
- Water and Wastewater
- Building Services
- Industrial Process
- Oil and Gas
- Agriculture and Irrigation
Regions
- North America
- Europe
- Asia Pacific
- Latin America
- Middle East & Africa
Our Research Methodology
Considering the volatility of business today, traditional approaches to strategizing a game plan can be unfruitful if not detrimental. True ambiguity is no way to determine a forecast. A myriad of predetermined factors must be accounted for such as the degree of risk involved, the magnitude of circumstances, as well as conditions or consequences that are not known or unpredictable. To circumvent binary views that cast uncertainty, the application of market research intelligence to strategically posture, move, and enable actionable outcomes is necessary.
View Methodology
Quality Assured
Rigorous Validation Process

Confidentiality Assured
End-to-end Data Security

Custom Research Services
Tailored To Your Objectives
FAQs
The intelligent pumps market is valued at US$ 10.8 billion in 2026, counting pump units with integrated drives and controls, controllers and analytics software.
The market is projected to reach US$ 19.6 billion by 2033 at an 8.9% CAGR, an absolute dollar opportunity of US$ 8.8 billion.
Smart Centrifugal Pumps lead with 58.7% share in 2026, since centrifugal designs dominate water, building services and process duties and gain most from variable speed.
Monitoring and Analytics Software grows fastest at a 13.8% CAGR, as operators buy fleet condition insight separately from the pumps that generate the data.
Asia Pacific holds 31% share in 2026, driven by urban water construction, large industrial process capacity and regional pump and motor manufacturing.
Related Reports
Load Forecasting Solution Market Size, Share, Insights, Competitive Landscape, and Forecast 2026 to 2033
The load forecasting solution market is projected to reach US$3.0 billion by 2033. Explore demand by forecast horizon, deployment mode, and end user.
Enhanced Oil Recovery Market Size, Share, Insights, Competitive Landscape, and Forecast 2026 to 2033
The global enhanced oil recovery market is valued at US$46.5 billion in 2026, reaching US$58.9 billion by 2033, growing at a 3.43% CAGR
Biochar Gasification Market Size, Share, Insights, Competitive Landscape, and Forecast 2026 to 2033
The global biochar gasification market is valued at US$0.6 billion in 2026, reaching US$1.4 billion by 2033, growing at a 12.87% CAGR
AC-Coupled Energy Storage Inverter Market Size, Share, Insights, Competitive Landscape, and Forecast 2026 to 2033
The AC-coupled energy storage inverter market is forecast to grow from US$ 4.2 billion in 2026 to US$ 10.5 billion by 2033 at a 13.99% CAGR.
Steam Turbine Aftermarket Size, Share, Insights, Competitive Landscape, and Forecast 2026 to 2033
The Steam Turbine Aftermarket is projected to rise from US$ 4.56 billion in 2026 to US$ 6.29 billion by 2033 at a 4.7% CAGR. Explore key service trends.
Power EPC Market Size, Share, Insights, Competitive Landscape, and Forecast 2026 to 2033
Power EPC Market is projected to rise from US$ 780.56 billion in 2026 to US$ 1,220.97 billion by 2033 at a 6.6% CAGR. Explore generation and project trends.