



Nickel Market
Nickel Market Size, Share, Insights, Competitive Landscape, and Forecast 2026 to 2033
Nickel Market Size and Trend Analysis
What Is the Outlook for Nickel Demand to 2033?
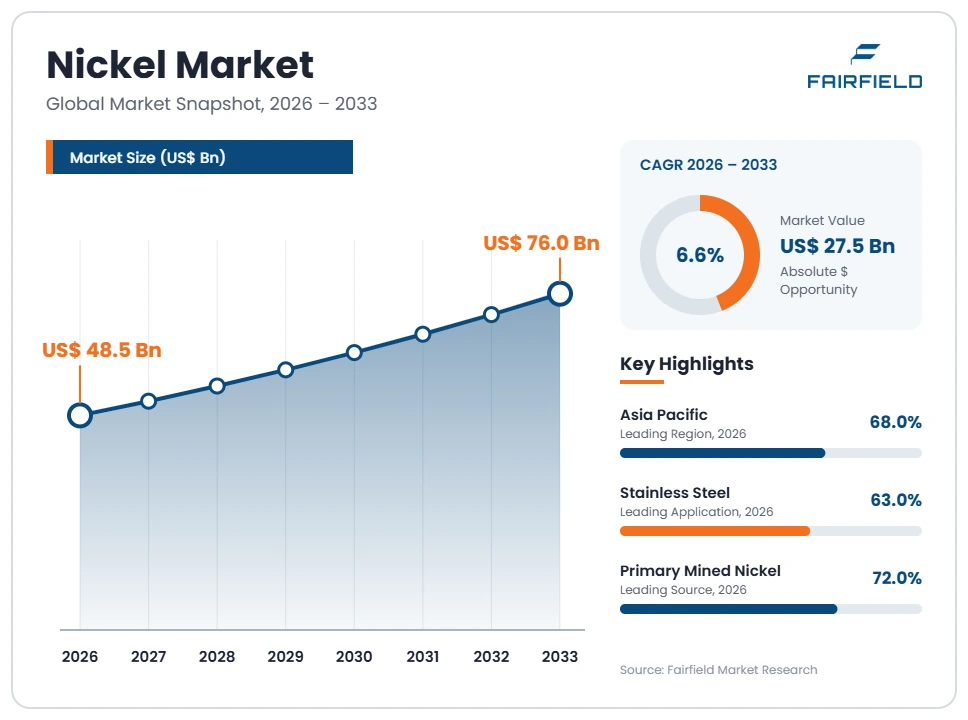
The global Nickel market size is expected to be valued at US$ 48.5 billion in 2026 and projected to reach US$ 76.0 billion by 2033, growing at a CAGR of 6.6% between 2026 and 2033.
Market value is measured as refined nickel and nickel unit sales valued at prevailing market prices, so it moves with price as well as with tonnage. Between 2020 and 2025 value grew at roughly a 5.2% CAGR, a figure that conceals a violent price spike followed by a deep slump. Three factors shape the outlook. Stainless steel output continues to set baseline consumption. Battery-grade nickel sulphate adds a smaller but faster-expanding demand stream. A supply surge centred on Indonesia has pushed prices down and squeezed higher-cost producers. Volumes should keep rising steadily, while price recovery, not tonnage, determines how quickly value returns.
Key Report Takeaways
- By Product Form: Class 2 nickel, covering ferronickel and nickel pig iron, held 46% share in 2026, while nickel sulphate is projected to expand at a 9.4% CAGR through 2033, driven by cathode precursor production.
- By Application: Stainless steel accounted for 63% of nickel consumption in 2026, while batteries are projected to grow at a 9.8% CAGR through 2033, despite lower nickel intensity in newer cell chemistries.
- By Production Route: Pyrometallurgical smelting held 58% share in 2026, while high-pressure acid leach capacity is projected to rise at an 11.2% CAGR through 2033, converting laterite ore into battery intermediates.
- By Source: Primary mined nickel represented 72% of supply in 2026, while secondary nickel from scrap is projected to advance at a 7.9% CAGR through 2033, supported by recycled content rules.
- By Geography: Asia Pacific held 68% share in 2026, while Indonesia is projected to record an 8.8% CAGR through 2033, as domestic processing capacity continues to absorb its own ore.
Global Nickel Market Trends and Insights
Drivers Impact Analysis
Two demand forces account for most of the projected growth in nickel value.
| Driver | Impact on CAGR Forecast | Geographic Relevance | Impact Timeline |
| Stainless steel output growth across construction and process industries | High | Asia Pacific, Europe | Long term ≥4 years |
| Policy-driven localisation of battery-grade nickel supply chains | Medium | North America, Europe, Asia Pacific | Medium term 2–4 years |
Stainless Steel Production Anchors Baseline Nickel Consumption
Stainless steel remains by far the largest use of nickel and sets the floor under consumption. Austenitic grades such as 304 and 316 contain meaningful nickel, and they dominate architectural cladding, food processing equipment, chemical plant, desalination hardware and kitchenware. Because stainless output is counted in tens of millions of tonnes annually, even modest percentage growth absorbs far more nickel than the entire battery sector.
The mechanism runs through industrialisation and asset renewal. Urban construction, water treatment, liquefied natural gas processing and pharmaceutical plant all specify corrosion-resistant steels, and substitution options are limited where chloride exposure or hygiene standards apply. Chinese and Indonesian mills have added very large melting capacity close to nickel pig iron supply, which lowers delivered cost and encourages wider specification of austenitic grades across price-sensitive applications.
Critical Mineral Policy Pulls Battery-Grade Nickel Into Regional Supply Chains
Government critical mineral policy is reshaping where nickel units are refined and at what premium. Regulation (EU) 2024/1252, the European Critical Raw Materials Act, lists nickel among strategic raw materials and sets domestic extraction, processing and recycling benchmarks. In the United States, the Inflation Reduction Act ties vehicle tax credits to sourcing critical minerals from the country or its free trade partners, which creates a two-tier market for qualifying units.
The causal chain is commercial rather than technical. Automakers and cell producers must document provenance to claim incentives, so they sign offtake agreements with refiners in eligible jurisdictions and accept higher prices for compliant material. That premium justifies investment in sulphate refining, mixed hydroxide precipitate processing and recycling capacity outside the dominant producing region, lifting the value captured per tonne.
Restraints Impact Analysis
Two structural constraints limit nickel value growth over the forecast period.
| Restraint | Impact on CAGR Forecast | Geographic Relevance | Impact Timeline |
| Oversupply from rapid Indonesian capacity additions depressing prices | High | Global | Short term ≤2 years |
| Lithium iron phosphate battery chemistry reducing nickel intensity | Medium | Asia Pacific, Europe | Medium term 2–4 years |
Indonesian Supply Growth Has Pushed Nickel Prices Below Higher-Cost Producer Economics
A supply surge has been the dominant restraint on nickel market value. Capacity built in Indonesia over a short period added more units than demand could absorb, moving the market into sustained surplus and pulling prices well below the levels of the early decade. Because this study values nickel at prevailing market prices, falling prices reduce market value even while tonnage rises.
The cost cause is structural, not cyclical. Rotary kiln electric furnace lines in Indonesia sit close to laterite ore, run on captive coal-fired power and operate at industrial park scale, which places them near the bottom of the global cost curve. Higher-cost sulphide operations in Australia, Canada, New Caledonia and elsewhere cannot match that delivered cash cost per tonne, so they face curtailment pressure, and several marginal assets have been placed under review.
Lithium Iron Phosphate Chemistry Lowers Expected Nickel Demand per Battery
Battery chemistry choice now limits the upside once expected from electric vehicles. Lithium iron phosphate cells contain no nickel at all, and their share of global electric vehicle production has risen sharply because they are cheaper, safer under thermal abuse and durable over many cycles. Every percentage point of share they take from nickel-rich cathodes removes forecast nickel demand.
The underlying cause is cost per kilowatt-hour rather than performance alone. Falling cell prices and improved pack-level energy density have narrowed the practical range gap, making the chemistry acceptable for standard-range and entry models and for stationary storage. Manganese-rich and sodium-ion chemistries extend the same pressure. Nickel-rich cathodes retain an advantage in premium long-range vehicles, so the battery pull on nickel is real but smaller than earlier projections assumed.
Market Opportunities
Two revenue pools sit outside the traditional primary nickel business.
Recycling and Scrap Refining Open a Secondary Nickel Revenue Pool
Secondary nickel is the clearest emerging revenue pool in this market. Stainless steel scrap already supplies a large share of melt input, and end-of-life battery recycling now adds a second stream of nickel-bearing black mass. Refiners able to turn mixed scrap and black mass into battery-grade sulphate or high-purity cathode capture value without carrying mining capital or exploration risk.
Cell producers and automakers create the demand, because recycled content and provenance documentation support compliance with European Union battery rules and with critical mineral sourcing conditions in North America. Recyclers, specialist hydrometallurgical processors and existing refiners with spare leaching and solvent extraction capacity are best positioned to serve them. Falling primary prices compress recycling margins in the near term, so the opportunity favours operators with low processing costs and secured feedstock contracts.
Low-Carbon and Traceable Nickel Creates a Premium Product Opportunity
Documented low-carbon nickel is becoming a distinct product with its own pricing logic, separate from the exchange benchmark. Buyers increasingly ask for the embedded emissions of each tonne, because nickel produced with hydroelectric or gas-fired power carries a far smaller footprint than output from captive coal-fired plants. That difference is measurable, auditable and now contractually relevant in long-term supply agreements.
Automakers, cell manufacturers and stainless-consuming consumer brands drive the demand, since their own disclosed emissions include purchased materials. Producers in Canada, Finland, Brazil and Australia with cleaner power and sulphide feed are best placed to capture it, alongside operations investing in renewable supply and in hydrometallurgical routes with lower energy intensity. Independent audit schemes and emerging product carbon footprint rules under European Union legislation give the premium a verifiable basis.
Segment Analysis
- By Product Form: Class 2 Nickel Leads While Battery-Grade Sulphate Expands Quickest
Class 2 nickel, comprising ferronickel and nickel pig iron, held 46% of the market in 2026. It leads because stainless steel mills can take nickel units directly in these forms without refining to high purity, which makes them the cheapest route to a tonne of contained nickel. Class 1 products such as briquettes, cathode and powder follow, serving alloy, plating and some battery uses.
Nickel sulphate is the fastest-growing form at a 9.4% CAGR through 2033, feeding cathode precursor plants. Intermediates including mixed hydroxide precipitate and matte are expanding alongside it, and their rise has blurred the old distinction between the two nickel classes, since laterite-derived units now reach battery-grade purity. For producers the implication is that form flexibility, not ore type, increasingly determines which end markets an asset can serve.
- By Application: Stainless Steel Dominates Consumption While Batteries Grow Fastest
Stainless steel accounted for 63% of nickel consumption in 2026 and remains the decisive end use. Austenitic grades need nickel for corrosion resistance and formability, and no economic substitute exists at scale for chloride-exposed service. Alloys and superalloys for aerospace, energy turbines and oil and gas equipment form the next block, followed by electroplating, foundry and chemical catalyst uses.
Batteries are the fastest-growing application at a 9.8% CAGR to 2033, even though nickel intensity per vehicle is lower than once expected. Nickel-rich cathodes retain their position in long-range and premium models where energy density commands a price. The business implication is sobering for anyone who built a thesis on batteries alone: the stainless cycle, not electric vehicles, still determines whether the nickel market is in surplus or deficit.
- By Production Route: Pyrometallurgical Smelting Leads While Acid Leach Capacity Scales Fastest
Pyrometallurgical smelting, principally the rotary kiln electric furnace route, held 58% of production in 2026. It leads on simplicity and cost for saprolite laterite ore, and it underpins the nickel pig iron and ferronickel supply that feeds stainless mills. Conventional sulphide smelting and refining accounts for a further substantial share, producing high-purity Class 1 metal.
High-pressure acid leach is the fastest-growing route at an 11.2% CAGR through 2033. It treats lower-grade limonite ore that smelting cannot use economically and yields mixed hydroxide precipitate suitable for sulphate refining. Matte conversion provides a parallel path from intermediate to battery feed. Both routes are capital intensive and historically difficult to commission, but they decide whether laterite resources can serve battery demand rather than stainless alone.
- By Source: Primary Mined Nickel Supplies the Bulk While Secondary Units Rise Faster
Primary mined nickel represented 72% of supply in 2026. Its dominance reflects the sheer scale of laterite mining and the fact that demand growth has outpaced the availability of nickel-bearing scrap. Primary output also offers the consistent chemistry that alloy and battery customers specify, with documented impurity levels.
Secondary nickel from scrap is growing faster, at a 7.9% CAGR through 2033. Stainless scrap collection is improving in mature economies, and the first substantial cohorts of end-of-life electric vehicle batteries are now reaching recyclers. Recycled content targets in European Union legislation give the stream a regulatory pull as well as an economic one. The implication is that scrap availability, rather than new mine supply, will increasingly set the marginal cost of nickel units in mature regions.
Geography Analysis
- North America Focuses on Securing Qualifying Nickel Units for Battery Supply Chains
North America accounted for 9% of global nickel market value in 2026, with Canada the main producing country and the United States the larger consumer. Canadian sulphide operations in Ontario, Manitoba and Newfoundland and Labrador produce high-purity Class 1 metal with comparatively low emissions intensity, which suits both superalloy and battery customers.
Policy is the dominant regional variable. The Inflation Reduction Act conditions vehicle tax credits on critical mineral sourcing from the country or its free trade partners, creating demand for qualifying units and supporting refining and recycling investment. Permitting timelines and high labour costs remain the principal barriers to new mine development. The clearest opportunity lies in domestic sulphate refining and black mass processing, which convert imported intermediates into compliant battery feed.
- Europe Combines Specialty Steel Demand With Strict Chemical and Emissions Rules
Europe held 13% of market value in 2026, led by consumption in Germany, Italy, Spain and France, with refining and mining capacity in Finland and Norway. Demand is weighted toward specialty stainless grades, superalloys for aerospace and energy, and a growing cell manufacturing base that needs sulphate.
Regulation shapes the region more than geology does. Regulation (EU) 2024/1252 lists nickel as a strategic raw material and sets processing and recycling benchmarks, while REACH classifications applying to several nickel compounds impose handling, exposure and authorisation duties that raise compliance costs for refiners and platers. High industrial electricity prices are the main barrier to expanded smelting. The opportunity lies in recycling and in low-carbon refining, where clean Nordic power provides a genuine structural advantage.
- Which Region Is Leading the Nickel Market?
Asia Pacific is leading the nickel market with 68% share in 2026, by a very wide margin. Indonesia supplies the majority of global mined and processed nickel, China operates the largest stainless melting and sulphate refining complex in the world, and Japan and South Korea host major refining and cathode precursor capacity. The Philippines and New Caledonia add substantial ore and ferronickel supply.
Three causes sustain the lead. Laterite resources sit close to industrial parks with captive power, producing the lowest delivered cost globally. Stainless melting capacity has been built alongside that nickel supply, shortening the chain from ore to finished product. Battery supply chains are concentrated in the same geography. Environmental scrutiny of coal-fired processing power, land clearance and tailings management is the region’s most serious barrier and a legitimate concern.
- Which Country Is Growing Fastest in the Nickel Market?
Indonesia is growing fastest in the nickel market, at an 8.8% CAGR between 2026 and 2033, extending a transformation already well advanced. A government downstreaming strategy restricted exports of unprocessed ore and required domestic processing, which drew very large investment into smelting, acid leach and matte conversion capacity within the country rather than abroad.
The causes are policy and geology together. Extensive laterite deposits lie near the coast at Sulawesi and Halmahera, allowing integrated industrial parks that combine mining, power generation, processing and stainless melting on one site. Those parks now produce both stainless feed and battery intermediates. The barriers are equally clear: reliance on coal-fired captive power, deforestation and tailings concerns, and the risk that further capacity deepens the global surplus and weakens prices for everyone.
- Latin America Supplies Laterite Ore and Ferronickel With Limited Downstream Refining
Latin America represented 6% of market value in 2026, with Brazil, Colombia, Guatemala and the Dominican Republic the principal producers. Most output is laterite-derived ferronickel or intermediate product exported to mills elsewhere, so the region captures mining margin rather than refining or alloying margin.
Barriers are consistent across the region. Power supply is costly in several producing countries, infrastructure to the coast is uneven, community consultation and permitting are lengthy, and currency volatility complicates long-term capital commitments. Weak nickel prices have pressured marginal operations hardest here. The opportunity is real but conditional: Brazil has hydroelectric power and an established mining industry, which could support low-carbon nickel production if producers can finance refining capacity through a low-price period.
- Middle East & Africa Hold Resources That Remain Largely Undeveloped
Middle East & Africa accounted for 4% of market value in 2026, the smallest regional position. Production is concentrated in a handful of countries, with sulphide output in South Africa and Zimbabwe often recovered as a by-product of platinum group metal mining, and laterite resources identified in Madagascar, Tanzania and Burundi.
The barriers are structural. Power reliability, rail and port capacity, security conditions in several prospective districts, and the scale of capital needed for acid leach plants all deter development, particularly while prices sit near the cost curve. Processing capacity is limited, so most nickel units leave as concentrate. Gulf states with low-cost energy and sovereign investment capacity have signalled interest in metals processing, which offers the most plausible route to refining capacity in the region.
Competitive Landscape
The nickel market is moderately concentrated, and its structure has changed markedly in recent years. A group of diversified miners and integrated metals groups historically controlled most Class 1 supply, but the balance of production has shifted toward Indonesian industrial park operators and Chinese-backed processing ventures that now supply the majority of global units. Consolidation pressure is rising at the higher-cost end, where sulphide operations face curtailment or care and maintenance decisions, while the low-cost end continues to add capacity.
Competition rests mainly on position on the cost curve. Delivered cash cost per tonne, ore grade and strip ratio, access to captive power, and proximity between mine and processing plant determine who survives a low-price period. A second and growing basis of competition is product qualification: the ability to supply battery-grade sulphate or intermediate with documented impurity limits, verified provenance and a credible carbon footprint. New entrants have arrived chiefly through integrated industrial parks and through recyclers processing black mass into refined nickel units.
Strategic activity divides along the same line. Low-cost producers continue to expand processing capacity and to add conversion steps that turn intermediates into battery feed, which lets one asset serve both the stainless and battery markets. Higher-cost producers are cutting costs, deferring expansion and reviewing marginal assets, while emphasising emissions intensity and traceability to defend price. Recycling joint ventures and long-term offtake agreements with cell makers are the most common commercial arrangements, because both sides value volume certainty in a volatile price environment.
Strategic direction across the industry is converging on three themes: surviving a prolonged surplus through cost discipline, building optionality between stainless and battery end markets, and documenting provenance and emissions to access policy-driven premium demand.
Recent Industry Developments
- January 2020: Indonesia brought forward its ban on exports of unprocessed nickel ore – the measure forced processing to be built inside the country and set the foundation for its dominance of global supply.
- March 2022: The London Metal Exchange suspended nickel trading and cancelled a day of trades after an extreme price move – the episode damaged confidence in the benchmark and pushed some participants toward alternative pricing references.
- November 2022: A World Trade Organization panel report found against Indonesia in the dispute brought by the European Union over its nickel ore export restrictions – it tested, without reversing, the legality of downstreaming policy.
- August 2022: The Inflation Reduction Act was signed into law in the United States, linking vehicle tax credits to critical mineral sourcing – it created a premium segment for nickel units from qualifying jurisdictions.
- May 2024: Regulation (EU) 2024/1252, the European Critical Raw Materials Act, entered into force listing nickel as a strategic raw material – it sets processing and recycling benchmarks that shape European refining investment.
Companies Covered in the Report
- Vale S.A.
- Glencore plc
- BHP Group Limited
- Nornickel
- Jinchuan Group
- Tsingshan Holding Group
- Eramet S.A.
- Sumitomo Metal Mining Co., Ltd.
- Anglo American plc
- South32 Limited
- Sherritt International Corporation
- IGO Limited
- Lygend Resources & Technology
- Zhejiang Huayou Cobalt Co., Ltd.
- PT Aneka Tambang Tbk
- Terrafame Ltd.
- Nickel Asia Corporation
- Korea Zinc Co., Ltd.
Nickel Market Report Scope
| Metric | Value |
| Study Period | 2020–2033 |
| Market Size 2026 | US$ 48.5 Billion |
| Market Size 2033 | US$ 76.0 Billion |
| CAGR 2026–2033 | 6.6% |
| Absolute Dollar Opportunity | US$ 27.5 Billion |
| Largest Market | Asia Pacific, 68% share in 2026 |
| Fastest-Growing Market | Indonesia, 8.8% CAGR 2026–2033 |
| Market Concentration | Medium |
| Major Players | Vale S.A., Glencore plc, BHP Group Limited, Nornickel, Jinchuan Group |
Nickel Market Segmentation
Product Form
- Class 1 nickel: briquettes, cathode and powder
- Class 2 nickel: ferronickel and nickel pig iron
- Nickel sulphate
- Intermediates: mixed hydroxide precipitate and matte
- Nickel oxide and other compounds
Application
- Stainless steel
- Batteries
- Alloys and superalloys
- Electroplating
- Foundry and castings
- Catalysts and other uses
Production Route
- Pyrometallurgical smelting
- High-pressure acid leach
- Matte conversion
- Refining and electrowinning
Source
- Primary mined nickel
- Secondary nickel from scrap
Regions
- North America
- Europe
- Asia Pacific
- Latin America
- Middle East & Africa
- Executive Summary
- Global Nickel Market Snapshot
- Future Projections
- Key Report Takeaways
- Regional Snapshot
- Market Overview
- Market Definition and Report Scope
- Historical Trends 2020–2025
- Market Dynamics
- Drivers
- Stainless Steel Production Anchors Baseline Nickel Consumption
- Critical Mineral Policy Pulls Battery-Grade Nickel Into Regional Supply Chains
- Restraints
- Indonesian Supply Growth Has Pushed Nickel Prices Below Higher-Cost Producer Economics
- Lithium Iron Phosphate Chemistry Lowers Expected Nickel Demand per Battery
- Market Opportunities
- Recycling and Scrap Refining Open a Secondary Nickel Revenue Pool
- Low-Carbon and Traceable Nickel Creates a Premium Product Opportunity
- Drivers
- Global Nickel Market Outlook, 2020–2033
- Global Nickel Market Outlook, by Product Form, Value (US$ Billion), 2020–2033
- Class 1 nickel: briquettes, cathode and powder
- Class 2 nickel: ferronickel and nickel pig iron
- Nickel sulphate
- Intermediates: mixed hydroxide precipitate and matte
- Nickel oxide and other compounds
- Global Nickel Market Outlook, by Application, Value (US$ Billion), 2020–2033
- Stainless steel
- Batteries
- Alloys and superalloys
- Electroplating
- Foundry and castings
- Catalysts and other uses
- Global Nickel Market Outlook, by Production Route, Value (US$ Billion), 2020–2033
- Pyrometallurgical smelting
- High-pressure acid leach
- Matte conversion
- Refining and electrowinning
- Global Nickel Market Outlook, by Source, Value (US$ Billion), 2020–2033
- Primary mined nickel
- Secondary nickel from scrap
- Global Nickel Market Outlook, by Region, Value (US$ Billion), 2020–2033
- North America
- Europe
- Asia Pacific
- Latin America
- Middle East & Africa
- Global Nickel Market Outlook, by Product Form, Value (US$ Billion), 2020–2033
- North America Nickel Market Outlook, 2020–2033
- North America Nickel Market Outlook, by Product Form, Value (US$ Billion), 2020–2033
- Class 1 nickel: briquettes, cathode and powder
- Class 2 nickel: ferronickel and nickel pig iron
- Nickel sulphate
- Intermediates: mixed hydroxide precipitate and matte
- Nickel oxide and other compounds
- North America Nickel Market Outlook, by Application, Value (US$ Billion), 2020–2033
- Stainless steel
- Batteries
- Alloys and superalloys
- Electroplating
- Foundry and castings
- Catalysts and other uses
- North America Nickel Market Outlook, by Production Route, Value (US$ Billion), 2020–2033
- Pyrometallurgical smelting
- High-pressure acid leach
- Matte conversion
- Refining and electrowinning
- North America Nickel Market Outlook, by Source, Value (US$ Billion), 2020–2033
- Primary mined nickel
- Secondary nickel from scrap
- North America Nickel Market Outlook, by Country, Value (US$ Billion), 2020–2033
- Canada Nickel Market Outlook, by Product Form, 2020–2033
- Canada Nickel Market Outlook, by Application, 2020–2033
- Canada Nickel Market Outlook, by Production Route, 2020–2033
- Canada Nickel Market Outlook, by Source, 2020–2033
- United States Nickel Market Outlook, by Product Form, 2020–2033
- United States Nickel Market Outlook, by Application, 2020–2033
- United States Nickel Market Outlook, by Production Route, 2020–2033
- United States Nickel Market Outlook, by Source, 2020–2033
- North America Nickel Market Outlook, by Product Form, Value (US$ Billion), 2020–2033
- Europe Nickel Market Outlook, 2020–2033
- Europe Nickel Market Outlook, by Product Form, Value (US$ Billion), 2020–2033
- Class 1 nickel: briquettes, cathode and powder
- Class 2 nickel: ferronickel and nickel pig iron
- Nickel sulphate
- Intermediates: mixed hydroxide precipitate and matte
- Nickel oxide and other compounds
- Europe Nickel Market Outlook, by Application, Value (US$ Billion), 2020–2033
- Stainless steel
- Batteries
- Alloys and superalloys
- Electroplating
- Foundry and castings
- Catalysts and other uses
- Europe Nickel Market Outlook, by Production Route, Value (US$ Billion), 2020–2033
- Pyrometallurgical smelting
- High-pressure acid leach
- Matte conversion
- Refining and electrowinning
- Europe Nickel Market Outlook, by Source, Value (US$ Billion), 2020–2033
- Primary mined nickel
- Secondary nickel from scrap
- Europe Nickel Market Outlook, by Country, Value (US$ Billion), 2020–2033
- Germany Nickel Market Outlook, by Product Form, 2020–2033
- Germany Nickel Market Outlook, by Application, 2020–2033
- Germany Nickel Market Outlook, by Production Route, 2020–2033
- Germany Nickel Market Outlook, by Source, 2020–2033
- Italy Nickel Market Outlook, by Product Form, 2020–2033
- Italy Nickel Market Outlook, by Application, 2020–2033
- Italy Nickel Market Outlook, by Production Route, 2020–2033
- Italy Nickel Market Outlook, by Source, 2020–2033
- Spain Nickel Market Outlook, by Product Form, 2020–2033
- Spain Nickel Market Outlook, by Application, 2020–2033
- Spain Nickel Market Outlook, by Production Route, 2020–2033
- Spain Nickel Market Outlook, by Source, 2020–2033
- France Nickel Market Outlook, by Product Form, 2020–2033
- France Nickel Market Outlook, by Application, 2020–2033
- France Nickel Market Outlook, by Production Route, 2020–2033
- France Nickel Market Outlook, by Source, 2020–2033
- Finland Nickel Market Outlook, by Product Form, 2020–2033
- Finland Nickel Market Outlook, by Application, 2020–2033
- Finland Nickel Market Outlook, by Production Route, 2020–2033
- Finland Nickel Market Outlook, by Source, 2020–2033
- Norway Nickel Market Outlook, by Product Form, 2020–2033
- Norway Nickel Market Outlook, by Application, 2020–2033
- Norway Nickel Market Outlook, by Production Route, 2020–2033
- Norway Nickel Market Outlook, by Source, 2020–2033
- Europe Nickel Market Outlook, by Product Form, Value (US$ Billion), 2020–2033
- Asia Pacific Nickel Market Outlook, 2020–2033
- Asia Pacific Nickel Market Outlook, by Product Form, Value (US$ Billion), 2020–2033
- Class 1 nickel: briquettes, cathode and powder
- Class 2 nickel: ferronickel and nickel pig iron
- Nickel sulphate
- Intermediates: mixed hydroxide precipitate and matte
- Nickel oxide and other compounds
- Asia Pacific Nickel Market Outlook, by Application, Value (US$ Billion), 2020–2033
- Stainless steel
- Batteries
- Alloys and superalloys
- Electroplating
- Foundry and castings
- Catalysts and other uses
- Asia Pacific Nickel Market Outlook, by Production Route, Value (US$ Billion), 2020–2033
- Pyrometallurgical smelting
- High-pressure acid leach
- Matte conversion
- Refining and electrowinning
- Asia Pacific Nickel Market Outlook, by Source, Value (US$ Billion), 2020–2033
- Primary mined nickel
- Secondary nickel from scrap
- Asia Pacific Nickel Market Outlook, by Country, Value (US$ Billion), 2020–2033
- Indonesia Nickel Market Outlook, by Product Form, 2020–2033
- Indonesia Nickel Market Outlook, by Application, 2020–2033
- Indonesia Nickel Market Outlook, by Production Route, 2020–2033
- Indonesia Nickel Market Outlook, by Source, 2020–2033
- China Nickel Market Outlook, by Product Form, 2020–2033
- China Nickel Market Outlook, by Application, 2020–2033
- China Nickel Market Outlook, by Production Route, 2020–2033
- China Nickel Market Outlook, by Source, 2020–2033
- Japan Nickel Market Outlook, by Product Form, 2020–2033
- Japan Nickel Market Outlook, by Application, 2020–2033
- Japan Nickel Market Outlook, by Production Route, 2020–2033
- Japan Nickel Market Outlook, by Source, 2020–2033
- South Korea Nickel Market Outlook, by Product Form, 2020–2033
- South Korea Nickel Market Outlook, by Application, 2020–2033
- South Korea Nickel Market Outlook, by Production Route, 2020–2033
- South Korea Nickel Market Outlook, by Source, 2020–2033
- Philippines Nickel Market Outlook, by Product Form, 2020–2033
- Philippines Nickel Market Outlook, by Application, 2020–2033
- Philippines Nickel Market Outlook, by Production Route, 2020–2033
- Philippines Nickel Market Outlook, by Source, 2020–2033
- New Caledonia Nickel Market Outlook, by Product Form, 2020–2033
- New Caledonia Nickel Market Outlook, by Application, 2020–2033
- New Caledonia Nickel Market Outlook, by Production Route, 2020–2033
- New Caledonia Nickel Market Outlook, by Source, 2020–2033
- Asia Pacific Nickel Market Outlook, by Product Form, Value (US$ Billion), 2020–2033
- Latin America Nickel Market Outlook, 2020–2033
- Latin America Nickel Market Outlook, by Product Form, Value (US$ Billion), 2020–2033
- Class 1 nickel: briquettes, cathode and powder
- Class 2 nickel: ferronickel and nickel pig iron
- Nickel sulphate
- Intermediates: mixed hydroxide precipitate and matte
- Nickel oxide and other compounds
- Latin America Nickel Market Outlook, by Application, Value (US$ Billion), 2020–2033
- Stainless steel
- Batteries
- Alloys and superalloys
- Electroplating
- Foundry and castings
- Catalysts and other uses
- Latin America Nickel Market Outlook, by Production Route, Value (US$ Billion), 2020–2033
- Pyrometallurgical smelting
- High-pressure acid leach
- Matte conversion
- Refining and electrowinning
- Latin America Nickel Market Outlook, by Source, Value (US$ Billion), 2020–2033
- Primary mined nickel
- Secondary nickel from scrap
- Latin America Nickel Market Outlook, by Country, Value (US$ Billion), 2020–2033
- Brazil Nickel Market Outlook, by Product Form, 2020–2033
- Brazil Nickel Market Outlook, by Application, 2020–2033
- Brazil Nickel Market Outlook, by Production Route, 2020–2033
- Brazil Nickel Market Outlook, by Source, 2020–2033
- Colombia Nickel Market Outlook, by Product Form, 2020–2033
- Colombia Nickel Market Outlook, by Application, 2020–2033
- Colombia Nickel Market Outlook, by Production Route, 2020–2033
- Colombia Nickel Market Outlook, by Source, 2020–2033
- Guatemala Nickel Market Outlook, by Product Form, 2020–2033
- Guatemala Nickel Market Outlook, by Application, 2020–2033
- Guatemala Nickel Market Outlook, by Production Route, 2020–2033
- Guatemala Nickel Market Outlook, by Source, 2020–2033
- Dominican Republic Nickel Market Outlook, by Product Form, 2020–2033
- Dominican Republic Nickel Market Outlook, by Application, 2020–2033
- Dominican Republic Nickel Market Outlook, by Production Route, 2020–2033
- Dominican Republic Nickel Market Outlook, by Source, 2020–2033
- Latin America Nickel Market Outlook, by Product Form, Value (US$ Billion), 2020–2033
- Middle East & Africa Nickel Market Outlook, 2020–2033
- Middle East & Africa Nickel Market Outlook, by Product Form, Value (US$ Billion), 2020–2033
- Class 1 nickel: briquettes, cathode and powder
- Class 2 nickel: ferronickel and nickel pig iron
- Nickel sulphate
- Intermediates: mixed hydroxide precipitate and matte
- Nickel oxide and other compounds
- Middle East & Africa Nickel Market Outlook, by Application, Value (US$ Billion), 2020–2033
- Stainless steel
- Batteries
- Alloys and superalloys
- Electroplating
- Foundry and castings
- Catalysts and other uses
- Middle East & Africa Nickel Market Outlook, by Production Route, Value (US$ Billion), 2020–2033
- Pyrometallurgical smelting
- High-pressure acid leach
- Matte conversion
- Refining and electrowinning
- Middle East & Africa Nickel Market Outlook, by Source, Value (US$ Billion), 2020–2033
- Primary mined nickel
- Secondary nickel from scrap
- Middle East & Africa Nickel Market Outlook, by Country, Value (US$ Billion), 2020–2033
- South Africa Nickel Market Outlook, by Product Form, 2020–2033
- South Africa Nickel Market Outlook, by Application, 2020–2033
- South Africa Nickel Market Outlook, by Production Route, 2020–2033
- South Africa Nickel Market Outlook, by Source, 2020–2033
- Zimbabwe Nickel Market Outlook, by Product Form, 2020–2033
- Zimbabwe Nickel Market Outlook, by Application, 2020–2033
- Zimbabwe Nickel Market Outlook, by Production Route, 2020–2033
- Zimbabwe Nickel Market Outlook, by Source, 2020–2033
- Madagascar Nickel Market Outlook, by Product Form, 2020–2033
- Madagascar Nickel Market Outlook, by Application, 2020–2033
- Madagascar Nickel Market Outlook, by Production Route, 2020–2033
- Madagascar Nickel Market Outlook, by Source, 2020–2033
- Tanzania Nickel Market Outlook, by Product Form, 2020–2033
- Tanzania Nickel Market Outlook, by Application, 2020–2033
- Tanzania Nickel Market Outlook, by Production Route, 2020–2033
- Tanzania Nickel Market Outlook, by Source, 2020–2033
- Burundi Nickel Market Outlook, by Product Form, 2020–2033
- Burundi Nickel Market Outlook, by Application, 2020–2033
- Burundi Nickel Market Outlook, by Production Route, 2020–2033
- Burundi Nickel Market Outlook, by Source, 2020–2033
- Middle East & Africa Nickel Market Outlook, by Product Form, Value (US$ Billion), 2020–2033
- Competitive Landscape
- Market Concentration and Industry Leaders
- Competitive Differentiation
- Strategic Moves and Market Direction
- Recent Industry Developments
- Company Profiles
- Vale S.A.
- Glencore plc
- BHP Group Limited
- Nornickel
- Jinchuan Group
- Tsingshan Holding Group
- Eramet S.A.
- Sumitomo Metal Mining Co., Ltd.
- Anglo American plc
- South32 Limited
- Sherritt International Corporation
- IGO Limited
- Lygend Resources & Technology
- Zhejiang Huayou Cobalt Co., Ltd.
- PT Aneka Tambang Tbk
- Terrafame Ltd.
- Nickel Asia Corporation
- Korea Zinc Co., Ltd.
- Appendix
- Research Methodology
- Report Assumptions
- Acronyms and Abbreviations
Product Form
- Class 1 nickel: briquettes, cathode and powder
- Class 2 nickel: ferronickel and nickel pig iron
- Nickel sulphate
- Intermediates: mixed hydroxide precipitate and matte
- Nickel oxide and other compounds
Application
- Stainless steel
- Batteries
- Alloys and superalloys
- Electroplating
- Foundry and castings
- Catalysts and other uses
Production Route
- Pyrometallurgical smelting
- High-pressure acid leach
- Matte conversion
- Refining and electrowinning
Source
- Primary mined nickel
- Secondary nickel from scrap
Regions
- North America
- Europe
- Asia Pacific
- Latin America
- Middle East & Africa
Our Research Methodology
Considering the volatility of business today, traditional approaches to strategizing a game plan can be unfruitful if not detrimental. True ambiguity is no way to determine a forecast. A myriad of predetermined factors must be accounted for such as the degree of risk involved, the magnitude of circumstances, as well as conditions or consequences that are not known or unpredictable. To circumvent binary views that cast uncertainty, the application of market research intelligence to strategically posture, move, and enable actionable outcomes is necessary.
View Methodology
Quality Assured
Rigorous Validation Process

Confidentiality Assured
End-to-end Data Security

Custom Research Services
Tailored To Your Objectives
FAQs
The nickel market is valued at US$ 48.5 billion in 2026, measured as refined nickel and nickel units sold at prevailing market prices.
The market is projected to reach US$ 76.0 billion by 2033, growing at a 6.6% CAGR and adding US$ 27.5 billion in value.
Stainless steel consumes the most nickel, at 63% of demand in 2026, because austenitic grades have no economic substitute in corrosive service.
High-pressure acid leach capacity grows fastest at an 11.2% CAGR, while Indonesia leads countries with an 8.8% CAGR through 2033.
Asia Pacific dominates with 68% share in 2026, and concentration is medium, with Indonesian industrial park capacity reshaping the supplier base.
Related Reports
Polymer Emulsion Market Size, Share, Insights, Competitive Landscape, and Forecast 2026 to 2033
Polymer emulsion market to grow from US$44.8 Bn in 2026 to US$66.5 Bn by 2033 at 5.8% CAGR. Explore products, applications, end-use industries and regions.
On The Go Packaging Market Size, Share, Insights, Competitive Landscape, and Forecast 2026 to 2033
On the go packaging market to grow from US$2.19 Bn in 2026 to US$3.00 Bn by 2033 at 4.6% CAGR. Explore materials, products, applications and regions.
Nylon 6 Market Size, Share, Insights, Competitive Landscape, and Forecast 2026 to 2033
Nylon 6 market to reach US$ 26.95 billion by 2033 at a 5.6% CAGR. Explore product forms, applications, feedstocks, leading companies and regional trends.
Vitamin A-Acetate Market Size, Share, Insights, Competitive Landscape, and Forecast 2026 to 2033
Vitamin A-acetate market to reach US$ 2.68 billion by 2033 at a 5.9% CAGR. Explore forms, grades, applications, leading companies and regional trends.
Spinosad Active Ingredient Market Size, Share, Insights, Competitive Landscape, and Forecast 2026 to 2033
Spinosad active ingredient market to reach US$ 1.257 billion by 2033 at an 8.6% CAGR. Explore forms, crops, applications, companies and regional trends.
D-Psicose (Allulose) Market Size, Share, Insights, Competitive Landscape, and Forecast 2026 to 2033
D-psicose (allulose) market to reach US$ 0.749 billion by 2033 at a 15.7% CAGR. Explore forms, applications, sales channels and regional trends.