



Observability Tools and Platforms Market
Observability Tools and Platforms Market Size, Share, Insights, Competitive Landscape, and Forecast 2026 to 2033
Observability Tools and Platforms Market Analysis, 2026–2033
Observability Tools and Platforms Market
Observability Tools and Platforms Market Size, Share, Insights, Competitive Landscape, and Forecast 2026 to 2033
Observability Tools and Platforms Market Size and Trend Analysis
How Fast Is the Observability Tools and Platforms Market Growing?
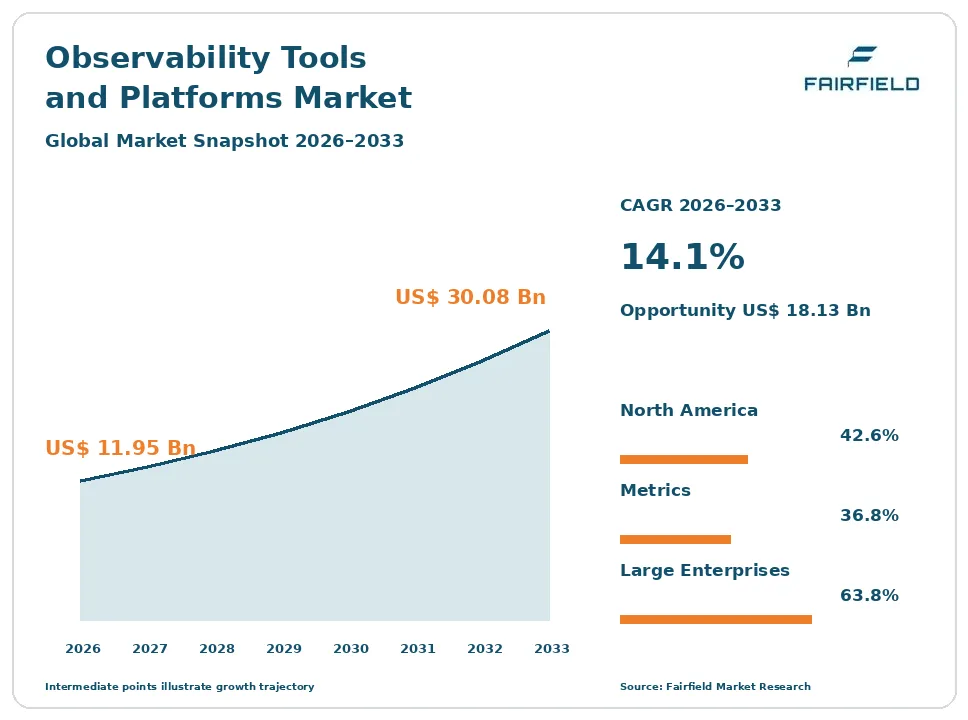
The global observability tools and platforms market size is expected to be valued at US$ 11.95 billion in 2026 and projected to reach US$ 30.08 billion by 2033, growing at a CAGR of 14.1% between 2026 and 2033.
Between 2020 and 2025, the market grew at a CAGR of about 15.5%, as cloud migration and remote work during the pandemic pushed companies to monitor complex digital services, followed by cost-cutting in 2023 that slowed some spending. Three factors now drive growth: the move to cloud-native systems built on microservices and Kubernetes, the rise of generative AI applications that need AI observability, and pressure to prevent costly outages. The market is shifting from separate tools for application performance monitoring, infrastructure monitoring, and log management toward unified platforms that combine metrics, logs, traces, and user data. OpenTelemetry is becoming the standard for collecting telemetry, and AIOps features use machine learning to find root causes automatically.
Key Report Takeaways
- By Telemetry Type: Metrics held 36.8% share in 2026, while Traces are projected to expand at a 17.2% CAGR through 2033, driven by microservices, Kubernetes, and serverless architectures that need request-level visibility.
- By Organization Size: Large Enterprises held 63.8% share in 2026, while Small & Medium Enterprises are projected to expand at a 16.4% CAGR through 2033, driven by affordable software-as-a-service and open-source options.
- By End Use: IT & Telecom held 27.4% share in 2026, while Healthcare is projected to expand at a 16.1% CAGR through 2033, driven by digital health services, cloud electronic records, and uptime rules.
- By Region: North America held 42.6% share in 2026, while Asia Pacific is projected to expand at a 17.3% CAGR through 2033, driven by cloud adoption in India, China, and Japan.
Global Observability Tools and Platforms Market Trends and Insights
Drivers Impact Analysis
Two drivers carry the strongest influence on observability tools and platforms demand during the forecast period.
| Driver | Impact on CAGR Forecast | Geographic Relevance | Impact Timeline |
| Cloud-native and microservices adoption | High | Global | Long term (≥4 years) |
| Generative AI and agent monitoring needs | High | North America, Europe, Asia Pacific | Medium term (2-4 years) |
Cloud-Native Complexity Is Driving the Observability Tools and Platforms Market
Cloud-native and microservices adoption is the strongest driver of the observability tools and platforms market. Modern software is spread across many services, containers, and clouds.
The mechanism is growing system complexity that older monitoring tools cannot handle. A single customer request may pass through dozens of microservices, databases, queues, and third-party APIs. Kubernetes clusters create and destroy containers constantly, making static monitoring ineffective. Companies run workloads across Amazon Web Services, Microsoft Azure, Google Cloud, and private data centers. When something breaks, engineers need correlated metrics, logs, and traces to find the cause quickly. Downtime for large online services can cost hundreds of thousands of dollars per hour. Site reliability engineering and DevOps practices make observability a core part of software delivery. These factors drive steady platform spending.
AI Applications Are Expanding the Observability Tools and Platforms Market
Generative AI applications and AI agents are expanding the observability tools and platforms market. Companies need to monitor model quality, cost, and behavior.
The cause is the rapid deployment of large language models and autonomous agents in business processes. AI applications can fail in new ways, including hallucinations, slow responses, high token costs, prompt injection, and data leaks. AI observability tools trace prompts, responses, model calls, and agent actions to help teams evaluate and improve performance. GPU clusters for training and inference need detailed infrastructure monitoring. Dynatrace agreed to acquire Arize for US$ 915 million in 2026, and Datadog acquired Adaptive ML in 2026. AIOps features also use AI to cut alert noise and speed incident response. These trends open new product lines and raise spending per customer.
Restraints Impact Analysis
Two restraints limit how quickly the observability tools and platforms market grows.
| Restraint | Impact on CAGR Forecast | Geographic Relevance | Impact Timeline |
| Rising data volumes and unpredictable costs | High | Global | Short term (≤2 years) |
| Skills gaps and tool sprawl | Medium | Global | Medium term (2-4 years) |
Rising Data Costs Slow the Observability Tools and Platforms Market
Rising data volumes and unpredictable costs slow the observability tools and platforms market. Many companies are surprised by large monitoring bills.
The specific causes are telemetry growth and usage-based pricing. Cloud-native systems generate huge amounts of logs, metrics, and traces, often growing faster than application traffic. Vendors charge by data ingested, hosts monitored, or users, so costs can rise sharply. Some organizations spend a large share of their cloud budgets on observability. Finance teams push engineers to cut data, sample traces, and shorten retention, which reduces visibility. Customers increasingly move to cheaper open-source stacks or negotiate hard on renewals. Cost-cutting in 2023 led many companies to consolidate tools. Some vendors now offer tiered storage and data pipelines to help customers manage spending. These pressures slow revenue growth per customer and force vendors to offer cost controls.
Skills Gaps and Tool Sprawl Restrict the Observability Tools and Platforms Market
Skills gaps and tool sprawl restrict the observability tools and platforms market. Many teams struggle to use observability data effectively.
The underlying causes are complex tools and a shortage of skilled engineers. Large enterprises often run more than 10 monitoring tools across different teams, creating data silos and duplicated costs. Setting up instrumentation, dashboards, and alerts requires expertise in distributed systems. Site reliability engineers are in high demand and expensive to hire. Smaller companies may lack staff to manage full platforms. Migrating from legacy tools takes time and carries risk. Data privacy rules limit sending logs with personal data to cloud services in some countries. Alert fatigue from too many notifications also leads teams to ignore warnings and miss real incidents. Training programs and managed services help, but add cost. These factors slow adoption and expansion of advanced platforms.
Market Opportunities
AI Observability Opens a New Revenue Pool
AI observability for models, agents, and GPU infrastructure opens a new revenue pool in the observability tools and platforms market. Enterprises need trust and control as they deploy AI.
Vendors that monitor AI systems end to end can capture this opportunity. Tools that trace prompts, evaluate outputs, track token costs, and detect drift help teams move AI from pilots to production. Governance rules such as the European Union AI Act require monitoring and documentation for high-risk AI systems. Dynatrace, Datadog, New Relic, and Cisco are adding large language model monitoring and agent tracing. Specialist start-ups are attractive acquisition targets. GPU and data center monitoring adds infrastructure revenue. Bundling AI features into existing platforms raises contract values, and AI agents that investigate incidents automatically can be sold as premium add-ons with clear time savings for engineering teams.
Security and Data Platform Convergence Creates a Platform Revenue Pool
The convergence of observability with security and data platforms creates a platform revenue pool in the observability tools and platforms market. The same telemetry supports reliability, security, and analytics.
Large platform vendors can capture this opportunity. Palo Alto Networks completed its acquisition of Chronosphere in 2026 to combine observability and security operations. Cisco combines Splunk security and observability with its networking data. Snowflake agreed to acquire Observe in 2026 to run observability on its data cloud. Unified data lakes reduce duplicate storage and costs. OpenTelemetry makes it easier to send data to multiple tools. Combined platforms can win larger, multi-year enterprise contracts, especially with chief information officers seeking fewer vendors. Telemetry pipeline tools that filter and route data, such as Bindplane, help control costs and feed several destinations at once. Security teams also benefit from shared visibility into application behavior.
Segment Analysis
By Telemetry Type: Metrics Lead While Traces Grow Fastest
Metrics held 36.8% share in 2026. Metrics are numeric measurements such as CPU use, memory, request rates, error rates, and latency. They feed dashboards, alerts, and capacity planning, making them the foundation of infrastructure and application performance monitoring. Prometheus and Grafana Labs tools are widely used for metrics, along with commercial platforms. Logs remain essential for debugging, with log management a large spending area for Splunk, Elastic, and Datadog.
Traces are the fastest-growing telemetry type, expanding at a 17.2% CAGR through 2033. Distributed tracing follows each request across services, showing where delays and errors occur. OpenTelemetry has standardized trace collection across languages and vendors. Tracing is also central to AI agent monitoring. Tail-based sampling helps control trace data volume and costs. For the market, trace growth supports deeper root-cause analysis.
By Organization Size: Large Enterprises Lead While SMEs Grow Fastest
Large Enterprises held 63.8% share in 2026. Banks, telecom operators, retailers, technology companies, and governments run complex hybrid environments with thousands of services and strict uptime requirements. They buy full-stack platforms with AIOps, security integration, and enterprise support. Multi-year contracts with Dynatrace, Datadog, Splunk, and New Relic are common.
Small & Medium Enterprises are the fastest-growing organization size, expanding at a 16.4% CAGR through 2033. Software-as-a-service observability with free tiers and usage pricing lets smaller firms start quickly. Open-source tools such as Prometheus, Grafana, and OpenTelemetry lower costs. Digital-native start-ups adopt observability early. Cloud marketplaces make purchasing simple, and bundled pricing for small teams improves affordability. For the market, SME growth broadens the customer base.
By End Use: IT & Telecom Lead While Healthcare Grows Fastest
IT & Telecom held 27.4% share in 2026. Software companies, cloud providers, and telecom operators run large, complex digital services where outages directly affect revenue and customers. 5G networks and edge computing add new monitoring needs. Banking and financial services, retail and e-commerce, and media form other large end uses with strict performance needs.
Healthcare is the fastest-growing end use, expanding at a 16.1% CAGR through 2033. Hospitals and health systems are moving electronic health records, telehealth, and patient apps to the cloud. Downtime can disrupt patient care, so reliability is critical. Data privacy rules require careful log handling. Pharmaceutical firms and insurers also monitor digital platforms closely. For the market, healthcare growth adds regulated, high-value customers.
Geography Analysis
Which Region Is Leading the Observability Tools and Platforms Market?
North America is leading the observability tools and platforms market with a 42.6% share in 2026. The United States is home to most major vendors, including Datadog, New Relic, Splunk, Grafana Labs, Honeycomb, and Chronosphere, and to the largest cloud providers. Enterprises in finance, technology, retail, and healthcare have mature DevOps and site reliability practices. Generative AI adoption is highest in the region. Canada adds demand from banks, telecom firms, and governments. Acquisitions by Palo Alto Networks and Snowflake show strong investment in the category. One change shaping the region is AI observability.
Europe Advances the Observability Tools and Platforms Market Through Regulation
Europe is a major observability tools and platforms market. The United Kingdom, Germany, France, the Netherlands, and Sweden have large banking, telecom, retail, and manufacturing sectors adopting cloud-native systems. The European Union Digital Operational Resilience Act requires financial firms to monitor and test their digital systems, boosting demand. Dynatrace has major operations in Austria. Data sovereignty rules favor regional hosting and open-source tools. Large telecom operators in Germany and France are modernizing networks with cloud-native systems. Key barriers include privacy rules and slower cloud adoption in some sectors. One opportunity is compliance-driven monitoring for banks.
Which Region Is Growing Fastest in the Observability Tools and Platforms Market?
Asia Pacific is growing fastest in the observability tools and platforms market at a 17.3% CAGR through 2033. India has a large software services industry and fast-growing digital payments, e-commerce, and start-ups that need observability. China has large cloud providers such as Alibaba Cloud and Tencent Cloud with their own monitoring tools. Japan, Australia, Singapore, and South Korea are expanding cloud and AI investments. Global vendors are opening regional data centers to meet data residency rules, and local partners resell platforms. One opportunity is affordable software-as-a-service for digital-native companies.
Latin America Grows the Observability Tools and Platforms Market Through Digital Services
Latin America is a growing observability tools and platforms market. Brazil has large digital banks such as Nubank, fintech firms, and e-commerce platforms such as Mercado Libre that run cloud-native systems. Mexico, Colombia, Chile, and Argentina are rapidly expanding digital banking, delivery apps, and online retail. Cloud providers are opening data centers in Brazil, Mexico, and Chile, and instant payment systems such as Pix demand constant uptime. Key barriers include budget limits, skills shortages, and currency swings. One opportunity is affordable software-as-a-service for fintech and e-commerce firms.
Middle East & Africa Builds the Observability Tools and Platforms Market
Middle East & Africa is an emerging observability tools and platforms market. Saudi Arabia and the United Arab Emirates are investing heavily in cloud, AI, and digital government services, with new local data centers from global cloud providers. Israel has a strong technology sector and several observability start-ups. South Africa, Kenya, and Nigeria have growing fintech, mobile money, and telecom sectors that need reliable digital services. Banks in the region are modernizing core systems. Key barriers include skills shortages and budget limits. Regional cloud regions reduce latency and data concerns. One opportunity is government digital transformation programs.
Competitive Landscape
The observability tools and platforms market is moderately concentrated. Datadog, Dynatrace, Cisco through Splunk and AppDynamics, New Relic, and Elastic lead commercial platforms, while Grafana Labs, Honeycomb, Chronosphere (now part of Palo Alto Networks), and Observe (being acquired by Snowflake) compete strongly. Cloud providers including Amazon Web Services, Microsoft, and Google Cloud offer native monitoring, and IBM, ServiceNow, and SolarWinds add enterprise options.
Companies compete on breadth of telemetry, ease of use, AI features, scalability, cost control, and integrations. Usage-based pricing and data costs are major buying factors, and many buyers now run vendor bake-offs at renewal time. Support for OpenTelemetry has reduced vendor lock-in, pushing vendors to compete on analytics and AI. Open-source projects such as Prometheus and Grafana give buyers low-cost alternatives, while large platforms win through breadth and single contracts. Partnerships with cloud marketplaces are important sales channels.
Strategic moves show how competition is changing. In January 2026, Snowflake announced its intent to acquire Observe, and Palo Alto Networks completed its acquisition of Chronosphere. In June 2026, Datadog acquired Adaptive ML to build specialized AI agents. In August 2026, Dynatrace agreed to acquire Arize for US$ 915 million. These moves show competition shifting toward AI observability and convergence with security and data platforms.
Three themes shape vendor strategy. First, vendors are building AI agents for incident response. Second, they are adding AI model and agent monitoring. Third, they are offering cost controls and data pipelines.
Observability Tools and Platforms Market Industry Leaders
Datadog Dynatrace Cisco (Splunk) New Relic Grafana Labs
Recent Industry Developments
- August 2026: Dynatrace announced it will acquire Arize for US$ 915 million - adds AI observability and large language model evaluation.
- June 2026: Datadog acquired Adaptive ML, a reinforcement learning start-up - strengthens AI research and specialized agents for observability and incident response.
- January 2026: Palo Alto Networks completed its acquisition of Chronosphere - combines cloud-native observability with security operations.
- January 2026: Snowflake announced its intent to acquire Observe, valued at about US$ 1 billion - brings AI-powered observability onto a data cloud platform.
Companies Covered in the Report
- Datadog
- Dynatrace
- Cisco (Splunk)
- New Relic
- Grafana Labs
- Elastic
- Palo Alto Networks (Chronosphere)
- Snowflake (Observe)
- Honeycomb
- IBM
- ServiceNow
- SolarWinds
Observability Tools and Platforms Market Report Scope
This report covers observability tools and platforms, including application performance monitoring, infrastructure monitoring, log management, distributed tracing, digital experience monitoring, and AI observability, delivered as software-as-a-service, on-premises, or hybrid, for large enterprises and SMEs across IT and telecom, banking, retail, healthcare, government, and other end uses. It excludes standalone security analytics. The base year is 2025, and the forecast period runs from 2026 to 2033. All values are expressed in US$ Billion.
Telemetry Type
- Metrics
- Logs
- Traces
- Events & Others
Organization Size
- Large Enterprises
- Small & Medium Enterprises
End Use
- IT & Telecom
- Banking & Financial Services
- Retail & E-commerce
- Healthcare
- Government
- Others
Regions
- North America
- Europe
- Asia Pacific
- Latin America
- Middle East & Africa
Key Questions Answered in the Report
How big is the observability tools and platforms market in 2026?
The observability tools and platforms market is valued at US$ 11.95 billion in 2026, led by large enterprises in North America.
What is the observability tools and platforms market forecast to 2033?
The market is projected to reach US$ 30.08 billion by 2033, growing at a 14.1% CAGR and adding US$ 18.13 billion.
Which telemetry type is growing fastest in observability tools and platforms?
Traces are growing fastest at a 17.2% CAGR through 2033, driven by microservices, Kubernetes, and rising AI agent monitoring needs.
Which region is growing fastest in the observability tools and platforms market?
Asia Pacific is growing fastest at a 17.3% CAGR through 2033, driven by cloud adoption in India, China, and Japan.
Which region holds the largest observability tools and platforms market share?
North America holds the largest share at 42.6% in 2026, supported by leading vendors, cloud providers, and mature DevOps practices.
1. Executive Summary
1.1. Global Observability Tools and Platforms Market Snapshot
1.2. Future Projections
1.3. Key Report Takeaways
1.4. Regional Snapshot
2. Market Overview
2.1. Market Definition and Report Scope
2.2. Historical Trends 2020–2025
2.3. Market Dynamics
2.3.1. Drivers
2.3.1.1. Cloud-Native Complexity Is Driving the Observability Tools and Platforms Market
2.3.1.2. AI Applications Are Expanding the Observability Tools and Platforms Market
2.3.2. Restraints
2.3.2.1. Rising Data Costs Slow the Observability Tools and Platforms Market
2.3.2.2. Skills Gaps and Tool Sprawl Restrict the Observability Tools and Platforms Market
2.3.3. Market Opportunities
2.3.3.1. AI Observability Opens a New Revenue Pool
2.3.3.2. Security and Data Platform Convergence Creates a Platform Revenue Pool
3. Global Observability Tools and Platforms Market Outlook, 2020-2033
3.1. Global Observability Tools and Platforms Market Outlook, by Telemetry Type, Value (US$ Billion), 2020-2033
3.1.1. Metrics
3.1.2. Logs
3.1.3. Traces
3.1.4. Events & Others
3.2. Global Observability Tools and Platforms Market Outlook, by Organization Size, Value (US$ Billion), 2020-2033
3.2.1. Large Enterprises
3.2.2. Small & Medium Enterprises
3.3. Global Observability Tools and Platforms Market Outlook, by End Use, Value (US$ Billion), 2020-2033
3.3.1. IT & Telecom
3.3.2. Banking & Financial Services
3.3.3. Retail & E-commerce
3.3.4. Healthcare
3.3.5. Government
3.3.6. Others
3.4. Global Observability Tools and Platforms Market Outlook, by Region, Value (US$ Billion), 2020-2033
3.4.1. North America
3.4.2. Europe
3.4.3. Asia Pacific
3.4.4. Latin America
3.4.5. Middle East & Africa
4. North America Observability Tools and Platforms Market Outlook, 2020-2033
4.1. North America Observability Tools and Platforms Market Outlook, by Telemetry Type, Value (US$ Billion), 2020-2033
4.1.1. Metrics
4.1.2. Logs
4.1.3. Traces
4.1.4. Events & Others
4.2. North America Observability Tools and Platforms Market Outlook, by Organization Size, Value (US$ Billion), 2020-2033
4.2.1. Large Enterprises
4.2.2. Small & Medium Enterprises
4.3. North America Observability Tools and Platforms Market Outlook, by End Use, Value (US$ Billion), 2020-2033
4.3.1. IT & Telecom
4.3.2. Banking & Financial Services
4.3.3. Retail & E-commerce
4.3.4. Healthcare
4.3.5. Government
4.3.6. Others
4.4. North America Observability Tools and Platforms Market Outlook, by Country, Value (US$ Billion), 2020-2033
4.4.1. United States Observability Tools and Platforms Market Outlook, by Telemetry Type, 2020-2033
4.4.2. United States Observability Tools and Platforms Market Outlook, by Organization Size, 2020-2033
4.4.3. United States Observability Tools and Platforms Market Outlook, by End Use, 2020-2033
4.4.4. Canada Observability Tools and Platforms Market Outlook, by Telemetry Type, 2020-2033
4.4.5. Canada Observability Tools and Platforms Market Outlook, by Organization Size, 2020-2033
4.4.6. Canada Observability Tools and Platforms Market Outlook, by End Use, 2020-2033
5. Europe Observability Tools and Platforms Market Outlook, 2020-2033
5.1. Europe Observability Tools and Platforms Market Outlook, by Telemetry Type, Value (US$ Billion), 2020-2033
5.1.1. Metrics
5.1.2. Logs
5.1.3. Traces
5.1.4. Events & Others
5.2. Europe Observability Tools and Platforms Market Outlook, by Organization Size, Value (US$ Billion), 2020-2033
5.2.1. Large Enterprises
5.2.2. Small & Medium Enterprises
5.3. Europe Observability Tools and Platforms Market Outlook, by End Use, Value (US$ Billion), 2020-2033
5.3.1. IT & Telecom
5.3.2. Banking & Financial Services
5.3.3. Retail & E-commerce
5.3.4. Healthcare
5.3.5. Government
5.3.6. Others
5.4. Europe Observability Tools and Platforms Market Outlook, by Country, Value (US$ Billion), 2020-2033
5.4.1. United Kingdom Observability Tools and Platforms Market Outlook, by Telemetry Type, 2020-2033
5.4.2. United Kingdom Observability Tools and Platforms Market Outlook, by Organization Size, 2020-2033
5.4.3. United Kingdom Observability Tools and Platforms Market Outlook, by End Use, 2020-2033
5.4.4. Germany Observability Tools and Platforms Market Outlook, by Telemetry Type, 2020-2033
5.4.5. Germany Observability Tools and Platforms Market Outlook, by Organization Size, 2020-2033
5.4.6. Germany Observability Tools and Platforms Market Outlook, by End Use, 2020-2033
5.4.7. France Observability Tools and Platforms Market Outlook, by Telemetry Type, 2020-2033
5.4.8. France Observability Tools and Platforms Market Outlook, by Organization Size, 2020-2033
5.4.9. France Observability Tools and Platforms Market Outlook, by End Use, 2020-2033
5.4.10. Netherlands Observability Tools and Platforms Market Outlook, by Telemetry Type, 2020-2033
5.4.11. Netherlands Observability Tools and Platforms Market Outlook, by Organization Size, 2020-2033
5.4.12. Netherlands Observability Tools and Platforms Market Outlook, by End Use, 2020-2033
5.4.13. Sweden Observability Tools and Platforms Market Outlook, by Telemetry Type, 2020-2033
5.4.14. Sweden Observability Tools and Platforms Market Outlook, by Organization Size, 2020-2033
5.4.15. Sweden Observability Tools and Platforms Market Outlook, by End Use, 2020-2033
5.4.16. Austria Observability Tools and Platforms Market Outlook, by Telemetry Type, 2020-2033
5.4.17. Austria Observability Tools and Platforms Market Outlook, by Organization Size, 2020-2033
5.4.18. Austria Observability Tools and Platforms Market Outlook, by End Use, 2020-2033
6. Asia Pacific Observability Tools and Platforms Market Outlook, 2020-2033
6.1. Asia Pacific Observability Tools and Platforms Market Outlook, by Telemetry Type, Value (US$ Billion), 2020-2033
6.1.1. Metrics
6.1.2. Logs
6.1.3. Traces
6.1.4. Events & Others
6.2. Asia Pacific Observability Tools and Platforms Market Outlook, by Organization Size, Value (US$ Billion), 2020-2033
6.2.1. Large Enterprises
6.2.2. Small & Medium Enterprises
6.3. Asia Pacific Observability Tools and Platforms Market Outlook, by End Use, Value (US$ Billion), 2020-2033
6.3.1. IT & Telecom
6.3.2. Banking & Financial Services
6.3.3. Retail & E-commerce
6.3.4. Healthcare
6.3.5. Government
6.3.6. Others
6.4. Asia Pacific Observability Tools and Platforms Market Outlook, by Country, Value (US$ Billion), 2020-2033
6.4.1. India Observability Tools and Platforms Market Outlook, by Telemetry Type, 2020-2033
6.4.2. India Observability Tools and Platforms Market Outlook, by Organization Size, 2020-2033
6.4.3. India Observability Tools and Platforms Market Outlook, by End Use, 2020-2033
6.4.4. China Observability Tools and Platforms Market Outlook, by Telemetry Type, 2020-2033
6.4.5. China Observability Tools and Platforms Market Outlook, by Organization Size, 2020-2033
6.4.6. China Observability Tools and Platforms Market Outlook, by End Use, 2020-2033
6.4.7. Japan Observability Tools and Platforms Market Outlook, by Telemetry Type, 2020-2033
6.4.8. Japan Observability Tools and Platforms Market Outlook, by Organization Size, 2020-2033
6.4.9. Japan Observability Tools and Platforms Market Outlook, by End Use, 2020-2033
6.4.10. Australia Observability Tools and Platforms Market Outlook, by Telemetry Type, 2020-2033
6.4.11. Australia Observability Tools and Platforms Market Outlook, by Organization Size, 2020-2033
6.4.12. Australia Observability Tools and Platforms Market Outlook, by End Use, 2020-2033
6.4.13. Singapore Observability Tools and Platforms Market Outlook, by Telemetry Type, 2020-2033
6.4.14. Singapore Observability Tools and Platforms Market Outlook, by Organization Size, 2020-2033
6.4.15. Singapore Observability Tools and Platforms Market Outlook, by End Use, 2020-2033
6.4.16. South Korea Observability Tools and Platforms Market Outlook, by Telemetry Type, 2020-2033
6.4.17. South Korea Observability Tools and Platforms Market Outlook, by Organization Size, 2020-2033
6.4.18. South Korea Observability Tools and Platforms Market Outlook, by End Use, 2020-2033
7. Latin America Observability Tools and Platforms Market Outlook, 2020-2033
7.1. Latin America Observability Tools and Platforms Market Outlook, by Telemetry Type, Value (US$ Billion), 2020-2033
7.1.1. Metrics
7.1.2. Logs
7.1.3. Traces
7.1.4. Events & Others
7.2. Latin America Observability Tools and Platforms Market Outlook, by Organization Size, Value (US$ Billion), 2020-2033
7.2.1. Large Enterprises
7.2.2. Small & Medium Enterprises
7.3. Latin America Observability Tools and Platforms Market Outlook, by End Use, Value (US$ Billion), 2020-2033
7.3.1. IT & Telecom
7.3.2. Banking & Financial Services
7.3.3. Retail & E-commerce
7.3.4. Healthcare
7.3.5. Government
7.3.6. Others
7.4. Latin America Observability Tools and Platforms Market Outlook, by Country, Value (US$ Billion), 2020-2033
7.4.1. Brazil Observability Tools and Platforms Market Outlook, by Telemetry Type, 2020-2033
7.4.2. Brazil Observability Tools and Platforms Market Outlook, by Organization Size, 2020-2033
7.4.3. Brazil Observability Tools and Platforms Market Outlook, by End Use, 2020-2033
7.4.4. Mexico Observability Tools and Platforms Market Outlook, by Telemetry Type, 2020-2033
7.4.5. Mexico Observability Tools and Platforms Market Outlook, by Organization Size, 2020-2033
7.4.6. Mexico Observability Tools and Platforms Market Outlook, by End Use, 2020-2033
7.4.7. Colombia Observability Tools and Platforms Market Outlook, by Telemetry Type, 2020-2033
7.4.8. Colombia Observability Tools and Platforms Market Outlook, by Organization Size, 2020-2033
7.4.9. Colombia Observability Tools and Platforms Market Outlook, by End Use, 2020-2033
7.4.10. Chile Observability Tools and Platforms Market Outlook, by Telemetry Type, 2020-2033
7.4.11. Chile Observability Tools and Platforms Market Outlook, by Organization Size, 2020-2033
7.4.12. Chile Observability Tools and Platforms Market Outlook, by End Use, 2020-2033
7.4.13. Argentina Observability Tools and Platforms Market Outlook, by Telemetry Type, 2020-2033
7.4.14. Argentina Observability Tools and Platforms Market Outlook, by Organization Size, 2020-2033
7.4.15. Argentina Observability Tools and Platforms Market Outlook, by End Use, 2020-2033
8. Middle East & Africa Observability Tools and Platforms Market Outlook, 2020-2033
8.1. Middle East & Africa Observability Tools and Platforms Market Outlook, by Telemetry Type, Value (US$ Billion), 2020-2033
8.1.1. Metrics
8.1.2. Logs
8.1.3. Traces
8.1.4. Events & Others
8.2. Middle East & Africa Observability Tools and Platforms Market Outlook, by Organization Size, Value (US$ Billion), 2020-2033
8.2.1. Large Enterprises
8.2.2. Small & Medium Enterprises
8.3. Middle East & Africa Observability Tools and Platforms Market Outlook, by End Use, Value (US$ Billion), 2020-2033
8.3.1. IT & Telecom
8.3.2. Banking & Financial Services
8.3.3. Retail & E-commerce
8.3.4. Healthcare
8.3.5. Government
8.3.6. Others
8.4. Middle East & Africa Observability Tools and Platforms Market Outlook, by Country, Value (US$ Billion), 2020-2033
8.4.1. Saudi Arabia Observability Tools and Platforms Market Outlook, by Telemetry Type, 2020-2033
8.4.2. Saudi Arabia Observability Tools and Platforms Market Outlook, by Organization Size, 2020-2033
8.4.3. Saudi Arabia Observability Tools and Platforms Market Outlook, by End Use, 2020-2033
8.4.4. United Arab Emirates Observability Tools and Platforms Market Outlook, by Telemetry Type, 2020-2033
8.4.5. United Arab Emirates Observability Tools and Platforms Market Outlook, by Organization Size, 2020-2033
8.4.6. United Arab Emirates Observability Tools and Platforms Market Outlook, by End Use, 2020-2033
8.4.7. Israel Observability Tools and Platforms Market Outlook, by Telemetry Type, 2020-2033
8.4.8. Israel Observability Tools and Platforms Market Outlook, by Organization Size, 2020-2033
8.4.9. Israel Observability Tools and Platforms Market Outlook, by End Use, 2020-2033
8.4.10. South Africa Observability Tools and Platforms Market Outlook, by Telemetry Type, 2020-2033
8.4.11. South Africa Observability Tools and Platforms Market Outlook, by Organization Size, 2020-2033
8.4.12. South Africa Observability Tools and Platforms Market Outlook, by End Use, 2020-2033
8.4.13. Kenya Observability Tools and Platforms Market Outlook, by Telemetry Type, 2020-2033
8.4.14. Kenya Observability Tools and Platforms Market Outlook, by Organization Size, 2020-2033
8.4.15. Kenya Observability Tools and Platforms Market Outlook, by End Use, 2020-2033
8.4.16. Nigeria Observability Tools and Platforms Market Outlook, by Telemetry Type, 2020-2033
8.4.17. Nigeria Observability Tools and Platforms Market Outlook, by Organization Size, 2020-2033
8.4.18. Nigeria Observability Tools and Platforms Market Outlook, by End Use, 2020-2033
9. Competitive Landscape
9.1. Market Concentration and Industry Leaders
9.2. Competitive Differentiation
9.3. Strategic Moves and Market Direction
9.4. Recent Industry Developments
9.5. Company Profiles
9.5.1. Datadog
9.5.2. Dynatrace
9.5.3. Cisco (Splunk)
9.5.4. New Relic
9.5.5. Grafana Labs
9.5.6. Elastic
9.5.7. Palo Alto Networks (Chronosphere)
9.5.8. Snowflake (Observe)
9.5.9. Honeycomb
9.5.10. IBM
9.5.11. ServiceNow
9.5.12. SolarWinds
10. Appendix
10.1. Research Methodology
10.2. Report Assumptions
10.3. Acronyms and Abbreviations
| Telemetry Type | Metrics, Logs, Traces, Events & Others |
| Organization Size | Large Enterprises, Small & Medium Enterprises |
| End Use | IT & Telecom, Banking & Financial Services, Retail & E-commerce, Healthcare, Government, Others |
| Regions | North America, Europe, Asia Pacific, Latin America, Middle East & Africa |
Our Research Methodology
Considering the volatility of business today, traditional approaches to strategizing a game plan can be unfruitful if not detrimental. True ambiguity is no way to determine a forecast. A myriad of predetermined factors must be accounted for such as the degree of risk involved, the magnitude of circumstances, as well as conditions or consequences that are not known or unpredictable. To circumvent binary views that cast uncertainty, the application of market research intelligence to strategically posture, move, and enable actionable outcomes is necessary.
View Methodology
Quality Assured
Rigorous Validation Process

Confidentiality Assured
End-to-end Data Security

Custom Research Services
Tailored To Your Objectives
FAQs
The observability tools and platforms market is valued at US$ 11.95 billion in 2026, led by large enterprises in North America.
The market is projected to reach US$ 30.08 billion by 2033, growing at a 14.1% CAGR and adding US$ 18.13 billion.
Traces are growing fastest at a 17.2% CAGR through 2033, driven by microservices, Kubernetes, and rising AI agent monitoring needs.
Asia Pacific is growing fastest at a 17.3% CAGR through 2033, driven by cloud adoption in India, China, and Japan.
North America holds the largest share at 42.6% in 2026, supported by leading vendors, cloud providers, and mature DevOps practices.
Related Reports
Radiation Hardened Electronics Market Size, Share, Insights, Competitive Landscape, and Forecast 2026 to 2033
Radiation hardened electronics market to reach US$ 3.09 billion by 2033 at a 6.1% CAGR. Explore components, materials and regional trends.
Multi-Layer Ceramic Capacitor Market Size, Share, Insights, Competitive Landscape, and Forecast 2026 to 2033
Explore the multi-layer ceramic capacitor market, reaching US$ 28.65 billion by 2033 at 7.2% CAGR, with segments and regional insights.
Multi-factor Authentication Market Size, Share, Insights, Competitive Landscape, and Forecast 2026 to 2033
Explore the multi-factor authentication market, reaching US$ 54.00 billion by 2033 at 13.0% CAGR, with segments and regional insights.
Multi-Cloud Computing Market Size, Share, Insights, Competitive Landscape, and Forecast 2026 to 2033
Explore the multi-cloud computing market, reaching US$ 34.38 billion by 2033 at 14.4% CAGR, with segments, trends and regional insights.
Malware Analysis Market Size, Share, Insights, Competitive Landscape, and Forecast 2026 to 2033
Explore the malware analysis market, reaching US$ 21.0 billion by 2033 at 14.0% CAGR, with component, deployment and regional insights.
Language Translation Device Market Size, Share, Insights, Competitive Landscape, and Forecast 2026 to 2033
Explore the language translation device market, reaching US$ 3.43 billion by 2033 at 11.9% CAGR, with product, application and regional insights.