
Preclinical Imaging Market
Global Preclinical Imaging Industry Analysis, Size, Share, Growth, Trends, and Forecast 2026-2033 – (By Product Type ,By Application,By End-User, By Geographic Coverage and By Company)
Global Preclinical Imaging Market: Strategic Analysis 2026-2033
Executive Summary & Key Highlights
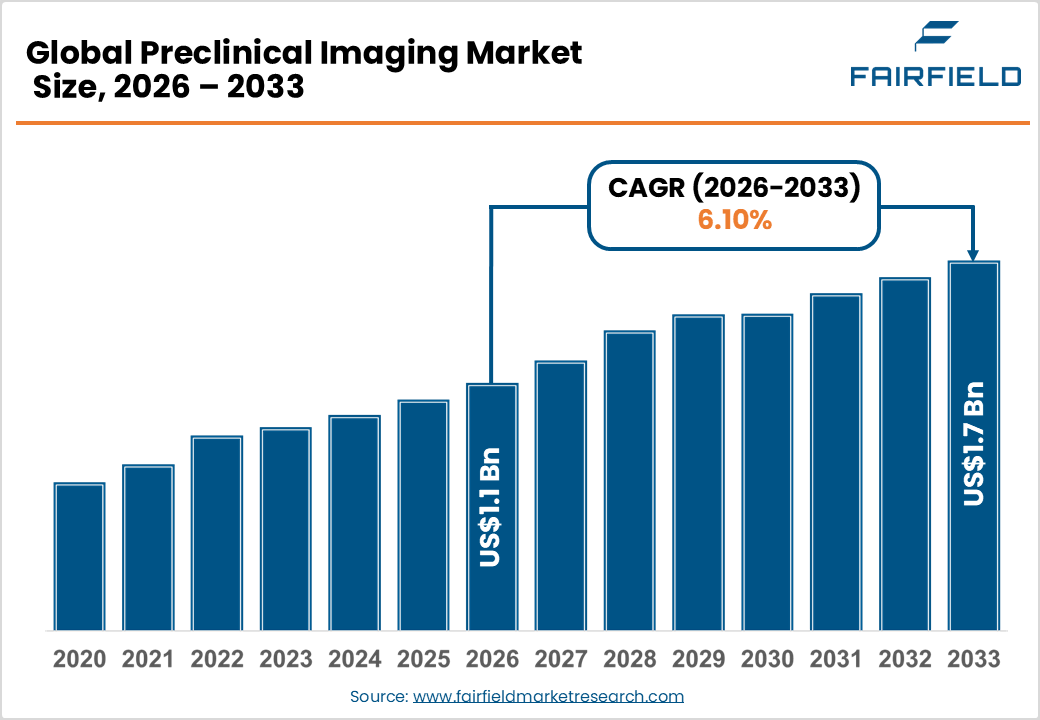
- The global Preclinical Imaging market size is likely to be valued at USD 1.1 billion in 2026 and is expected to reach USD 1.7 billion by 2033, growing at a CAGR of 6.10% during the forecast period from 2026 to 2033.
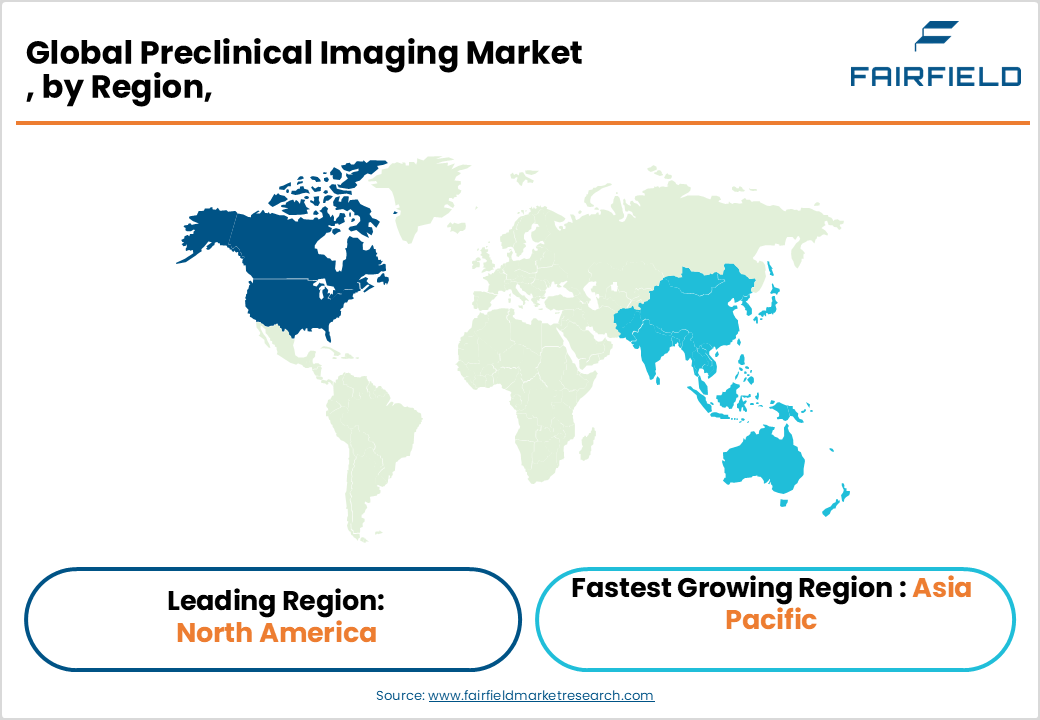
- North America leads the global Preclinical Imaging market with approximately 48% share, driven by record NIH funding, a dense pharmaceutical R&D ecosystem, and the world’s largest concentration of preclinical CRO infrastructure.
- Asia Pacific is the fastest-growing region, propelled by China’s 14th Five-Year Plan biomedical investment, India’s expanding CRO sector, and growing government R&D funding across Japan, South Korea, and Singapore.
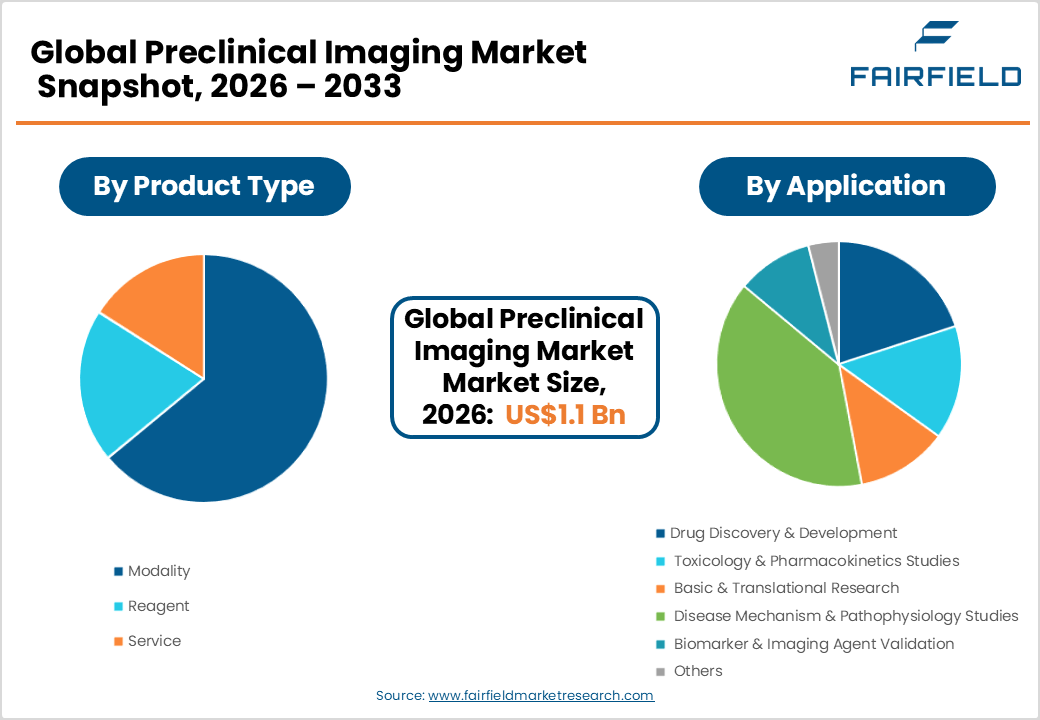
- The Modality segment commands approximately 62% of market share by type, led by multi-modal PET/CT and SPECT/CT systems that deliver comprehensive functional and anatomical imaging data critical for translational drug development.
- Contract Research Organizations represent the fastest-growing end-use segment, driven by the pharmaceutical industry’s accelerating outsourcing of capital-intensive preclinical imaging studies to specialized service providers globally.
- AI and machine learning integration into preclinical imaging workflows offers a transformative opportunity, enabling automated image analysis, higher throughput, and standardized quantitative outcomes demanded by pharmaceutical R&D organizations.
Market Dynamics: Drivers, Restraints, and Opportunities Analysis
Market Growth Drivers
- Surging Global Pharmaceutical R&D Investment and Drug Pipeline Expansion
The global pharmaceutical and biotechnology industry continues to set record levels of R&D investment, directly fueling demand for preclinical imaging technologies. According to the Pharmaceutical Research and Manufacturers of America (PhRMA), U.S. biopharmaceutical companies invested over USD 102 billion in R&D in 2022 alone, with the broader global figure substantially higher. Preclinical imaging is indispensable in early drug development enabling non-invasive, longitudinal monitoring of disease progression, drug biodistribution, and therapeutic efficacy in animal models before costly human trials. The growing complexity of drug candidates, particularly in immuno-oncology, gene therapy, and targeted radiopharmaceuticals, demands multi-modal imaging capabilities combining PET/CT, SPECT/CT, and MRI. This escalating R&D spend and pipeline complexity ensure robust, sustained demand for advanced preclinical imaging systems and reagents.
- Growing Prevalence of Chronic Diseases Intensifying Biomedical Research Activity
The rising global burden of chronic diseases including cancer, neurological disorders, cardiovascular disease, and diabetes is accelerating the pace and scale of biomedical research, creating persistent demand for preclinical imaging solutions. The World Health Organization (WHO) projects that non-communicable diseases will account for approximately 74% of all global deaths annually, underscoring the urgency of developing new therapeutic interventions. Preclinical imaging technologies such as bioluminescence imaging, micro-PET, and high-field MRI are essential tools for studying disease mechanisms, validating biomarkers, and assessing treatment efficacy in animal models. As academic research institutions, government agencies, and private sector players intensify focus on neurodegenerative diseases like Alzheimer’s and Parkinson’s, demand for sophisticated preclinical imaging platforms continues to grow significantly.
Market Restraints
- High Capital Cost of Preclinical Imaging Systems
Advanced preclinical imaging systems particularly high-field MRI scanners, PET/CT, and SPECT/CT platforms carry substantial capital acquisition costs, often ranging from USD 500,000 to over USD 3 million per system. These prohibitive upfront costs create significant access barriers for smaller academic institutions and emerging-market research organizations with limited capital budgets. Additionally, ongoing operational expenses including radiotracer synthesis, specialized maintenance contracts, and the requirement for trained imaging physicists and technicians further elevate the total cost of ownership. These financial constraints restrict the pace of new system installations, particularly in resource-constrained settings, limiting overall market penetration and volume growth.
- Stringent Regulatory Requirements for Animal Research and Imaging Agents
Preclinical imaging research is subject to a complex and increasingly stringent regulatory framework governing animal experimentation and the use of investigational imaging agents. In the U.S., the Institutional Animal Care and Use Committees (IACUCs) and the Animal Welfare Act impose rigorous protocols governing animal study design. In Europe, Directive 2010/63/EU on the protection of animals used for scientific purposes adds further compliance complexity. Novel imaging reagents and contrast agents require regulatory validation prior to use in research. These multi-layered compliance requirements increase lead times, add operational costs, and can slow the pace of preclinical study initiation, representing a meaningful restraint on market growth.
Market Opportunities
- AI and Machine Learning Integration Transforming Preclinical Image Analysis
The integration of artificial intelligence and machine learning into preclinical imaging workflows represents one of the most transformative opportunities for market participants. AI-powered image reconstruction, automated segmentation, and quantitative analysis tools are dramatically reducing image processing times and improving reproducibility critical requirements in regulated drug development environments. The National Institutes of Health (NIH) has invested significantly in AI-driven biomedical imaging research, including through the Bridge2AI program. Companies such as Bruker Corporation and Siemens Healthineers are actively developing AI-augmented preclinical imaging software platforms. As pharmaceutical companies demand higher throughput and standardized quantitative outcomes from preclinical studies, imaging system vendors that embed robust AI analytics capabilities stand to capture significant competitive advantage and command premium pricing for integrated hardware-software solutions.
- Rising Demand from Contract Research Organizations (CROs) Expanding Outsourcing Models
The rapid expansion of the global CRO industry presents a compelling structural growth opportunity for preclinical imaging equipment and service providers. According to the Association of Clinical Research Organizations (ACRO), the global CRO market has grown consistently at double-digit rates, driven by pharmaceutical companies’ strategic preference to outsource capital-intensive preclinical research activities. CROs that offer specialized preclinical imaging services including PET/CT, optical imaging, and ultrasound imaging represent a growing installed base for imaging system vendors and a reliable source of reagent and service revenue. Imaging system manufacturers that develop CRO-specific pricing models, modular system configurations for multi-study environments, and integrated data management platforms are well-positioned to capture a disproportionate share of this high-growth end-use segment.
Segmentation Analysis: Category-Wise Strategic Assessment
- By Type Analysis
The Modality segment dominates the Preclinical Imaging market by type, accounting for approximately 62% of total revenues. Imaging modalities encompassing PET, SPECT, MRI, CT, optical imaging, and ultrasound systems represent the core capital equipment investment in preclinical research facilities and command the highest per-unit revenue of any segment. The modality segment’s leadership is reinforced by continuous technological innovation, including the development of multi-modal integrated platforms such as PET/MRI and SPECT/CT, which deliver superior anatomical and functional imaging data in a single session. According to the Society of Nuclear Medicine and Molecular Imaging (SNMMI), demand for hybrid imaging systems in preclinical settings has grown significantly, driven by their ability to generate comprehensive translational datasets essential for advancing drug candidates from bench to clinic.
- By Application Analysis
The Drug Discovery & Development application segment holds the leading position in the Preclinical Imaging market by application, accounting for approximately 38% of total application-based revenues. Drug discovery and development is the primary end-application driving demand for preclinical imaging, as imaging technologies are indispensable for evaluating pharmacokinetics, target engagement, and therapeutic efficacy of new molecular entities in vivo. The U.S. FDA’s emphasis on translational biomarkers and imaging endpoints in regulatory submissions has further embedded preclinical imaging as a standard requirement in early drug development workflows. The rapid expansion of oncology and CNS drug pipelines globally ensures that drug discovery remains the largest and most consistently growing application segment, underpinning sustained capital and reagent expenditure across pharmaceutical and biotechnology research organizations.
- By End Use Analysis
The Pharma and Biotech Companies segment is the leading end-use category in the Preclinical Imaging market, representing approximately 44% of total end-use revenues. Large pharmaceutical companies and emerging biotechs maintain extensive in-house preclinical research capabilities, investing in state-of-the-art imaging infrastructure to support their proprietary drug pipelines. These organizations require the highest-performance imaging systems including high-field MRI, dedicated small-animal PET/CT, and IVIS optical imaging platforms to generate the rigorous, quantitative in vivo data required by FDA, EMA, and other regulatory bodies. According to PhRMA, only approximately 12% of drug candidates that enter clinical trials ultimately receive approval, making high-quality preclinical characterization via advanced imaging a critical investment in reducing downstream clinical failure rates.
Regional Market Assessment: Strategic Geography Analysis
- North America Preclinical Imaging Trends
North America leads the global Preclinical Imaging market, holding approximately 48% of total market share, with the United States as the dominant national market. The U.S. benefits from the world’s largest biomedical research ecosystem, anchored by NIH funding that exceeded USD 47 billion in fiscal year 2023, supporting thousands of preclinical research programs across academic medical centers, government laboratories, and private sector R&D facilities. The concentration of leading pharmaceutical and biotechnology companies including in the Boston, San Francisco Bay Area, and San Diego biopharma hubs ensures a dense, high-spending installed base for preclinical imaging systems.
The U.S. FDA’s regulatory framework, particularly its support for imaging biomarker qualification through the Biomarker Qualification Program, reinforces the integration of preclinical imaging into IND-enabling study designs. Canada contributes meaningfully through its well-funded academic research network, including institutions such as the University of Toronto and McGill University, which operate advanced preclinical imaging core facilities. The region’s strong CRO presence home to global leaders such as Charles River Laboratories and Covance (Labcorp Drug Development) further amplifies preclinical imaging service demand across the outsourcing value chain.
- Europe Preclinical Imaging Trends
Europe represents the second-largest regional market for preclinical imaging, driven by a sophisticated academic and industry research infrastructure and a harmonized regulatory environment under Directive 2010/63/EU governing animal research practices. Germany is the region’s largest national market, home to premier research institutions such as the Helmholtz Association and the Max Planck Society, as well as major pharmaceutical companies including Bayer AG and Boehringer Ingelheim that maintain significant preclinical imaging capabilities. The U.K.’s Medical Research Council (MRC) and Wellcome Trust continue to fund translational imaging research programs at leading universities including Oxford, Cambridge, and UCL.
France and the Netherlands are notable for their strong academic imaging research traditions, with the French National Institute of Health and Medical Research (INSERM) operating extensive preclinical imaging platforms. European regulatory harmonization through the European Medicines Agency (EMA) and the push for the 3Rs principles (Replacement, Reduction, Refinement) in animal research are driving adoption of advanced non-invasive imaging to minimize animal use. Companies such as Mediso Ltd. (Hungary) and MR Solutions (U.K.) are homegrown European champions in preclinical imaging system manufacturing, reflecting the region’s deep technical expertise.
- Asia Pacific Preclinical Imaging Trends
Asia Pacific is the fastest-growing regional market for preclinical imaging, driven by rapidly increasing government investment in biomedical R&D, the emergence of a competitive domestic pharmaceutical industry, and the expansion of CRO infrastructure across China, Japan, South Korea, and India. China’s government has prioritized pharmaceutical innovation through its 14th Five-Year Plan (2021–2025), committing substantial funding to biomedical research infrastructure. The National Natural Science Foundation of China (NSFC) annually funds thousands of preclinical research grants, creating sustained demand for advanced imaging systems across universities and research institutes.
Japan maintains a mature preclinical imaging market, with FUJIFILM VisualSonics and leading academic institutions such as RIKEN and the University of Tokyo operating state-of-the-art preclinical imaging facilities. India’s biomedical research sector is growing rapidly, supported by Department of Biotechnology (DBT) funding and the expansion of CROs including Syngene International and Jubilant Biosys. South Korea and Singapore are emerging as regional innovation hubs.
Competitive Landscape: Market Structure and Strategic Positioning
The global Preclinical Imaging market is moderately consolidated, characterized by a small number of technologically advanced multinational players and a larger cohort of specialized regional manufacturers. Bruker Corporation, Siemens Healthineers, Revvity (formerly PerkinElmer), and FUJIFILM VisualSonics hold dominant positions through extensive modality portfolios, global service networks, and deep integration with pharmaceutical R&D workflows. Competitive differentiation centers on multi-modal imaging capability, software analytics sophistication, system sensitivity and resolution, and total cost of ownership. Strategic priorities include AI-powered image analysis integration, modular system upgradability, and geographic expansion in Asia Pacific. Mergers and partnerships with imaging reagent suppliers and CROs are increasingly common business model strategies to capture recurring revenue streams.
Key Players
- Bruker Corporation
- Cubresa Inc.
- Siemens Healthineers
- Revvity (formerly PerkinElmer, Inc.)
- MR Solutions
- Mediso Ltd.
- Rigaku (MILabs B.V.)
- Aspect Imaging
- TriFoil Imaging
- FUJIFILM VisualSonics
- Nikon Instruments Inc.
- Molecular Devices, LLC
- BioVet Solutions
- Inviscan SAS
Key Industry Developments
- January 2025: Bruker Corporation launched the next-generation Si78 PET/SPECT/CT preclinical imaging platform, featuring enhanced sensitivity and integrated AI-powered reconstruction software, targeting high-throughput pharmaceutical R&D and CRO environments globally.
- September 2024: Revvity (formerly PerkinElmer) expanded its preclinical imaging reagent portfolio with a new suite of near-infrared fluorescent probes specifically designed for oncology and neurological disease models, reinforcing its position in the imaging agent validation segment.
- April 2024: MR Solutions introduced a new cryogen-free, compact 3T preclinical MRI system designed for space-constrained academic and CRO imaging laboratories, broadening market accessibility for institutions with limited infrastructure budgets.
Segmentation
By Product Type
- Modality
- Reagent
- Service
By Application
- Drug Discovery & Development
- Toxicology & Pharmacokinetics Studies
- Basic & Translational Research
- Disease Mechanism & Pathophysiology Studies
- Biomarker & Imaging Agent Validation
- Others
By End-User
- Pharma and Biotech Companies
- Contract Research Organizations (CROs)
- Academic and Research Institutes
- Others
By Region
- North America
- Europe
- Asia Pacific
- Latin America
- Middle East & Africa
- Executive Summary
- Global Preclinical Imaging Market Snapshot
- Future Projections
- Key Market Trends
- Regional Snapshot, by Value, 2026
- Analyst Recommendations
- Market Overview
- Market Definitions and Segmentations
- Market Dynamics
- Drivers
- Restraints
- Market Opportunities
- Value Chain Analysis
- COVID-19 Impact Analysis
- Porter's Five Forces Analysis
- Impact of Russia-Ukraine Conflict
- PESTLE Analysis
- Regulatory Analysis
- Price Trend Analysis
- Current Prices and Future Projections, 2025-2033
- Price Impact Factors
- Global Preclinical Imaging Market Outlook, 2020 - 2033
- Global Preclinical Imaging Market Outlook, by Product Type, Value (US$ Bn), 2020-2033
- Modality
- Reagent
- Service
- Global Preclinical Imaging Market Outlook, by Application, Value (US$ Bn), 2020-2033
- Drug Discovery & Development
- Toxicology & Pharmacokinetics Studies
- Basic & Translational Research
- Disease Mechanism & Pathophysiology Studies
- Biomarker & Imaging Agent Validation
- Others
- Global Preclinical Imaging Market Outlook, by End-User, Value (US$ Bn), 2020-2033
- Pharma and Biotech Companies
- Contract Research Organizations (CROs)
- Academic and Research Institutes
- Others
- Global Preclinical Imaging Market Outlook, by Region, Value (US$ Bn), 2020-2033
- North America
- Europe
- Asia Pacific
- Latin America
- Middle East & Africa
- Global Preclinical Imaging Market Outlook, by Product Type, Value (US$ Bn), 2020-2033
- North America Preclinical Imaging Market Outlook, 2020 - 2033
- North America Preclinical Imaging Market Outlook, by Product Type, Value (US$ Bn), 2020-2033
- Modality
- Reagent
- Service
- North America Preclinical Imaging Market Outlook, by Application, Value (US$ Bn), 2020-2033
- Drug Discovery & Development
- Toxicology & Pharmacokinetics Studies
- Basic & Translational Research
- Disease Mechanism & Pathophysiology Studies
- Biomarker & Imaging Agent Validation
- Others
- North America Preclinical Imaging Market Outlook, by End-User, Value (US$ Bn), 2020-2033
- Pharma and Biotech Companies
- Contract Research Organizations (CROs)
- Academic and Research Institutes
- Others
- North America Preclinical Imaging Market Outlook, by Country, Value (US$ Bn), 2020-2033
- U.S. Preclinical Imaging Market Outlook, by Product Type, 2020-2033
- U.S. Preclinical Imaging Market Outlook, by Application, 2020-2033
- U.S. Preclinical Imaging Market Outlook, by End-User, 2020-2033
- Canada Preclinical Imaging Market Outlook, by Product Type, 2020-2033
- Canada Preclinical Imaging Market Outlook, by Application, 2020-2033
- Canada Preclinical Imaging Market Outlook, by End-User, 2020-2033
- BPS Analysis/Market Attractiveness Analysis
- North America Preclinical Imaging Market Outlook, by Product Type, Value (US$ Bn), 2020-2033
- Europe Preclinical Imaging Market Outlook, 2020 - 2033
- Europe Preclinical Imaging Market Outlook, by Product Type, Value (US$ Bn), 2020-2033
- Modality
- Reagent
- Service
- Europe Preclinical Imaging Market Outlook, by Application, Value (US$ Bn), 2020-2033
- Drug Discovery & Development
- Toxicology & Pharmacokinetics Studies
- Basic & Translational Research
- Disease Mechanism & Pathophysiology Studies
- Biomarker & Imaging Agent Validation
- Others
- Europe Preclinical Imaging Market Outlook, by End-User, Value (US$ Bn), 2020-2033
- Pharma and Biotech Companies
- Contract Research Organizations (CROs)
- Academic and Research Institutes
- Others
- Europe Preclinical Imaging Market Outlook, by Country, Value (US$ Bn), 2020-2033
- Germany Preclinical Imaging Market Outlook, by Product Type, 2020-2033
- Germany Preclinical Imaging Market Outlook, by Application, 2020-2033
- Germany Preclinical Imaging Market Outlook, by End-User, 2020-2033
- Italy Preclinical Imaging Market Outlook, by Product Type, 2020-2033
- Italy Preclinical Imaging Market Outlook, by Application, 2020-2033
- Italy Preclinical Imaging Market Outlook, by End-User, 2020-2033
- France Preclinical Imaging Market Outlook, by Product Type, 2020-2033
- France Preclinical Imaging Market Outlook, by Application, 2020-2033
- France Preclinical Imaging Market Outlook, by End-User, 2020-2033
- U.K. Preclinical Imaging Market Outlook, by Product Type, 2020-2033
- U.K. Preclinical Imaging Market Outlook, by Application, 2020-2033
- U.K. Preclinical Imaging Market Outlook, by End-User, 2020-2033
- Spain Preclinical Imaging Market Outlook, by Product Type, 2020-2033
- Spain Preclinical Imaging Market Outlook, by Application, 2020-2033
- Spain Preclinical Imaging Market Outlook, by End-User, 2020-2033
- Russia Preclinical Imaging Market Outlook, by Product Type, 2020-2033
- Russia Preclinical Imaging Market Outlook, by Application, 2020-2033
- Russia Preclinical Imaging Market Outlook, by End-User, 2020-2033
- Rest of Europe Preclinical Imaging Market Outlook, by Product Type, 2020-2033
- Rest of Europe Preclinical Imaging Market Outlook, by Application, 2020-2033
- Rest of Europe Preclinical Imaging Market Outlook, by End-User, 2020-2033
- BPS Analysis/Market Attractiveness Analysis
- Europe Preclinical Imaging Market Outlook, by Product Type, Value (US$ Bn), 2020-2033
- Asia Pacific Preclinical Imaging Market Outlook, 2020 - 2033
- Asia Pacific Preclinical Imaging Market Outlook, by Product Type, Value (US$ Bn), 2020-2033
- Modality
- Reagent
- Service
- Asia Pacific Preclinical Imaging Market Outlook, by Application, Value (US$ Bn), 2020-2033
- Drug Discovery & Development
- Toxicology & Pharmacokinetics Studies
- Basic & Translational Research
- Disease Mechanism & Pathophysiology Studies
- Biomarker & Imaging Agent Validation
- Others
- Asia Pacific Preclinical Imaging Market Outlook, by End-User, Value (US$ Bn), 2020-2033
- Pharma and Biotech Companies
- Contract Research Organizations (CROs)
- Academic and Research Institutes
- Others
- Asia Pacific Preclinical Imaging Market Outlook, by Country, Value (US$ Bn), 2020-2033
- China Preclinical Imaging Market Outlook, by Product Type, 2020-2033
- China Preclinical Imaging Market Outlook, by Application, 2020-2033
- China Preclinical Imaging Market Outlook, by End-User, 2020-2033
- Japan Preclinical Imaging Market Outlook, by Product Type, 2020-2033
- Japan Preclinical Imaging Market Outlook, by Application, 2020-2033
- Japan Preclinical Imaging Market Outlook, by End-User, 2020-2033
- South Korea Preclinical Imaging Market Outlook, by Product Type, 2020-2033
- South Korea Preclinical Imaging Market Outlook, by Application, 2020-2033
- South Korea Preclinical Imaging Market Outlook, by End-User, 2020-2033
- India Preclinical Imaging Market Outlook, by Product Type, 2020-2033
- India Preclinical Imaging Market Outlook, by Application, 2020-2033
- India Preclinical Imaging Market Outlook, by End-User, 2020-2033
- Southeast Asia Preclinical Imaging Market Outlook, by Product Type, 2020-2033
- Southeast Asia Preclinical Imaging Market Outlook, by Application, 2020-2033
- Southeast Asia Preclinical Imaging Market Outlook, by End-User, 2020-2033
- Rest of SAO Preclinical Imaging Market Outlook, by Product Type, 2020-2033
- Rest of SAO Preclinical Imaging Market Outlook, by Application, 2020-2033
- Rest of SAO Preclinical Imaging Market Outlook, by End-User, 2020-2033
- BPS Analysis/Market Attractiveness Analysis
- Asia Pacific Preclinical Imaging Market Outlook, by Product Type, Value (US$ Bn), 2020-2033
- Latin America Preclinical Imaging Market Outlook, 2020 - 2033
- Latin America Preclinical Imaging Market Outlook, by Product Type, Value (US$ Bn), 2020-2033
- Modality
- Reagent
- Service
- Latin America Preclinical Imaging Market Outlook, by Application, Value (US$ Bn), 2020-2033
- Drug Discovery & Development
- Toxicology & Pharmacokinetics Studies
- Basic & Translational Research
- Disease Mechanism & Pathophysiology Studies
- Biomarker & Imaging Agent Validation
- Others
- Latin America Preclinical Imaging Market Outlook, by End-User, Value (US$ Bn), 2020-2033
- Pharma and Biotech Companies
- Contract Research Organizations (CROs)
- Academic and Research Institutes
- Others
- Latin America Preclinical Imaging Market Outlook, by Country, Value (US$ Bn), 2020-2033
- Brazil Preclinical Imaging Market Outlook, by Product Type, 2020-2033
- Brazil Preclinical Imaging Market Outlook, by Application, 2020-2033
- Brazil Preclinical Imaging Market Outlook, by End-User, 2020-2033
- Mexico Preclinical Imaging Market Outlook, by Product Type, 2020-2033
- Mexico Preclinical Imaging Market Outlook, by Application, 2020-2033
- Mexico Preclinical Imaging Market Outlook, by End-User, 2020-2033
- Argentina Preclinical Imaging Market Outlook, by Product Type, 2020-2033
- Argentina Preclinical Imaging Market Outlook, by Application, 2020-2033
- Argentina Preclinical Imaging Market Outlook, by End-User, 2020-2033
- Rest of LATAM Preclinical Imaging Market Outlook, by Product Type, 2020-2033
- Rest of LATAM Preclinical Imaging Market Outlook, by Application, 2020-2033
- Rest of LATAM Preclinical Imaging Market Outlook, by End-User, 2020-2033
- BPS Analysis/Market Attractiveness Analysis
- Latin America Preclinical Imaging Market Outlook, by Product Type, Value (US$ Bn), 2020-2033
- Middle East & Africa Preclinical Imaging Market Outlook, 2020 - 2033
- Middle East & Africa Preclinical Imaging Market Outlook, by Product Type, Value (US$ Bn), 2020-2033
- Modality
- Reagent
- Service
- Middle East & Africa Preclinical Imaging Market Outlook, by Application, Value (US$ Bn), 2020-2033
- Drug Discovery & Development
- Toxicology & Pharmacokinetics Studies
- Basic & Translational Research
- Disease Mechanism & Pathophysiology Studies
- Biomarker & Imaging Agent Validation
- Others
- Middle East & Africa Preclinical Imaging Market Outlook, by End-User, Value (US$ Bn), 2020-2033
- Pharma and Biotech Companies
- Contract Research Organizations (CROs)
- Academic and Research Institutes
- Others
- Middle East & Africa Preclinical Imaging Market Outlook, by Country, Value (US$ Bn), 2020-2033
- GCC Preclinical Imaging Market Outlook, by Product Type, 2020-2033
- GCC Preclinical Imaging Market Outlook, by Application, 2020-2033
- GCC Preclinical Imaging Market Outlook, by End-User, 2020-2033
- South Africa Preclinical Imaging Market Outlook, by Product Type, 2020-2033
- South Africa Preclinical Imaging Market Outlook, by Application, 2020-2033
- South Africa Preclinical Imaging Market Outlook, by End-User, 2020-2033
- Egypt Preclinical Imaging Market Outlook, by Product Type, 2020-2033
- Egypt Preclinical Imaging Market Outlook, by Application, 2020-2033
- Egypt Preclinical Imaging Market Outlook, by End-User, 2020-2033
- Nigeria Preclinical Imaging Market Outlook, by Product Type, 2020-2033
- Nigeria Preclinical Imaging Market Outlook, by Application, 2020-2033
- Nigeria Preclinical Imaging Market Outlook, by End-User, 2020-2033
- Rest of Middle East Preclinical Imaging Market Outlook, by Product Type, 2020-2033
- Rest of Middle East Preclinical Imaging Market Outlook, by Application, 2020-2033
- Rest of Middle East Preclinical Imaging Market Outlook, by End-User, 2020-2033
- BPS Analysis/Market Attractiveness Analysis
- Middle East & Africa Preclinical Imaging Market Outlook, by Product Type, Value (US$ Bn), 2020-2033
- Competitive Landscape
- Company Vs Segment Heatmap
- Company Market Share Analysis, 2025
- Competitive Dashboard
- Company Profiles
- Bruker Corporation
- Company Overview
- Product Portfolio
- Financial Overview
- Business Strategies and Developments
- Cubresa Inc.
- Siemens Healthineers
- Revvity (PerkinElmer, Inc)
- MR Solutions
- Mediso Ltd.
- Rigaku (MILabs B.V.)
- Aspect Imaging
- TriFoil Imaging
- FUJIFILM VisualSonics
- Bruker Corporation
- Appendix
- Research Methodology
- Report Assumptions
- Acronyms and Abbreviations
|
BASE YEAR |
HISTORICAL DATA |
FORECAST PERIOD |
UNITS |
|||
|
2025 |
|
2019 - 2025 |
2026 - 2033 |
Value: US$ Billion |
||
|
REPORT FEATURES |
DETAILS |
|
By Product Type Coverage |
|
|
By Application Coverage |
|
|
Geographical Coverage |
|
|
Leading Companies |
|
|
Report Highlights |
Key Market Indicators, Macro-micro economic impact analysis, Technological Roadmap, Key Trends, Driver, Restraints, and Future Opportunities & Revenue Pockets, Porter’s 5 Forces Analysis, Historical Trend (2019-2024), Market Estimates and Forecast, Market Dynamics, Industry Trends, Competition Landscape, Category, Region, Country-wise Trends & Analysis, COVID-19 Impact Analysis (Demand and Supply Chain) |
Our Research Methodology
Considering the volatility of business today, traditional approaches to strategizing a game plan can be unfruitful if not detrimental. True ambiguity is no way to determine a forecast. A myriad of predetermined factors must be accounted for such as the degree of risk involved, the magnitude of circumstances, as well as conditions or consequences that are not known or unpredictable. To circumvent binary views that cast uncertainty, the application of market research intelligence to strategically posture, move, and enable actionable outcomes is necessary.
View Methodology
Quality Assured
Rigorous Validation Process

Confidentiality Assured
End-to-end Data Security

Custom Research Services
Tailored To Your Objectives
FAQs
The Preclinical Imaging market size is USD 1.1 billion in 2026.
The Preclinical Imaging market is projected 6.10% CAGR by 2033.
The Preclinical Imaging market growth drivers include R&D investment surge, CRO outsourcing expansion, and hybrid technology advancements.
North America is the dominating region for Preclinical Imaging market.
Bruker, Siemens, PerkinElmer, Mediso, and Medtronic are some leading industry players in the Preclinical Imaging market.
Related Reports
Aortic Stent Grafts Market Insights, Competitive Landscape, and Market Forecast 2033
The aortic stent grafts market is forecast to reach US$5.45 billion by 2033 from US$3.80 billion in 2026, registering a 5.3% CAGR over the forecast period.
Fructosamine Test Market Insights, Competitive Landscape, and Market Forecast - 2033
The Fructosamine Test Market is projected to grow from USD 382.2 Million in 2026 to USD 545 Million by 2033, at a CAGR of 5.2%
Urothelial Carcinoma Diagnostics Market Insights, Competitive Landscape, and Market Forecast - 2033
The Urothelial Carcinoma Diagnostics Market is expected to grow from USD 2.1 Billion in 2026 to USD 4 Billion by 2033, registering a CAGR of 9.8%
Prefilled Syringes Market Insights, Competitive Landscape, and Market Forecast - 2033
The Prefilled Syringes Market is expected to grow from USD 2.8 Billion in 2026 to USD 5.1 Billion by 2033, registering a CAGR of 8.8%
Biofilm Treatment Market Insights, Competitive Landscape, and Market Forecast - 2033
The Biofilm Treatment Market is expected to grow from USD 2.5 Billion in 2026 to USD 4.4 Billion by 2033, registering a CAGR of 8.5%
Elastomeric Infusion Pumps Market Insights, Competitive Landscape, and Market Forecast - 2033
The Elastomeric Infusion Pumps Market is expected to grow from USD 1.3 Billion in 2026 to USD 2.1 Billion by 2033, registering a CAGR of 7.3%