



Smart Water Management Market
Smart Water Management Market Size, Share, Insights, Competitive Landscape, and Forecast 2026 to 2033
Smart Water Management Market Size and Trend Analysis
What Is the Growth Outlook for Smart Water Management?
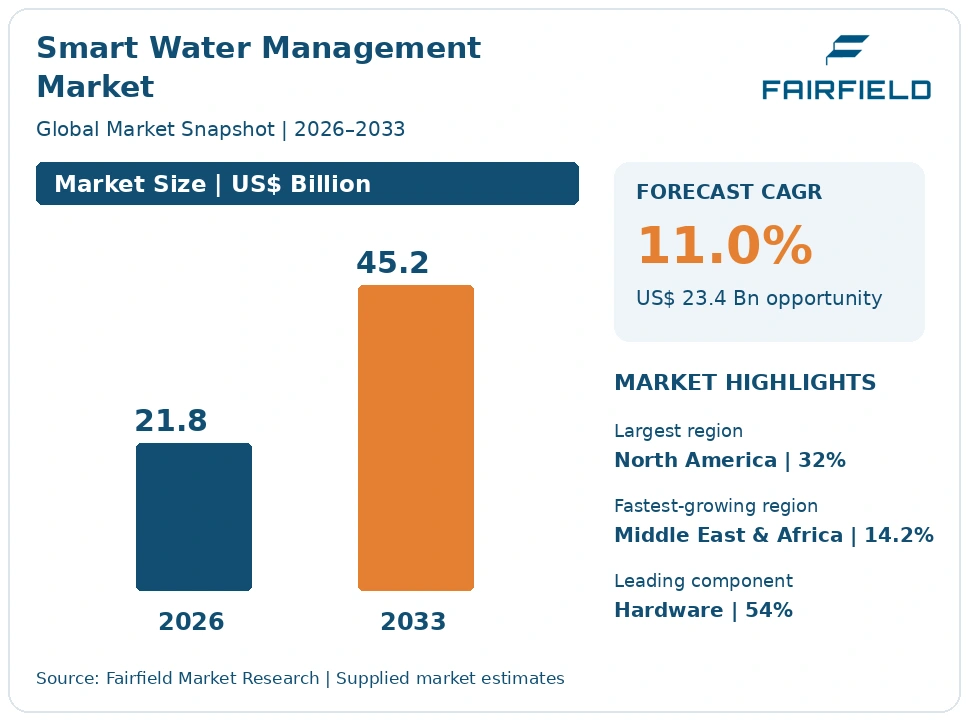
The global Smart Water Management market size is expected to be valued at US$ 21.8 billion in 2026 and projected to reach US$ 45.2 billion by 2033, growing at a CAGR of 11.0% between 2026 and 2033.
The technology layer serving water utilities grew at roughly 9.4% a year between 2020 and 2025, held back by delayed meter replacement programmes and constrained utility capital. Three factors lift the pace from 2026. Non-revenue water remains the only business case that reliably clears a utility board, and metering plus leak detection now offer payback periods short enough to approve. Recast European water directives have made leakage assessment and wastewater monitoring statutory rather than optional. Water scarcity programmes in arid countries are funding full network instrumentation from the outset. Growth will be steady rather than explosive, because procurement cycles in this sector are measured in years, not quarters.
Key Report Takeaways
- By Component, Hardware held 54% share in 2026, while Software is projected to expand at a 12.9% CAGR through 2033, as utilities discover that meter and sensor data without analytics produces no measurable water saving.
- By Solution, Smart Water Meters and Advanced Metering Infrastructure held 34% share in 2026, while Network Modelling and Hydraulic Digital Twins is projected to expand at a 15.6% CAGR, driven by pressure management and renewal planning needs.
- By Application, Drinking Water Networks held 58% share in 2026, while Wastewater and Stormwater is projected to expand at a 12.6% CAGR, pushed by sewer overflow monitoring and discharge reporting obligations.
- By End User, Municipal Water Utilities held 63% share in 2026, while Industrial and Commercial Users is projected to expand at a 12.4% CAGR, as manufacturers meet water efficiency targets under ISO 46001.
- By Geography, North America held 32% share in 2026, while Middle East & Africa is projected to expand at a 14.2% CAGR, supported by desalination economics and national water scarcity programmes.
Global Smart Water Management Market Trends and Insights
Drivers Impact Analysis
Two forces explain most incremental spending on water technology through 2033.
| Driver | Impact on CAGR Forecast | Geographic Relevance | Impact Timeline |
| Non-revenue water losses creating a measurable payback case | High | Global | Short term ≤2 years |
| Recast European water directives mandating leakage assessment and monitoring | High | Europe, with spillover to export markets | Medium term 2–4 years |
Non-Revenue Water Losses Give Utility Boards the Only Payback Case That Clears
Non-revenue water is the business case for this entire market. Utilities commonly lose a fifth to a third of treated water between the plant and the customer through leakage, metering under-registration and unbilled consumption. Every lost cubic metre has already been abstracted, treated, pumped and chemically dosed, so the loss carries real operating cost. Recovering a portion of it funds the technology directly.
That arithmetic is what gets budget approved. A finance director will not sign off on sustainability framing alone, but will sign off on a project that recovers billable volume and defers a new abstraction licence. Acoustic and pressure-based leak detection, district metered areas and meter replacement are therefore the first purchases, with non-revenue water management performance often written into the contract. Energy savings from pump optimisation strengthen the same case, since pumping is usually a utility’s largest electricity bill.
Recast European Water Directives Make Leakage and Overflow Monitoring a Statutory Duty
European regulation has converted discretionary monitoring into a legal obligation, which removes the approval question entirely. The recast EU Drinking Water Directive introduced a risk-based approach across the supply chain and requires member states to assess water loss levels and act where losses are high. The recast EU Urban Wastewater Treatment Directive adds monitoring duties and energy-neutrality expectations for treatment operators.
The mechanism is reporting. A utility cannot report leakage levels or storm overflow frequency without instrumentation, so flow meters, pressure loggers, level sensors and telemetry become compliance infrastructure rather than efficiency projects. PFAS limits in drinking water in both the European Union and the United States extend the same logic to water quality sensing and sampling programmes. Standards such as ISO 24510 to ISO 24512 give utilities a common vocabulary for service assessment, which makes benchmarking across operators practical.
Restraints Impact Analysis
Two structural features of the water sector, not technology gaps, set the ceiling on adoption.
| Restraint | Impact on CAGR Forecast | Geographic Relevance | Impact Timeline |
| Fragmentation across thousands of small publicly owned utilities | High | Global, severest in North America and Europe | Long term ≥4 years |
| Tariff-constrained capital and very long asset replacement cycles | Medium | Global | Medium term 2–4 years |
Fragmentation Across Thousands of Small Utilities Blocks Smart Water Procurement
Fragmentation, not technology maturity, is the brake on this market. Water service is delivered by tens of thousands of separate operators worldwide, many serving fewer than ten thousand connections, each with its own board, tariff and procurement process. A vendor must win hundreds of small tenders to reach the revenue a single large utility contract would deliver, which makes customer acquisition cost the dominant economic problem.
The cause is structural and political. Water systems were built municipality by municipality and remain publicly owned, with elected officials reluctant to surrender control through consolidation. Small operators have no engineer dedicated to data, no analytics skills and no appetite for a system they cannot maintain. Vendors respond with hosted software and managed services sold through state revolving funds, cooperatives and regional purchasing frameworks, but these channels take years to build.
Tariff-Constrained Capital and Long Asset Lives Delay Meter and Sensor Replacement
Capital scarcity pushes smart water projects to the back of the queue. Water tariffs are politically set and frequently held below cost recovery, so utilities must choose between replacing failing mains, meeting a treatment consent and instrumenting the network. Pipes that are visibly failing win that contest, and metering programmes slip by several budget cycles.
The specific cost source is the installed meter base and its replacement economics. Mechanical meters are depreciated over fifteen to twenty years, and a utility will not scrap a working asset early without a regulator permitting cost recovery. Full advanced metering infrastructure also requires a communications network, head-end systems and billing integration, so the meter itself is often under half the project cost. Where regulators allow the investment into the rate base, rollouts accelerate sharply; where they do not, they stall.
Market Opportunities
Advanced Metering Infrastructure Rollouts Create a Recurring Meter Data and Analytics Pool
Advanced metering rollouts open a recurring software and services pool that is larger and more durable than the meter hardware itself. Once a utility reads every connection hourly, it generates data volumes that no billing system was designed for, and meter data management, leak alerting and customer engagement portals become necessary purchases. These are annual subscriptions rather than one-off capital items.
Metering vendors, independent software firms and utility service providers are all positioned to capture this, and the customer group is any utility moving from quarterly manual reads to continuous data. Demand is strongest where regulators have approved full rollouts and where customer-side leak alerts reduce dispute volumes. Water scarcity programmes reinforce it, because consumption analytics is the only practical way to target conservation measures household by household.
Water System Cybersecurity and Resilience Services Open a New Utility Budget Line
Cybersecurity and resilience work for water control systems is a genuinely new budget line, created by the exposure of utility operational technology to public networks. Many small systems run remote telemetry and SCADA with default credentials and no monitoring, and regulators have made clear that this is unacceptable. Assessment, segmentation, secure remote access and monitoring are sold as services, not products.
Specialist industrial control system firms, engineering consultancies and automation vendors are best placed to deliver it, and the demand comes from utility operations teams rather than information technology departments. The United States Environmental Protection Agency and sector bodies have issued guidance and advisories on water system cybersecurity, and the America’s Water Infrastructure Act already obliges larger systems to complete risk and resilience assessments, which gives the work a recurring cycle.
Segment Analysis
By Component: Hardware Dominates Installed Spending While Software Grows Quickest
Hardware dominated with 54% share in 2026, because meters, pressure and flow sensors, water quality probes, loggers and telemetry units carry the bulk of project cost and must be installed before anything else works. A single metering rollout can absorb a utility’s technology budget for several years. Software is the fastest-growing component at a 12.9% CAGR through 2033, as operators discover that data without analytics delivers no measurable saving, and as meter data management, leak alerting and hydraulic modelling move to annual subscriptions. Services sit between the two, covering installation, integration and increasingly the operation of the analytics itself for utilities with no in-house capability. The implication for vendors is a slow mix shift toward recurring revenue, which smooths the lumpy capital cycles that have historically made water technology earnings unpredictable.
By Solution: Smart Metering Leads Volume While Hydraulic Digital Twins Expand Fastest
Smart Water Meters and Advanced Metering Infrastructure led with 34% share in 2026, because metering is the single investment that improves both billing accuracy and loss visibility, and because the revenue recovery argument is easy to quantify. Leak detection and non-revenue water management forms the next largest block and is often bought alongside it. Network Modelling and Hydraulic Digital Twins is the fastest-growing solution at a 15.6% CAGR, as utilities use calibrated live models to manage pressure, plan renewals and test operating scenarios before committing capital. SCADA and remote telemetry remain the backbone of operations, water quality monitoring expands under tightening limits, and wastewater and stormwater monitoring grows on overflow reporting duties. Pump and energy optimisation attracts attention wherever electricity prices are volatile, since pumping dominates utility energy use.
By Application: Drinking Water Networks Hold the Largest Share as Wastewater Monitoring Accelerates
Drinking Water Networks held 58% share in 2026, because potable supply carries the metering base, the public health obligations and the loss economics that justify instrumentation. Every connection is a billable point, so the data has direct financial value. Wastewater and Stormwater is the fastest-growing application at a 12.6% CAGR, driven by sewer overflow detection and discharge reporting duties under the recast EU Urban Wastewater Treatment Directive and comparable national requirements, and by public pressure over river and bathing water quality. Industrial and process water grows steadily as manufacturers with water-intensive operations instrument their own abstraction and discharge. The business implication is that vendors built purely around potable metering now need credible level, flow and quality monitoring for collection networks, where the sensing environment is far harsher and maintenance costs are higher.
By End User: Municipal Utilities Anchor the Market While Industrial Users Grow Faster
Municipal Water Utilities anchored the market with 63% share in 2026, because public operators own most of the pipe, most of the meters and almost all the regulatory obligations. Their procurement is slow but their installed base is irreplaceable. Industrial and Commercial Users form the fastest-growing group at a 12.4% CAGR, as semiconductor, food and beverage, mining, data centre and chemical operators instrument process water to cut abstraction costs and meet corporate water targets, often framed around ISO 46001 water efficiency management. Private and investor-owned utilities adopt faster than municipal peers because regulated returns reward measurable efficiency. Agriculture and irrigation districts remain lightly instrumented despite consuming the most water, limited by plot fragmentation and low willingness to pay. For vendors, industrial accounts offer shorter sales cycles and better margins than municipal tenders.
Geography Analysis
Which Region Leads the Smart Water Management Market?
North America leads the smart water management market with 32% share in 2026 and a forecast 9.6% CAGR through 2033. The United States accounts for most of it, where the Safe Drinking Water Act framework, the Lead and Copper Rule Improvements with their service line inventory requirement, and the America’s Water Infrastructure Act risk and resilience obligation have forced utilities to document assets they had never catalogued. That inventory work pulls through metering, mapping and asset management systems. Canada adds steady municipal demand. Growth is below the global average because the market is mature and because roughly fifty thousand separate community water systems make procurement slow and costly to serve. The change underway is federal and state funding channelled through revolving funds, which is putting advanced metering within reach of mid-sized utilities for the first time.
Europe Turns Recast Water Directives Into Mandatory Instrumentation Programmes
Europe held 29% share in 2026 with a forecast 10.8% CAGR, the most regulation-driven market of the five. The recast EU Drinking Water Directive obliges member states to assess water loss levels and apply a risk-based approach across supply, while the recast EU Urban Wastewater Treatment Directive sets monitoring duties and energy-neutrality expectations for treatment operators. The United Kingdom, Germany, France, Italy and Spain drive spending, with British water companies under intense public and regulatory scrutiny over storm overflows and leakage targets. PFAS limits in drinking water are adding quality monitoring budgets. The barrier is the sheer number of small municipal operators in central and southern Europe. The opportunity sits in overflow monitoring and energy optimisation at treatment works, where compliance and operating cost reduction point the same way.
Asia Pacific Scales Smart Water Through Urban Utility Reform and Loss Reduction Targets
Asia Pacific held 24% share in 2026 and is forecast to grow at a 12.5% CAGR. China, India, Japan, Australia and Singapore lead, though for different reasons. Chinese and Indian urban utilities are under national programmes to cut distribution losses and move to continuous metered supply, which makes district metering and bulk flow measurement the priority. Japan faces an ageing network with a shrinking workforce, so remote monitoring substitutes for staff. Australia instruments heavily because drought cycles make every stored litre valuable, and Singapore operates one of the most comprehensively monitored networks anywhere. The constraint is tariff levels that stay far below cost recovery in several large markets. The opportunity lies in industrial users, where manufacturers increasingly pay for water efficiency that public utilities cannot yet fund.
Latin America Advances Smart Water Where Utility Losses Are Highest
Latin America represented 6% share in 2026 with an 11.0% CAGR forecast. Brazil, Chile, Mexico and Colombia lead, and the regional driver is unusually direct: distribution losses in many systems exceed forty percent, so even partial recovery changes a utility’s finances. Chilean private concessions and Brazilian sanitation sector reform have created operators with the balance sheet and the regulatory incentive to invest in metering and pressure management. The barriers are severe: constrained tariffs, currency risk on imported hardware, intermittent supply that makes continuous metering difficult, and unauthorised connections that no sensor can resolve. Development bank financing is the main funding route. The change worth watching is performance-based contracting, where a service provider is paid from the water it recovers rather than from an upfront capital budget.
Which Region Is Growing Fastest in the Smart Water Management Market?
Middle East & Africa is growing fastest in the smart water management market, at a 14.2% CAGR from 9% share in 2026. Saudi Arabia, the United Arab Emirates, Qatar, Israel and South Africa drive it, and water scarcity policy is the reason. Where supply comes from desalination, every cubic metre carries a high energy cost, so a leak is far more expensive than in a rainfall-fed system and full network instrumentation is justified from day one. Gulf national water strategies set explicit loss reduction and efficiency targets, and new districts are built with smart meters already fitted rather than retrofitted. South Africa invests under sustained drought and municipal loss pressure. The barriers are weak municipal capacity and maintenance funding across much of the continent, which keeps adoption concentrated in a few well-funded national utilities.
Competitive Landscape
The smart water management market is moderately concentrated at the top and highly fragmented below it. A handful of firms — including Xylem Inc., Itron, Inc., Badger Meter, Inc., Siemens AG and Veolia Environnement S.A. — combine metering, instrumentation, software and services at a scale that suits national utility programmes. Beneath them sit hundreds of regional meter manufacturers, sensor specialists, leak detection firms and software houses, many serving a single country. Fragmentation on the customer side reinforces fragmentation on the supply side, because thousands of small utilities buy locally and prize an engineer who can attend site.
Competition turns on a specific set of factors. Accuracy and service life matter most in metering, since a utility expects fifteen years from an installed asset and cannot afford field failures. Communications choice is the second factor, with long-range low-power networks, cellular and fixed networks each suiting different densities. The third is integration with billing, customer information and geographic information systems, which often decides a tender. The fourth is demonstrated non-revenue water reduction, increasingly tested through pilot districts before any award. New entrants arrive from satellite and acoustic analytics, offering leak localisation as a service with no hardware purchase.
Strategically, hardware manufacturers have moved deliberately toward software and recurring revenue, because meter sales alone are cyclical and exposed to utility capital cycles. Instrumentation and automation groups have extended from treatment plant control into network-wide monitoring and digital twin platforms. Water service operators have packaged their own operational analytics for sale to third-party utilities. Across all of them, the common direction is outcome-based contracting, where the vendor carries part of the performance risk on water or energy saved, and a growing emphasis on securing the control systems that these connected networks depend on.
Smart Water Management Industry Leaders
- Xylem Inc.
- Itron, Inc.
- Badger Meter, Inc.
- Siemens AG
- Veolia Environnement S.A.
Recent Industry Developments
April 2024: The United States Environmental Protection Agency finalised the first national drinking water standards for PFAS – it created a long-term monitoring, sampling and treatment reporting obligation for thousands of water systems.
May 2024: The United States Environmental Protection Agency issued an enforcement alert on cybersecurity vulnerabilities in drinking water systems – it put utility control system security on operations budgets rather than leaving it to information technology teams.
October 2024: The United States Environmental Protection Agency finalised the Lead and Copper Rule Improvements, including service line inventory and replacement duties – asset data quality became a regulatory requirement, pulling through mapping and asset management systems.
January 2025: The recast EU Urban Wastewater Treatment Directive entered into force – its monitoring and energy-neutrality requirements turned storm overflow and treatment works instrumentation into compliance infrastructure.
January 2026: The deadline passed for member states to complete water leakage assessments under the recast EU Drinking Water Directive – it obliged utilities to quantify losses they had previously estimated, accelerating district metering programmes.
Smart Water Management Market Report Scope
| Metric | Value |
| Study Period | 2020–2033 |
| Market Size 2026 | US$ 21.8 Billion |
| Market Size 2033 | US$ 45.2 Billion |
| CAGR 2026–2033 | 11.0% |
| Absolute Dollar Opportunity | US$ 23.4 Billion |
| Largest Market | North America (32% share in 2026) |
| Fastest-Growing Market | Middle East & Africa (14.2% CAGR) |
| Market Concentration | Medium |
| Major Players | Xylem Inc., Itron, Inc., Badger Meter, Inc., Siemens AG |
This report covers the technology layer serving water and wastewater utilities and large industrial water users: smart meters and advanced metering infrastructure, sensors, leak detection, SCADA and telemetry, hydraulic modelling, asset management, wastewater monitoring, meter data management and related services. Pipes, pumps, treatment plant construction and civil works are excluded. It is one domain within the wider smart cities market, examined here in its own right. The base year is 2025, with a forecast period of 2026 to 2033 in US$ Billion.
Smart Water Management Market Segmentation
Component
- Hardware
- Software
- Services
Solution
- Smart Water Meters and Advanced Metering Infrastructure
- Leak Detection and Non-Revenue Water Management
- SCADA and Remote Telemetry
- Network Modelling and Hydraulic Digital Twins
- Water Quality Monitoring
- Pump and Energy Optimisation
- Asset Management and Condition Monitoring
- Wastewater and Stormwater Monitoring
- Meter Data Management and Customer Engagement
Application
- Drinking Water Networks
- Wastewater and Stormwater
- Industrial and Process Water
End User
- Municipal Water Utilities
- Private and Investor-Owned Utilities
- Industrial and Commercial Users
- Agriculture and Irrigation Districts
Regions
- North America
- Europe
- Asia Pacific
- Latin America
- Middle East & Africa
- Executive Summary
- Global Smart Water Management Market Snapshot
- Future Projections
- Key Report Takeaways
- Regional Snapshot
- Market Overview
- Market Definition and Report Scope
- Historical Trends 2020–2025
- Market Dynamics
- Drivers
- Non-Revenue Water Losses Give Utility Boards the Only Payback Case That Clears
- Recast European Water Directives Make Leakage and Overflow Monitoring a Statutory Duty
- Restraints
- Fragmentation Across Thousands of Small Utilities Blocks Smart Water Procurement
- Tariff-Constrained Capital and Long Asset Lives Delay Meter and Sensor Replacement
- Market Opportunities
- Advanced Metering Infrastructure Rollouts Create a Recurring Meter Data and Analytics Pool
- Water System Cybersecurity and Resilience Services Open a New Utility Budget Line
- Drivers
- Global Smart Water Management Market Outlook, 2020–2033
- Global Smart Water Management Market Outlook, by Component, Value (US$ Billion), 2020–2033
- Hardware
- Software
- Services
- Global Smart Water Management Market Outlook, by Solution, Value (US$ Billion), 2020–2033
- Smart Water Meters and Advanced Metering Infrastructure
- Leak Detection and Non-Revenue Water Management
- SCADA and Remote Telemetry
- Network Modelling and Hydraulic Digital Twins
- Water Quality Monitoring
- Pump and Energy Optimisation
- Asset Management and Condition Monitoring
- Wastewater and Stormwater Monitoring
- Meter Data Management and Customer Engagement
- Global Smart Water Management Market Outlook, by Application, Value (US$ Billion), 2020–2033
- Drinking Water Networks
- Wastewater and Stormwater
- Industrial and Process Water
- Global Smart Water Management Market Outlook, by End User, Value (US$ Billion), 2020–2033
- Municipal Water Utilities
- Private and Investor-Owned Utilities
- Industrial and Commercial Users
- Agriculture and Irrigation Districts
- Global Smart Water Management Market Outlook, by Region, Value (US$ Billion), 2020–2033
- North America
- Europe
- Asia Pacific
- Latin America
- Middle East & Africa
- Global Smart Water Management Market Outlook, by Component, Value (US$ Billion), 2020–2033
- North America Smart Water Management Market Outlook, 2020–2033
- North America Smart Water Management Market Outlook, by Component, Value (US$ Billion), 2020–2033
- Hardware
- Software
- Services
- North America Smart Water Management Market Outlook, by Solution, Value (US$ Billion), 2020–2033
- Smart Water Meters and Advanced Metering Infrastructure
- Leak Detection and Non-Revenue Water Management
- SCADA and Remote Telemetry
- Network Modelling and Hydraulic Digital Twins
- Water Quality Monitoring
- Pump and Energy Optimisation
- Asset Management and Condition Monitoring
- Wastewater and Stormwater Monitoring
- Meter Data Management and Customer Engagement
- North America Smart Water Management Market Outlook, by Application, Value (US$ Billion), 2020–2033
- Drinking Water Networks
- Wastewater and Stormwater
- Industrial and Process Water
- North America Smart Water Management Market Outlook, by End User, Value (US$ Billion), 2020–2033
- Municipal Water Utilities
- Private and Investor-Owned Utilities
- Industrial and Commercial Users
- Agriculture and Irrigation Districts
- North America Smart Water Management Market Outlook, by Country, Value (US$ Billion), 2020–2033
- United States Smart Water Management Market Outlook, by Component, 2020–2033
- United States Smart Water Management Market Outlook, by Solution, 2020–2033
- United States Smart Water Management Market Outlook, by Application, 2020–2033
- United States Smart Water Management Market Outlook, by End User, 2020–2033
- Canada Smart Water Management Market Outlook, by Component, 2020–2033
- Canada Smart Water Management Market Outlook, by Solution, 2020–2033
- Canada Smart Water Management Market Outlook, by Application, 2020–2033
- Canada Smart Water Management Market Outlook, by End User, 2020–2033
- North America Smart Water Management Market Outlook, by Component, Value (US$ Billion), 2020–2033
- Europe Smart Water Management Market Outlook, 2020–2033
- Europe Smart Water Management Market Outlook, by Component, Value (US$ Billion), 2020–2033
- Hardware
- Software
- Services
- Europe Smart Water Management Market Outlook, by Solution, Value (US$ Billion), 2020–2033
- Smart Water Meters and Advanced Metering Infrastructure
- Leak Detection and Non-Revenue Water Management
- SCADA and Remote Telemetry
- Network Modelling and Hydraulic Digital Twins
- Water Quality Monitoring
- Pump and Energy Optimisation
- Asset Management and Condition Monitoring
- Wastewater and Stormwater Monitoring
- Meter Data Management and Customer Engagement
- Europe Smart Water Management Market Outlook, by Application, Value (US$ Billion), 2020–2033
- Drinking Water Networks
- Wastewater and Stormwater
- Industrial and Process Water
- Europe Smart Water Management Market Outlook, by End User, Value (US$ Billion), 2020–2033
- Municipal Water Utilities
- Private and Investor-Owned Utilities
- Industrial and Commercial Users
- Agriculture and Irrigation Districts
- Europe Smart Water Management Market Outlook, by Country, Value (US$ Billion), 2020–2033
- United Kingdom Smart Water Management Market Outlook, by Component, 2020–2033
- United Kingdom Smart Water Management Market Outlook, by Solution, 2020–2033
- United Kingdom Smart Water Management Market Outlook, by Application, 2020–2033
- United Kingdom Smart Water Management Market Outlook, by End User, 2020–2033
- Germany Smart Water Management Market Outlook, by Component, 2020–2033
- Germany Smart Water Management Market Outlook, by Solution, 2020–2033
- Germany Smart Water Management Market Outlook, by Application, 2020–2033
- Germany Smart Water Management Market Outlook, by End User, 2020–2033
- France Smart Water Management Market Outlook, by Component, 2020–2033
- France Smart Water Management Market Outlook, by Solution, 2020–2033
- France Smart Water Management Market Outlook, by Application, 2020–2033
- France Smart Water Management Market Outlook, by End User, 2020–2033
- Italy Smart Water Management Market Outlook, by Component, 2020–2033
- Italy Smart Water Management Market Outlook, by Solution, 2020–2033
- Italy Smart Water Management Market Outlook, by Application, 2020–2033
- Italy Smart Water Management Market Outlook, by End User, 2020–2033
- Spain Smart Water Management Market Outlook, by Component, 2020–2033
- Spain Smart Water Management Market Outlook, by Solution, 2020–2033
- Spain Smart Water Management Market Outlook, by Application, 2020–2033
- Spain Smart Water Management Market Outlook, by End User, 2020–2033
- Europe Smart Water Management Market Outlook, by Component, Value (US$ Billion), 2020–2033
- Asia Pacific Smart Water Management Market Outlook, 2020–2033
- Asia Pacific Smart Water Management Market Outlook, by Component, Value (US$ Billion), 2020–2033
- Hardware
- Software
- Services
- Asia Pacific Smart Water Management Market Outlook, by Solution, Value (US$ Billion), 2020–2033
- Smart Water Meters and Advanced Metering Infrastructure
- Leak Detection and Non-Revenue Water Management
- SCADA and Remote Telemetry
- Network Modelling and Hydraulic Digital Twins
- Water Quality Monitoring
- Pump and Energy Optimisation
- Asset Management and Condition Monitoring
- Wastewater and Stormwater Monitoring
- Meter Data Management and Customer Engagement
- Asia Pacific Smart Water Management Market Outlook, by Application, Value (US$ Billion), 2020–2033
- Drinking Water Networks
- Wastewater and Stormwater
- Industrial and Process Water
- Asia Pacific Smart Water Management Market Outlook, by End User, Value (US$ Billion), 2020–2033
- Municipal Water Utilities
- Private and Investor-Owned Utilities
- Industrial and Commercial Users
- Agriculture and Irrigation Districts
- Asia Pacific Smart Water Management Market Outlook, by Country, Value (US$ Billion), 2020–2033
- China Smart Water Management Market Outlook, by Component, 2020–2033
- China Smart Water Management Market Outlook, by Solution, 2020–2033
- China Smart Water Management Market Outlook, by Application, 2020–2033
- China Smart Water Management Market Outlook, by End User, 2020–2033
- India Smart Water Management Market Outlook, by Component, 2020–2033
- India Smart Water Management Market Outlook, by Solution, 2020–2033
- India Smart Water Management Market Outlook, by Application, 2020–2033
- India Smart Water Management Market Outlook, by End User, 2020–2033
- Japan Smart Water Management Market Outlook, by Component, 2020–2033
- Japan Smart Water Management Market Outlook, by Solution, 2020–2033
- Japan Smart Water Management Market Outlook, by Application, 2020–2033
- Japan Smart Water Management Market Outlook, by End User, 2020–2033
- Australia Smart Water Management Market Outlook, by Component, 2020–2033
- Australia Smart Water Management Market Outlook, by Solution, 2020–2033
- Australia Smart Water Management Market Outlook, by Application, 2020–2033
- Australia Smart Water Management Market Outlook, by End User, 2020–2033
- Singapore Smart Water Management Market Outlook, by Component, 2020–2033
- Singapore Smart Water Management Market Outlook, by Solution, 2020–2033
- Singapore Smart Water Management Market Outlook, by Application, 2020–2033
- Singapore Smart Water Management Market Outlook, by End User, 2020–2033
- Asia Pacific Smart Water Management Market Outlook, by Component, Value (US$ Billion), 2020–2033
- Latin America Smart Water Management Market Outlook, 2020–2033
- Latin America Smart Water Management Market Outlook, by Component, Value (US$ Billion), 2020–2033
- Hardware
- Software
- Services
- Latin America Smart Water Management Market Outlook, by Solution, Value (US$ Billion), 2020–2033
- Smart Water Meters and Advanced Metering Infrastructure
- Leak Detection and Non-Revenue Water Management
- SCADA and Remote Telemetry
- Network Modelling and Hydraulic Digital Twins
- Water Quality Monitoring
- Pump and Energy Optimisation
- Asset Management and Condition Monitoring
- Wastewater and Stormwater Monitoring
- Meter Data Management and Customer Engagement
- Latin America Smart Water Management Market Outlook, by Application, Value (US$ Billion), 2020–2033
- Drinking Water Networks
- Wastewater and Stormwater
- Industrial and Process Water
- Latin America Smart Water Management Market Outlook, by End User, Value (US$ Billion), 2020–2033
- Municipal Water Utilities
- Private and Investor-Owned Utilities
- Industrial and Commercial Users
- Agriculture and Irrigation Districts
- Latin America Smart Water Management Market Outlook, by Country, Value (US$ Billion), 2020–2033
- Brazil Smart Water Management Market Outlook, by Component, 2020–2033
- Brazil Smart Water Management Market Outlook, by Solution, 2020–2033
- Brazil Smart Water Management Market Outlook, by Application, 2020–2033
- Brazil Smart Water Management Market Outlook, by End User, 2020–2033
- Chile Smart Water Management Market Outlook, by Component, 2020–2033
- Chile Smart Water Management Market Outlook, by Solution, 2020–2033
- Chile Smart Water Management Market Outlook, by Application, 2020–2033
- Chile Smart Water Management Market Outlook, by End User, 2020–2033
- Mexico Smart Water Management Market Outlook, by Component, 2020–2033
- Mexico Smart Water Management Market Outlook, by Solution, 2020–2033
- Mexico Smart Water Management Market Outlook, by Application, 2020–2033
- Mexico Smart Water Management Market Outlook, by End User, 2020–2033
- Colombia Smart Water Management Market Outlook, by Component, 2020–2033
- Colombia Smart Water Management Market Outlook, by Solution, 2020–2033
- Colombia Smart Water Management Market Outlook, by Application, 2020–2033
- Colombia Smart Water Management Market Outlook, by End User, 2020–2033
- Latin America Smart Water Management Market Outlook, by Component, Value (US$ Billion), 2020–2033
- Middle East & Africa Smart Water Management Market Outlook, 2020–2033
- Middle East & Africa Smart Water Management Market Outlook, by Component, Value (US$ Billion), 2020–2033
- Hardware
- Software
- Services
- Middle East & Africa Smart Water Management Market Outlook, by Solution, Value (US$ Billion), 2020–2033
- Smart Water Meters and Advanced Metering Infrastructure
- Leak Detection and Non-Revenue Water Management
- SCADA and Remote Telemetry
- Network Modelling and Hydraulic Digital Twins
- Water Quality Monitoring
- Pump and Energy Optimisation
- Asset Management and Condition Monitoring
- Wastewater and Stormwater Monitoring
- Meter Data Management and Customer Engagement
- Middle East & Africa Smart Water Management Market Outlook, by Application, Value (US$ Billion), 2020–2033
- Drinking Water Networks
- Wastewater and Stormwater
- Industrial and Process Water
- Middle East & Africa Smart Water Management Market Outlook, by End User, Value (US$ Billion), 2020–2033
- Municipal Water Utilities
- Private and Investor-Owned Utilities
- Industrial and Commercial Users
- Agriculture and Irrigation Districts
- Middle East & Africa Smart Water Management Market Outlook, by Country, Value (US$ Billion), 2020–2033
- Saudi Arabia Smart Water Management Market Outlook, by Component, 2020–2033
- Saudi Arabia Smart Water Management Market Outlook, by Solution, 2020–2033
- Saudi Arabia Smart Water Management Market Outlook, by Application, 2020–2033
- Saudi Arabia Smart Water Management Market Outlook, by End User, 2020–2033
- United Arab Emirates Smart Water Management Market Outlook, by Component, 2020–2033
- United Arab Emirates Smart Water Management Market Outlook, by Solution, 2020–2033
- United Arab Emirates Smart Water Management Market Outlook, by Application, 2020–2033
- United Arab Emirates Smart Water Management Market Outlook, by End User, 2020–2033
- Qatar Smart Water Management Market Outlook, by Component, 2020–2033
- Qatar Smart Water Management Market Outlook, by Solution, 2020–2033
- Qatar Smart Water Management Market Outlook, by Application, 2020–2033
- Qatar Smart Water Management Market Outlook, by End User, 2020–2033
- Israel Smart Water Management Market Outlook, by Component, 2020–2033
- Israel Smart Water Management Market Outlook, by Solution, 2020–2033
- Israel Smart Water Management Market Outlook, by Application, 2020–2033
- Israel Smart Water Management Market Outlook, by End User, 2020–2033
- South Africa Smart Water Management Market Outlook, by Component, 2020–2033
- South Africa Smart Water Management Market Outlook, by Solution, 2020–2033
- South Africa Smart Water Management Market Outlook, by Application, 2020–2033
- South Africa Smart Water Management Market Outlook, by End User, 2020–2033
- Middle East & Africa Smart Water Management Market Outlook, by Component, Value (US$ Billion), 2020–2033
- Competitive Landscape
- Market Concentration and Industry Leaders
- Competitive Differentiation
- Strategic Moves and Market Direction
- Recent Industry Developments
- Company Profiles
- Xylem Inc.
- Itron, Inc.
- Badger Meter, Inc.
- Kamstrup A/S
- Diehl Metering
- Mueller Water Products, Inc.
- Bentley Systems, Incorporated
- Siemens AG
- Schneider Electric SE
- ABB Ltd
- Honeywell International Inc.
- Veolia Environnement S.A.
- SUEZ
- Appendix
- Research Methodology
- Report Assumptions
- Acronyms and Abbreviations
Component
- Hardware
- Software
- Services
Solution
- Smart Water Meters and Advanced Metering Infrastructure
- Leak Detection and Non-Revenue Water Management
- SCADA and Remote Telemetry
- Network Modelling and Hydraulic Digital Twins
- Water Quality Monitoring
- Pump and Energy Optimisation
- Asset Management and Condition Monitoring
- Wastewater and Stormwater Monitoring
- Meter Data Management and Customer Engagement
Application
- Drinking Water Networks
- Wastewater and Stormwater
- Industrial and Process Water
End User
- Municipal Water Utilities
- Private and Investor-Owned Utilities
- Industrial and Commercial Users
- Agriculture and Irrigation Districts
Regions
- North America
- Europe
- Asia Pacific
- Latin America
- Middle East & Africa
Our Research Methodology
Considering the volatility of business today, traditional approaches to strategizing a game plan can be unfruitful if not detrimental. True ambiguity is no way to determine a forecast. A myriad of predetermined factors must be accounted for such as the degree of risk involved, the magnitude of circumstances, as well as conditions or consequences that are not known or unpredictable. To circumvent binary views that cast uncertainty, the application of market research intelligence to strategically posture, move, and enable actionable outcomes is necessary.
View Methodology
Quality Assured
Rigorous Validation Process

Confidentiality Assured
End-to-end Data Security

Custom Research Services
Tailored To Your Objectives
FAQs
The smart water management market is valued at US$ 21.8 billion in 2026, covering hardware, software and services in the water technology layer.
The market is projected to reach US$ 45.2 billion by 2033, growing at an 11.0% CAGR and adding US$ 23.4 billion in absolute opportunity.
Smart Water Meters and Advanced Metering Infrastructure holds 34% share in 2026, because metering improves billing accuracy and makes distribution losses visible.
Middle East & Africa is growing fastest at a 14.2% CAGR through 2033, driven by water scarcity policy and the high cost of desalinated supply.
Concentration is medium: a few diversified metering and instrumentation groups lead, while hundreds of regional sensor, meter and software specialists compete locally.
Related Reports
Malware Analysis Market Size, Share, Insights, Competitive Landscape, and Forecast 2026 to 2033
Explore the malware analysis market, reaching US$ 21.0 billion by 2033 at 14.0% CAGR, with component, deployment and regional insights.
Language Translation Device Market Size, Share, Insights, Competitive Landscape, and Forecast 2026 to 2033
Explore the language translation device market, reaching US$ 3.43 billion by 2033 at 11.9% CAGR, with product, application and regional insights.
Infusion Pump Software Market Size, Share, Insights, Competitive Landscape, and Forecast 2026 to 2033
Explore the infusion pump software market, reaching US$ 2.4 billion by 2033 at 10.4% CAGR, with software, regional and competitive insights.
Database Security Market Size, Share, Insights, Competitive Landscape, and Forecast 2026 to 2033
Explore the database security market, reaching US$ 28.5 billion by 2033 at 14.3% CAGR, with offering, regional and competitive insights.
Smart Home Appliances Market Size, Share, Insights, Competitive Landscape, and Forecast 2026 to 2033
Explore the smart home appliances market, reaching US$ 113.0 billion by 2033 at 13.0% CAGR, with product, regional and competitive insights.
Smart Cities Market Size, Share, Insights, Competitive Landscape, and Forecast 2026 to 2033
Explore the smart cities market, reaching US$ 420.0 billion by 2033 at 12.7% CAGR, with solution, regional and competitive insights.