



Tank Mix Adjuvants Market
Tank Mix Adjuvants Market Size, Share, Insights, Competitive Landscape, and Forecast 2026 to 2033
Tank Mix Adjuvants Market Size and Trend Analysis
What Is Driving Tank Mix Adjuvant Demand Through 2033?
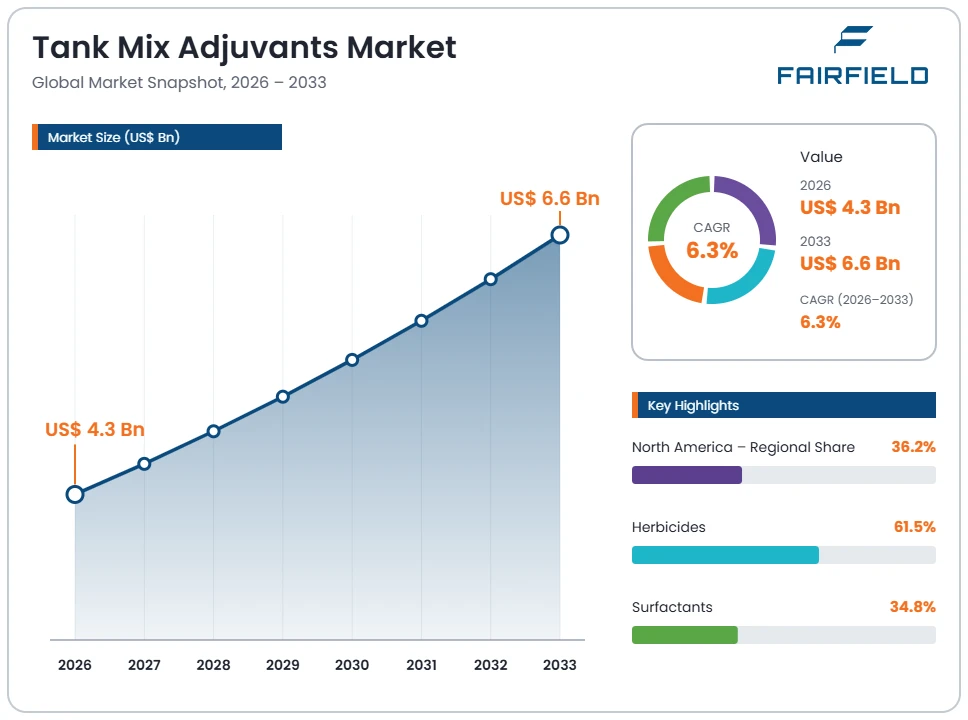
The global tank mix adjuvants market size is expected to be valued at US$ 4.3 billion in 2026 and projected to reach US$ 6.6 billion by 2033, growing at a CAGR of 6.3% between 2026 and 2033.
Sales grew at close to a 5.4% CAGR between 2020 and 2025, tracking planted area and herbicide application volumes rather than farm machinery cycles. Three forces carry the forecast. Herbicide-resistant weeds have made multi-mode tank mixes routine, and every added active ingredient raises the need for compatibility and water-conditioning products. Pesticide labels in the United States increasingly specify which adjuvants may be used, converting a discretionary purchase into a compliance requirement. Soybean, maize and sugarcane area in Brazil and Argentina keeps expanding spray volumes. The direction is steady, area-linked growth with a slow mix shift from basic surfactants toward drift retardants, deposition aids and water conditioners carrying higher value per hectare.
Key Report Takeaways
- By Product Type: Surfactants held 34.8% share in 2026, while drift retardants and deposition aids are projected to expand at a 7.4% CAGR through 2033, driven by label-mandated drift management on auxin herbicide applications.
- By Application: Herbicides held 61.5% share in 2026, while fungicides are projected to expand at a 6.6% CAGR through 2033, as foliar disease programmes in cereals and soybean demand better canopy coverage and droplet retention.
- By Crop Type: Oilseeds and pulses held 38.4% share in 2026, while fruits and vegetables are projected to expand at a 6.9% CAGR through 2033, supported by residue-sensitive spray programmes needing precise deposition.
- By Source: Synthetic adjuvants held 72.6% share in 2026, while bio-based adjuvants are projected to expand at an 8.2% CAGR through 2033, helped by co-formulant scrutiny under Regulation (EC) No 1107/2009 in the European Union.
- By Geography: North America held 36.2% share in 2026, while Latin America is projected to expand at a 7.9% CAGR through 2033, on continued cropland expansion and multiple spray passes per season in Brazil.
Global Tank Mix Adjuvants Market Trends and Insights
Drivers Impact Analysis
Two forces explain most of the forecast growth in spray tank additives.
| Driver | Impact on CAGR Forecast | Geographic Relevance | Impact Timeline |
| Label-mandated adjuvant lists for auxin herbicide systems | High | North America, Latin America | Short term (≤2 years) |
| Herbicide-resistant weeds forcing multi-mode tank mixes | High | North America, Latin America, Asia Pacific | Medium term (2–4 years) |
Mandatory Approved Adjuvant Lists for Auxin Herbicides Convert Tank Mix Additives Into a Compliance Purchase
Label requirements have turned adjuvant selection into a legal obligation on a large share of row-crop area. Herbicide registrations for over-the-top dicamba and 2,4-D choline use on tolerant soybean and cotton restrict applicators to tank-mix partners, nozzles and adjuvants named on lists maintained by the registrant and the regulator. Growers who deviate risk label violation, so purchase of a listed product becomes automatic.
The mechanism is enforcement rather than agronomy. The US Environmental Protection Agency attaches drift-management conditions to these registrations, and state lead agencies add their own approved tank-mix adjuvant lists tied to specific registrations. Volatility-reducing agents and drift retardants entered the mix for this reason alone. Listing creates a qualified supplier set, lifts the attach rate per sprayed hectare and shifts value from commodity surfactants toward specialised deposition and drift-control chemistry.
Herbicide-Resistant Weeds Push Growers Toward Multi-Mode Tank Mixes That Need More Adjuvant Volume
Resistance management raises adjuvant consumption per hectare. Glyphosate-resistant Amaranthus palmeri, Conyza species and Lolium populations have forced growers to mix two or three herbicide modes of action in a single pass. Each additional active ingredient brings its own solubility, pH and compatibility needs, which growers resolve with compatibility agents, buffering agents, defoamers and oil adjuvants.
The causal chain starts in the spray tank. Hard carrier water rich in calcium and magnesium antagonises weak-acid herbicides, so ammonium sulphate and other water conditioners are added before the active ingredient. Methylated seed oils and crop oil concentrates improve cuticle penetration for the contact and residual partners now used alongside glyphosate. Integrated pest management guidance under Directive 2009/128/EC and extension services in the United States and Brazil both reinforce rotation of modes of action.
Restraints Impact Analysis
Two structural issues hold back pricing power and grower confidence in adjuvant purchases.
| Restraint | Impact on CAGR Forecast | Geographic Relevance | Impact Timeline |
| Unregistered status of adjuvants and resulting quality variability | High | North America, Asia Pacific, Latin America | Long term (≥4 years) |
| Feedstock price volatility in alkoxylates and methylated seed oils | Medium | Europe, Asia Pacific | Short term (≤2 years) |
Unregistered Inert Ingredient Status Leaves Adjuvant Quality Unverified and Caps Grower Willingness to Pay
Most tank mix adjuvants are not registered pesticides, which weakens the quality signal growers rely on. The US Environmental Protection Agency regulates adjuvant components largely as inert ingredients, listed for permitted use in pesticide formulations rather than approved for efficacy. No federal efficacy review applies, and label claims are not verified before sale. Growers facing shelves of similar products default to the cheapest option, which compresses margins for suppliers who do invest in testing.
The cause sits in the regulatory design. Inert ingredient clearances address residue tolerance and exposure, not field performance, so two products with identical label language can differ widely in active surfactant content. State approved-product lists cover only specific herbicide registrations and leave the broader category untouched. Private certification programmes and state agricultural departments fill part of the gap, but coverage is partial and voluntary.
Petrochemical and Vegetable Oil Feedstock Swings Squeeze Adjuvant Formulator Margins
Input cost volatility erodes profitability across the adjuvant supply chain. Non-ionic surfactants depend on ethylene oxide and alcohol ethoxylates, while crop oil concentrates and methylated seed oils depend on soybean, canola and rapeseed oil. Both input families moved sharply during recent energy and vegetable oil cycles, and formulators selling into an annual farm purchasing calendar cannot reprice mid-season.
The specific cost sources are identifiable. Ethylene oxide capacity is concentrated and tied to naphtha and ethane economics, so surfactant pricing follows petrochemical swings. Vegetable oil methyl esters compete directly with biodiesel demand, which lifts feedstock prices whenever renewable fuel mandates tighten. Freight and drum packaging add further exposure for bulky, low-value-density liquids shipped to rural outlets. Distributors holding season-ahead inventory absorb much of the swing, which discourages stocking of premium formulations and narrows the range offered to growers.
Market Opportunities
Two revenue pools sit outside the commodity surfactant core of the category.
Bio-Based Adjuvants Open a Compliance-Driven Revenue Pool in Residue-Sensitive Crops
Plant-derived adjuvant chemistry is becoming a separate, higher-value product tier. Co-formulant scrutiny under Regulation (EC) No 1107/2009 has narrowed the list of acceptable substances in plant protection products in the European Union, and growers supplying retailers with residue specifications want the same assurance in their adjuvants. That creates demand for products built on plant oils, sugar esters, lecithin and alkyl polyglucosides.
Specialty chemical producers and oleochemical processors are positioned to capture it. The demand comes from fruit, vegetable and vine growers in Spain, Italy, the Netherlands and Chile who sell into supermarket schemes with tight residue and ingredient rules, and from organic-adjacent production where permitted input lists govern purchasing. Supporting this shift is wider availability of methyl ester and glucoside capacity, which has narrowed the cost gap against conventional alkoxylated surfactants.
Drift-Reduction and Deposition Chemistry Tied to Precision Spraying Creates a New Per-Hectare Revenue Stream
Drift management has become a product category rather than a nozzle setting. The US Environmental Protection Agency operates a voluntary Drift Reduction Technology programme that lets verified low-drift technologies be identified on pesticide labels, and drift statements now appear on most herbicide labels. Adjuvants that measurably shift droplet spectra away from fine droplets can be sold on that evidence at a premium per hectare.
Formulators with polymer and emulsion capability can take this pool, together with distributors bundling adjuvants with nozzles and application advice. Demand comes from large row-crop operators in the United States, Brazil and Australia running auxin-tolerant systems next to sensitive crops. Targeted spraying equipment that treats only detected weeds supports the shift, since smaller spray volumes make droplet retention and deposition efficiency decisive. ISO 22866 gives a recognised field measurement method for substantiating drift performance.
Segment Analysis
- By Product Type: Surfactants Hold the Base While Drift Retardants and Deposition Aids Climb Fastest
Surfactants lead the product mix with 34.8% share in 2026, because wetting and spreading agents are required with almost every foliar herbicide, insecticide and fungicide application. Their position rests on low unit cost, universal label compatibility and a mature supply base in alcohol ethoxylates and organosilicones. Drift retardants and deposition aids are the fastest-growing product type at a 7.4% CAGR to 2033, pulled by auxin herbicide labels that require drift management and by the spread of targeted spraying equipment. Oil adjuvants, including crop oil concentrates and methylated seed oils, remain the second-largest group, while water conditioners and buffering agents grow steadily with hard-water carrier issues. Defoamers stay a small, functional category. The business implication is a gradual value shift away from commodity wetting agents toward chemistry that can be substantiated with field drift and deposition data.
- By Application: Herbicide Programmes Dominate Volume While Fungicide Use Expands Quickest
Herbicides account for 61.5% of adjuvant demand in 2026, reflecting the dominance of post-emergence weed control in soybean, maize, wheat and sugarcane. Glyphosate, glufosinate, dicamba and 2,4-D programmes all specify adjuvant partners, which makes the attach rate close to universal. Fungicides are the fastest-growing application at a 6.6% CAGR through 2033, as foliar disease programmes in cereals, soybean and specialty crops demand better canopy penetration and droplet retention on waxy leaves. Insecticide use contributes a stable share, and plant growth regulators and foliar micronutrients form a small but rising group. Supporting developments include finer nozzle selection guidance and integrated pest management rules that favour precise timing. For suppliers, the implication is that fungicide-specific deposition aids offer better margin than undifferentiated herbicide surfactants.
- By Crop Type: Oilseeds and Pulses Lead Acreage While Fruits and Vegetables Grow Faster
Oilseeds and pulses take 38.4% of adjuvant value in 2026, driven by vast soybean area in the United States, Brazil and Argentina where herbicide-tolerant systems need multiple spray passes per season. Canola in Canada and Australia adds further volume. Fruits and vegetables form the fastest-growing crop group at a 6.9% CAGR to 2033, because high-value horticulture justifies premium deposition aids and because residue limits in export markets push growers toward accurate, low-drift application. Cereals and grains remain the second-largest pool through wheat, maize and rice programmes. Other uses cover turf, pasture, ornamentals and vegetation management on rights of way. The practical consequence is a two-speed market: broadacre crops deliver tonnage at thin margins, while horticulture supports differentiated, lower-volume formulations at higher prices per litre.
- By Source: Synthetic Chemistry Dominates Supply While Bio-Based Products Gain Ground
Synthetic adjuvants hold 72.6% of the market in 2026, since alcohol ethoxylates, organosilicones, polyacrylamides and ammonium sulphate deliver predictable performance at the lowest cost per hectare. Established petrochemical supply chains and decades of compatibility data keep them the default on most labels. Bio-based adjuvants are the fastest-growing source at an 8.2% CAGR through 2033, as co-formulant scrutiny in the European Union, retailer residue schemes and grower preference for plant-derived inputs widen their use. Methylated seed oils, alkyl polyglucosides, lecithin and sugar esters lead that shift, supported by expanding oleochemical capacity. Performance parity is no longer the obstacle it once was in wetting and penetration. The implication for formulators is that a bio-based range is becoming a requirement for European registration dossiers and for horticultural customers rather than a marketing option.
Geography Analysis
- Which Region Is Leading the Tank Mix Adjuvants Market?
North America leads the tank mix adjuvants market with 36.2% share in 2026, growing at a 5.6% CAGR to 2033. The United States accounts for most of it, with large soybean, maize and cotton area sprayed several times each season under herbicide-tolerant cropping systems. Label conditions set by the US Environmental Protection Agency for auxin herbicides require approved tank-mix partners and drift management, which guarantees adjuvant purchase on those hectares. State lead agencies publish their own approved product lists, adding a second compliance layer. Canada contributes through canola and cereal programmes. The change shaping the region is litigation and re-registration uncertainty around over-the-top dicamba, which keeps growers switching between herbicide systems and the adjuvant packages that accompany them.
- Plant Protection Product Rules Make Europe a Compliance-Led Adjuvant Market
Europe holds 18.3% of global value in 2026 and grows at a slower 5.2% CAGR, constrained by the strictest input rules in the category. France, Germany, Spain, Italy and Poland lead consumption across cereals, oilseed rape, vines and vegetables. Regulation (EC) No 1107/2009 governs plant protection products and sets out how adjuvants and co-formulants are treated, with unacceptable co-formulants excluded from use. Directive 2009/128/EC requires integrated pest management practice and periodic sprayer inspection, which raises application quality and shifts demand toward drift and deposition products. Active substance withdrawals reduce total spray volume. The opportunity reshaping the region is bio-based adjuvant chemistry that fits co-formulant rules and residue schemes set by food retailers.
- Asia Pacific Adjuvant Demand Follows Rice, Smallholder Spraying and Drone Application
Asia Pacific represents 16.4% of global value in 2026 and grows at a 7.0% CAGR, the second-fastest regional pool. China, India, Japan, Australia and Viet Nam drive demand through rice, wheat, cotton, fruit and vegetable production. Smallholder spraying with knapsack and powered equipment favours low-cost surfactants and water conditioners, since carrier water quality varies widely between districts. Australia behaves differently, with broadacre cropping and severe Lolium rigidum resistance driving oil adjuvant and drift retardant use. Rapid adoption of agricultural spray drones in China, Japan and South Korea is the clearest change, because very low spray volumes make drift control, droplet size management and anti-evaporation additives essential rather than optional for effective coverage.
- Which Region Is Growing Fastest in the Tank Mix Adjuvants Market?
Latin America is the fastest-growing geography, expanding at a 7.9% CAGR from a 24.5% share in 2026. Brazil supplies most of the growth, with soybean, maize safrinha, sugarcane and cotton area supporting as many as eight to ten spray passes across a single cropping year. Argentina and Paraguay add soybean volume, and Colombia contributes through fruit and oil palm. Glyphosate-resistant Conyza and Amaranthus populations have pushed growers into multi-mode mixes needing compatibility agents and water conditioners. Barriers include currency volatility that raises imported surfactant costs, informal and counterfeit product circulating in rural distribution, and uneven technical advice. The opportunity is formal distributor programmes that pair verified adjuvants with agronomic support and application training.
- Middle East & Africa Adjuvant Use Concentrates in Irrigated and Export Horticulture
Middle East & Africa accounts for 4.6% of global value in 2026 with a 6.2% CAGR, the smallest regional pool. South Africa, Egypt, Morocco, Israel and Saudi Arabia lead usage, concentrated in irrigated cereals, citrus, table grapes and protected vegetable production aimed at export buyers. Those export programmes impose residue limits that reward accurate deposition and low drift. Barriers are considerable: limited local formulation capacity, dependence on imported surfactant intermediates, small average farm size outside commercial estates, and sparse extension advice on carrier water quality. Counterfeit crop protection products also undermine confidence in adjuvant claims. The clearest opportunity is water conditioning chemistry, since saline and highly alkaline irrigation water in much of the region degrades weak-acid herbicide performance.
Competitive Landscape
The tank mix adjuvants market is fragmented. Because most adjuvants are sold as inert-ingredient-based products rather than registered pesticides, barriers to entry are low, and hundreds of regional blenders operate alongside multinational chemical producers. Evonik Industries AG, Croda International Plc, Clariant AG, Stepan Company and Solvay S.A. supply surfactant and polymer intermediates, while Helena Agri-Enterprises, LLC, Wilbur-Ellis Company LLC, Precision Laboratories, LLC and Brandt Consolidated, Inc. formulate and sell finished products through agricultural retail. That two-tier structure keeps the finished-product side highly dispersed even where upstream chemistry is concentrated.
Competition runs on distribution access, technical support and demonstrable field data rather than brand. Agricultural retailers and cooperatives control the grower relationship, so shelf presence at the local outlet often decides the sale. Inclusion on an approved adjuvant list tied to a specific herbicide registration is the strongest commercial asset available, since it removes competitors from that hectare. Price per treated hectare remains decisive in broadacre crops. New entrants come mainly from oleochemical and biosurfactant producers offering plant-derived alternatives, and from crop protection companies building adjuvants into branded application systems.
Strategic activity centres on capability and channel. Upstream producers have added alkoxylation and methyl ester capacity to serve agricultural formulators. Formulators have acquired regional blenders to secure distribution footprint and local warehousing, a practical necessity for bulky liquid products. Partnerships between adjuvant formulators and spray equipment or nozzle manufacturers have become common, since drift performance depends on the combination rather than either component alone.
Vendor strategy is converging on verified drift and deposition performance, bio-based ranges for regulated markets, and formulations suited to low-volume drone and targeted spraying. Independent field validation is becoming the main differentiator in a category without mandatory efficacy review.
Recent Industry Developments
- 2005: The International Organization for Standardization published ISO 22866, specifying field measurement methods for spray drift from boom and orchard sprayers – it gave adjuvant suppliers a recognised basis for substantiating drift-reduction performance.
- October 2009: The European Parliament and the Council of the European Union adopted Regulation (EC) No 1107/2009 on placing plant protection products on the market and Directive 2009/128/EC on sustainable pesticide use – together they set how adjuvants and co-formulants are treated and made integrated pest management and sprayer inspection mandatory across the European Union.
- November 2016: The US Environmental Protection Agency granted conditional registrations for over-the-top dicamba use on dicamba-tolerant soybean and cotton, with labels restricting applicators to approved tank-mix partners and listed adjuvants – it created the first large-scale market where adjuvant choice was a label obligation.
- October 2020: The US Environmental Protection Agency issued new registrations for over-the-top dicamba products that required an approved volatility-reducing agent in the spray tank – it turned a specific adjuvant class into a mandatory purchase on treated hectares.
- February 2024: A United States federal district court vacated the over-the-top dicamba registrations, and the US Environmental Protection Agency issued an existing stocks order allowing already-distributed product to be used that season – the resulting uncertainty pushed growers and retailers to rebalance adjuvant inventories toward other herbicide systems.
Companies Covered in the Report
- Evonik Industries AG
- Croda International Plc
- Clariant AG
- Solvay S.A.
- Stepan Company
- Huntsman Corporation
- Nufarm Limited
- Corteva Agriscience
- Helena Agri-Enterprises, LLC
- Wilbur-Ellis Company LLC
- Precision Laboratories, LLC
- Brandt Consolidated, Inc.
- Garrco Products, Inc.
- Kalo, Inc.
- Innvictis Crop Care, LLC
Tank Mix Adjuvants Market Report Scope
| Metric | Value |
| Study Period | 2020–2033 |
| Market Size 2026 | US$ 4.3 Billion |
| Market Size 2033 | US$ 6.6 Billion |
| CAGR 2026–2033 | 6.3% |
| Absolute Dollar Opportunity | US$ 2.3 Billion |
| Largest Market | North America (36.2% share in 2026) |
| Fastest-Growing Market | Latin America (7.9% CAGR) |
| Market Concentration | Low |
| Major Players | Evonik Industries AG, Croda International Plc, Helena Agri-Enterprises, LLC, Nufarm Limited, Wilbur-Ellis Company LLC |
Tank Mix Adjuvants Market Segmentation
Product Type
- Surfactants
- Oil Adjuvants
- Drift Retardants and Deposition Aids
- Water Conditioners
- Buffering Agents
- Defoamers
Application
- Herbicides
- Insecticides
- Fungicides
- Other Applications
Crop Type
- Cereals and Grains
- Oilseeds and Pulses
- Fruits and Vegetables
- Other Crops
Source
- Synthetic
- Bio-Based
Regions
- North America
- Europe
- Asia Pacific
- Latin America
- Middle East & Africa
- Executive Summary
- Global Tank Mix Adjuvants Market Snapshot
- Market Size and Trend Analysis 2020–2033
- Historical Growth 2020–2025
- Base Year 2025
- Forecast Outlook 2026–2033
- Key Report Takeaways
- Market Overview
- Market Definition and Report Scope
- Market Dynamics
- Drivers
- Mandatory Approved Adjuvant Lists for Auxin Herbicides Convert Tank Mix Additives Into a Compliance Purchase
- Herbicide-Resistant Weeds Push Growers Toward Multi-Mode Tank Mixes That Need More Adjuvant Volume
- Restraints
- Unregistered Inert Ingredient Status Leaves Adjuvant Quality Unverified and Caps Grower Willingness to Pay
- Petrochemical and Vegetable Oil Feedstock Swings Squeeze Adjuvant Formulator Margins
- Market Opportunities
- Bio-Based Adjuvants Open a Compliance-Driven Revenue Pool in Residue-Sensitive Crops
- Drift-Reduction and Deposition Chemistry Tied to Precision Spraying Creates a New Per-Hectare Revenue Stream
- Drivers
- Segment Analysis
- By Product Type: Surfactants Hold the Base While Drift Retardants and Deposition Aids Climb Fastest
- By Application: Herbicide Programmes Dominate Volume While Fungicide Use Expands Quickest
- By Crop Type: Oilseeds and Pulses Lead Acreage While Fruits and Vegetables Grow Faster
- By Source: Synthetic Chemistry Dominates Supply While Bio-Based Products Gain Ground
- Global Tank Mix Adjuvants Market Outlook, 2020–2033
- Global Tank Mix Adjuvants Market Outlook, by Product Type, Value (US$ Billion), 2020–2033
- Surfactants
- Oil Adjuvants
- Drift Retardants and Deposition Aids
- Water Conditioners
- Buffering Agents
- Defoamers
- Global Tank Mix Adjuvants Market Outlook, by Application, Value (US$ Billion), 2020–2033
- Herbicides
- Insecticides
- Fungicides
- Other Applications
- Global Tank Mix Adjuvants Market Outlook, by Crop Type, Value (US$ Billion), 2020–2033
- Cereals and Grains
- Oilseeds and Pulses
- Fruits and Vegetables
- Other Crops
- Global Tank Mix Adjuvants Market Outlook, by Source, Value (US$ Billion), 2020–2033
- Synthetic
- Bio-Based
- Global Tank Mix Adjuvants Market Outlook, by Region, Value (US$ Billion), 2020–2033
- North America
- Europe
- Asia Pacific
- Latin America
- Middle East & Africa
- Global Tank Mix Adjuvants Market Outlook, by Product Type, Value (US$ Billion), 2020–2033
- North America Tank Mix Adjuvants Market Outlook, 2020–2033
- Regional Market Leadership
- North America Tank Mix Adjuvants Market Outlook, by Product Type, Value (US$ Billion), 2020–2033
- Surfactants
- Oil Adjuvants
- Drift Retardants and Deposition Aids
- Water Conditioners
- Buffering Agents
- Defoamers
- North America Tank Mix Adjuvants Market Outlook, by Application, Value (US$ Billion), 2020–2033
- Herbicides
- Insecticides
- Fungicides
- Other Applications
- North America Tank Mix Adjuvants Market Outlook, by Crop Type, Value (US$ Billion), 2020–2033
- Cereals and Grains
- Oilseeds and Pulses
- Fruits and Vegetables
- Other Crops
- North America Tank Mix Adjuvants Market Outlook, by Source, Value (US$ Billion), 2020–2033
- Synthetic
- Bio-Based
- North America Tank Mix Adjuvants Market Outlook, by Country, Value (US$ Billion), 2020–2033
- United States Tank Mix Adjuvants Market Outlook, by Product Type, 2020–2033
- United States Tank Mix Adjuvants Market Outlook, by Application, 2020–2033
- United States Tank Mix Adjuvants Market Outlook, by Crop Type, 2020–2033
- United States Tank Mix Adjuvants Market Outlook, by Source, 2020–2033
- Canada Tank Mix Adjuvants Market Outlook, by Product Type, 2020–2033
- Canada Tank Mix Adjuvants Market Outlook, by Application, 2020–2033
- Canada Tank Mix Adjuvants Market Outlook, by Crop Type, 2020–2033
- Canada Tank Mix Adjuvants Market Outlook, by Source, 2020–2033
- Europe Tank Mix Adjuvants Market Outlook, 2020–2033
- Plant Protection Product Rules Make Europe a Compliance-Led Adjuvant Market
- Europe Tank Mix Adjuvants Market Outlook, by Product Type, Value (US$ Billion), 2020–2033
- Surfactants
- Oil Adjuvants
- Drift Retardants and Deposition Aids
- Water Conditioners
- Buffering Agents
- Defoamers
- Europe Tank Mix Adjuvants Market Outlook, by Application, Value (US$ Billion), 2020–2033
- Herbicides
- Insecticides
- Fungicides
- Other Applications
- Europe Tank Mix Adjuvants Market Outlook, by Crop Type, Value (US$ Billion), 2020–2033
- Cereals and Grains
- Oilseeds and Pulses
- Fruits and Vegetables
- Other Crops
- Europe Tank Mix Adjuvants Market Outlook, by Source, Value (US$ Billion), 2020–2033
- Synthetic
- Bio-Based
- Europe Tank Mix Adjuvants Market Outlook, by Country, Value (US$ Billion), 2020–2033
- France Tank Mix Adjuvants Market Outlook, by Product Type, 2020–2033
- France Tank Mix Adjuvants Market Outlook, by Application, 2020–2033
- France Tank Mix Adjuvants Market Outlook, by Crop Type, 2020–2033
- France Tank Mix Adjuvants Market Outlook, by Source, 2020–2033
- Germany Tank Mix Adjuvants Market Outlook, by Product Type, 2020–2033
- Germany Tank Mix Adjuvants Market Outlook, by Application, 2020–2033
- Germany Tank Mix Adjuvants Market Outlook, by Crop Type, 2020–2033
- Germany Tank Mix Adjuvants Market Outlook, by Source, 2020–2033
- Spain Tank Mix Adjuvants Market Outlook, by Product Type, 2020–2033
- Spain Tank Mix Adjuvants Market Outlook, by Application, 2020–2033
- Spain Tank Mix Adjuvants Market Outlook, by Crop Type, 2020–2033
- Spain Tank Mix Adjuvants Market Outlook, by Source, 2020–2033
- Italy Tank Mix Adjuvants Market Outlook, by Product Type, 2020–2033
- Italy Tank Mix Adjuvants Market Outlook, by Application, 2020–2033
- Italy Tank Mix Adjuvants Market Outlook, by Crop Type, 2020–2033
- Italy Tank Mix Adjuvants Market Outlook, by Source, 2020–2033
- Poland Tank Mix Adjuvants Market Outlook, by Product Type, 2020–2033
- Poland Tank Mix Adjuvants Market Outlook, by Application, 2020–2033
- Poland Tank Mix Adjuvants Market Outlook, by Crop Type, 2020–2033
- Poland Tank Mix Adjuvants Market Outlook, by Source, 2020–2033
- Asia Pacific Tank Mix Adjuvants Market Outlook, 2020–2033
- Asia Pacific Adjuvant Demand Follows Rice, Smallholder Spraying and Drone Application
- Asia Pacific Tank Mix Adjuvants Market Outlook, by Product Type, Value (US$ Billion), 2020–2033
- Surfactants
- Oil Adjuvants
- Drift Retardants and Deposition Aids
- Water Conditioners
- Buffering Agents
- Defoamers
- Asia Pacific Tank Mix Adjuvants Market Outlook, by Application, Value (US$ Billion), 2020–2033
- Herbicides
- Insecticides
- Fungicides
- Other Applications
- Asia Pacific Tank Mix Adjuvants Market Outlook, by Crop Type, Value (US$ Billion), 2020–2033
- Cereals and Grains
- Oilseeds and Pulses
- Fruits and Vegetables
- Other Crops
- Asia Pacific Tank Mix Adjuvants Market Outlook, by Source, Value (US$ Billion), 2020–2033
- Synthetic
- Bio-Based
- Asia Pacific Tank Mix Adjuvants Market Outlook, by Country, Value (US$ Billion), 2020–2033
- China Tank Mix Adjuvants Market Outlook, by Product Type, 2020–2033
- China Tank Mix Adjuvants Market Outlook, by Application, 2020–2033
- China Tank Mix Adjuvants Market Outlook, by Crop Type, 2020–2033
- China Tank Mix Adjuvants Market Outlook, by Source, 2020–2033
- India Tank Mix Adjuvants Market Outlook, by Product Type, 2020–2033
- India Tank Mix Adjuvants Market Outlook, by Application, 2020–2033
- India Tank Mix Adjuvants Market Outlook, by Crop Type, 2020–2033
- India Tank Mix Adjuvants Market Outlook, by Source, 2020–2033
- Japan Tank Mix Adjuvants Market Outlook, by Product Type, 2020–2033
- Japan Tank Mix Adjuvants Market Outlook, by Application, 2020–2033
- Japan Tank Mix Adjuvants Market Outlook, by Crop Type, 2020–2033
- Japan Tank Mix Adjuvants Market Outlook, by Source, 2020–2033
- Australia Tank Mix Adjuvants Market Outlook, by Product Type, 2020–2033
- Australia Tank Mix Adjuvants Market Outlook, by Application, 2020–2033
- Australia Tank Mix Adjuvants Market Outlook, by Crop Type, 2020–2033
- Australia Tank Mix Adjuvants Market Outlook, by Source, 2020–2033
- Viet Nam Tank Mix Adjuvants Market Outlook, by Product Type, 2020–2033
- Viet Nam Tank Mix Adjuvants Market Outlook, by Application, 2020–2033
- Viet Nam Tank Mix Adjuvants Market Outlook, by Crop Type, 2020–2033
- Viet Nam Tank Mix Adjuvants Market Outlook, by Source, 2020–2033
- South Korea Tank Mix Adjuvants Market Outlook, by Product Type, 2020–2033
- South Korea Tank Mix Adjuvants Market Outlook, by Application, 2020–2033
- South Korea Tank Mix Adjuvants Market Outlook, by Crop Type, 2020–2033
- South Korea Tank Mix Adjuvants Market Outlook, by Source, 2020–2033
- Latin America Tank Mix Adjuvants Market Outlook, 2020–2033
- Regional Growth Outlook
- Latin America Tank Mix Adjuvants Market Outlook, by Product Type, Value (US$ Billion), 2020–2033
- Surfactants
- Oil Adjuvants
- Drift Retardants and Deposition Aids
- Water Conditioners
- Buffering Agents
- Defoamers
- Latin America Tank Mix Adjuvants Market Outlook, by Application, Value (US$ Billion), 2020–2033
- Herbicides
- Insecticides
- Fungicides
- Other Applications
- Latin America Tank Mix Adjuvants Market Outlook, by Crop Type, Value (US$ Billion), 2020–2033
- Cereals and Grains
- Oilseeds and Pulses
- Fruits and Vegetables
- Other Crops
- Latin America Tank Mix Adjuvants Market Outlook, by Source, Value (US$ Billion), 2020–2033
- Synthetic
- Bio-Based
- Latin America Tank Mix Adjuvants Market Outlook, by Country, Value (US$ Billion), 2020–2033
- Brazil Tank Mix Adjuvants Market Outlook, by Product Type, 2020–2033
- Brazil Tank Mix Adjuvants Market Outlook, by Application, 2020–2033
- Brazil Tank Mix Adjuvants Market Outlook, by Crop Type, 2020–2033
- Brazil Tank Mix Adjuvants Market Outlook, by Source, 2020–2033
- Argentina Tank Mix Adjuvants Market Outlook, by Product Type, 2020–2033
- Argentina Tank Mix Adjuvants Market Outlook, by Application, 2020–2033
- Argentina Tank Mix Adjuvants Market Outlook, by Crop Type, 2020–2033
- Argentina Tank Mix Adjuvants Market Outlook, by Source, 2020–2033
- Paraguay Tank Mix Adjuvants Market Outlook, by Product Type, 2020–2033
- Paraguay Tank Mix Adjuvants Market Outlook, by Application, 2020–2033
- Paraguay Tank Mix Adjuvants Market Outlook, by Crop Type, 2020–2033
- Paraguay Tank Mix Adjuvants Market Outlook, by Source, 2020–2033
- Colombia Tank Mix Adjuvants Market Outlook, by Product Type, 2020–2033
- Colombia Tank Mix Adjuvants Market Outlook, by Application, 2020–2033
- Colombia Tank Mix Adjuvants Market Outlook, by Crop Type, 2020–2033
- Colombia Tank Mix Adjuvants Market Outlook, by Source, 2020–2033
- Middle East & Africa Tank Mix Adjuvants Market Outlook, 2020–2033
- Middle East & Africa Adjuvant Use Concentrates in Irrigated and Export Horticulture
- Middle East & Africa Tank Mix Adjuvants Market Outlook, by Product Type, Value (US$ Billion), 2020–2033
- Surfactants
- Oil Adjuvants
- Drift Retardants and Deposition Aids
- Water Conditioners
- Buffering Agents
- Defoamers
- Middle East & Africa Tank Mix Adjuvants Market Outlook, by Application, Value (US$ Billion), 2020–2033
- Herbicides
- Insecticides
- Fungicides
- Other Applications
- Middle East & Africa Tank Mix Adjuvants Market Outlook, by Crop Type, Value (US$ Billion), 2020–2033
- Cereals and Grains
- Oilseeds and Pulses
- Fruits and Vegetables
- Other Crops
- Middle East & Africa Tank Mix Adjuvants Market Outlook, by Source, Value (US$ Billion), 2020–2033
- Synthetic
- Bio-Based
- Middle East & Africa Tank Mix Adjuvants Market Outlook, by Country, Value (US$ Billion), 2020–2033
- South Africa Tank Mix Adjuvants Market Outlook, by Product Type, 2020–2033
- South Africa Tank Mix Adjuvants Market Outlook, by Application, 2020–2033
- South Africa Tank Mix Adjuvants Market Outlook, by Crop Type, 2020–2033
- South Africa Tank Mix Adjuvants Market Outlook, by Source, 2020–2033
- Egypt Tank Mix Adjuvants Market Outlook, by Product Type, 2020–2033
- Egypt Tank Mix Adjuvants Market Outlook, by Application, 2020–2033
- Egypt Tank Mix Adjuvants Market Outlook, by Crop Type, 2020–2033
- Egypt Tank Mix Adjuvants Market Outlook, by Source, 2020–2033
- Morocco Tank Mix Adjuvants Market Outlook, by Product Type, 2020–2033
- Morocco Tank Mix Adjuvants Market Outlook, by Application, 2020–2033
- Morocco Tank Mix Adjuvants Market Outlook, by Crop Type, 2020–2033
- Morocco Tank Mix Adjuvants Market Outlook, by Source, 2020–2033
- Israel Tank Mix Adjuvants Market Outlook, by Product Type, 2020–2033
- Israel Tank Mix Adjuvants Market Outlook, by Application, 2020–2033
- Israel Tank Mix Adjuvants Market Outlook, by Crop Type, 2020–2033
- Israel Tank Mix Adjuvants Market Outlook, by Source, 2020–2033
- Saudi Arabia Tank Mix Adjuvants Market Outlook, by Product Type, 2020–2033
- Saudi Arabia Tank Mix Adjuvants Market Outlook, by Application, 2020–2033
- Saudi Arabia Tank Mix Adjuvants Market Outlook, by Crop Type, 2020–2033
- Saudi Arabia Tank Mix Adjuvants Market Outlook, by Source, 2020–2033
- Competitive Landscape
- Market Concentration and Supplier Participation
- Competitive Factors and Strategic Direction
- Recent Industry Developments
- ISO 22866 Field Spray Drift Measurement Standard 2005
- EU Plant Protection and Sustainable Pesticide Use Rules October 2009
- EPA Conditional Over-the-Top Dicamba Registrations November 2016
- EPA Dicamba Volatility-Reducing Agent Requirement October 2020
- Dicamba Registration Vacatur and EPA Existing Stocks Order February 2024
- Company Profiles
- Evonik Industries AG
- Croda International Plc
- Clariant AG
- Solvay S.A.
- Stepan Company
- Huntsman Corporation
- Nufarm Limited
- Corteva Agriscience
- Helena Agri-Enterprises, LLC
- Wilbur-Ellis Company LLC
- Precision Laboratories, LLC
- Brandt Consolidated, Inc.
- Garrco Products, Inc.
- Kalo, Inc.
- Innvictis Crop Care, LLC
- Appendix
- Research Methodology
- Report Assumptions
- Acronyms and Abbreviations
Product Type
- Surfactants
- Oil Adjuvants
- Drift Retardants and Deposition Aids
- Water Conditioners
- Buffering Agents
- Defoamers
Application
- Herbicides
- Insecticides
- Fungicides
- Other Applications
Crop Type
- Cereals and Grains
- Oilseeds and Pulses
- Fruits and Vegetables
- Other Crops
Source
- Synthetic
- Bio-Based
Regions
- North America
- Europe
- Asia Pacific
- Latin America
- Middle East & Africa
Our Research Methodology
Considering the volatility of business today, traditional approaches to strategizing a game plan can be unfruitful if not detrimental. True ambiguity is no way to determine a forecast. A myriad of predetermined factors must be accounted for such as the degree of risk involved, the magnitude of circumstances, as well as conditions or consequences that are not known or unpredictable. To circumvent binary views that cast uncertainty, the application of market research intelligence to strategically posture, move, and enable actionable outcomes is necessary.
View Methodology
Quality Assured
Rigorous Validation Process

Confidentiality Assured
End-to-end Data Security

Custom Research Services
Tailored To Your Objectives
FAQs
The global market is valued at US$ 4.3 billion in 2026, covering surfactants, oil adjuvants, drift retardants, water conditioners, buffering agents and defoamers.
The market is projected to reach US$ 6.6 billion by 2033, growing at a 6.3% CAGR and adding US$ 2.3 billion in absolute value.
Surfactants lead with 34.8% share in 2026, because wetting and spreading agents accompany almost every foliar herbicide, insecticide and fungicide application.
Latin America grows fastest at a 7.9% CAGR through 2033, driven by expanding soybean, maize and sugarcane area in Brazil.
Concentration is low, with North America at 36.2% share in 2026 and hundreds of regional blenders competing alongside large surfactant producers.
Related Reports
Automotive NVH Materials Market Size, Share, Insights, Competitive Landscape, and Forecast 2026 to 2033
The global automotive NVH materials market is valued at US$13.8 billion in 2026, reaching US$20.5 billion by 2033, growing at a 5.82% CAGR
Acrylonitrile Butadiene Styrene Market Size, Share, Insights, Competitive Landscape, and Forecast 2026 to 2033
The global acrylonitrile butadiene styrene market is valued at US$27.4 billion in 2026, reaching US$38.6 billion by 2033, growing at a 5.02% CAGR
Glass Flake Coatings Market Size, Share, Insights, Competitive Landscape, and Forecast 2026 to 2033
The glass flake coatings market is projected to grow from US$0.64 billion in 2026 to US$0.96 billion by 2033, at a 5.96% CAGR
Paint Protection Films Market Size, Share, Insights, Competitive Landscape, and Forecast 2026 to 2033
The global paint protection films market is valued at US$1.05 billion in 2026 and is projected to reach US$2.25 billion by 2033, growing at 11.5% CAGR
Electrical Steel Coatings Market Size, Share, Insights, Competitive Landscape, and Forecast 2026 to 2033
The electrical steel coatings market, valued at US$ 1.42 billion in 2026, and forecast to reach US$ 2.41 billion by 2033, growing at a 7.85% CAGR
Self-repairing Polymers Market Size, Share, Insights, Competitive Landscape, and Forecast 2026 to 2033
The global self-repairing polymers market is projected to grow from US$ 0.42 billion in 2026 to US$ 1.18 billion by 2033, at a CAGR of 15.90%