



3D Optical Profiler Market
3D Optical Profiler Market Size, Share, Insights, Competitive Landscape, and Forecast 2026 to 2033
3D Optical Profiler Market Analysis, 2026–2033
3D Optical Profiler Market
3D Optical Profiler Market Size, Share, Insights, Competitive Landscape, and Forecast 2026 to 2033
3D Optical Profiler Market Size and Trend Analysis
What Is Driving 3D Optical Profiler Market Growth?
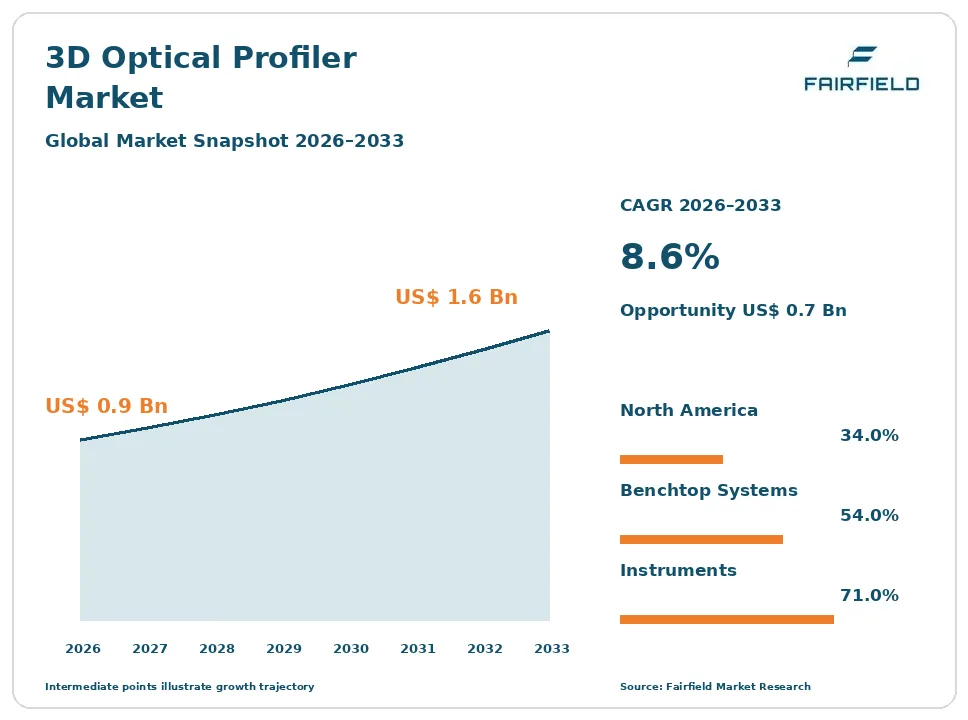
The global 3D Optical Profiler market size is expected to be valued at US$ 0.9 billion in 2026 and projected to reach US$ 1.6 billion by 2033, growing at a CAGR of 8.6% between 2026 and 2033.
Between 2020 and 2025 the market grew at roughly a 7.1% CAGR, a pace typical of a specialised instrument category with long replacement cycles. Growth now rests on three foundations. Advanced semiconductor packaging requires bump and pillar height uniformity data that stylus instruments cannot supply at volume. Electric vehicle components, battery electrodes and medical implants carry explicit surface specifications. Additive manufacturing needs surface qualification that no established method covered. Underneath all three sits one commercial fact: the standard is the product. Areal surface texture measurement only became coherent once its parameters were defined, so conformance now sells instruments.
Key Report Takeaways
- By Technology: Coherence Scanning Interferometry held 31% share in 2026, while Confocal and Chromatic Confocal Microscopy is projected to expand at a 10.7% CAGR through 2033, driven by chromatic point sensors moving onto production machines.
- By Configuration: Benchtop Laboratory Systems held 54% share in 2026, while In-Line and Integrated Metrology Systems are projected to expand at a 12.9% CAGR through 2033, as inspection moves from the quality laboratory to the production line.
- By End-Use Industry: Semiconductor and Electronics held 34% share in 2026, while Additive Manufacturing is projected to expand at a 12.4% CAGR through 2033, because printed surfaces lack an established qualification method.
- By Offering: Instruments held 71% share in 2026, while Analysis Software is projected to expand at a 10.9% CAGR through 2033, reflecting demand for areal parameter reporting that conforms to published definitions.
- By Geography: North America held 34% share in 2026, while Asia Pacific is projected to expand at an 11.4% CAGR through 2033, supported by advanced packaging capacity in Taiwan, South Korea and China.
Global 3D Optical Profiler Market Trends and Insights
Drivers Impact Analysis
| Driver | Impact on CAGR Forecast | Geographic Relevance | Impact Timeline |
| Advanced semiconductor packaging bump and pillar height uniformity | High | Asia Pacific, North America | Short term ≤2 years |
| Medical implant and additive manufacturing surface qualification | Medium | North America, Europe | Medium term 2–4 years |
The two forces below account for most incremental instrument demand across surface topography measurement.
Advanced Packaging Bump Height Uniformity Makes Areal Measurement a Yield Requirement
Advanced packaging has turned surface topography from a laboratory check into a yield control. Copper pillars, microbumps and hybrid bonding surfaces must be coplanar within tight tolerances, because a single short bump produces an open joint after reflow. Stylus instruments measure one trace at a time and cannot sample tens of thousands of features per wafer. Optical profilers return a full height map in seconds, which is why fabs and assembly sites buy them.
The causal mechanism is the shift from monolithic scaling to heterogeneous integration. As chiplets, interposers and wafer-level packaging spread, more electrical performance depends on mechanical flatness, warpage and total thickness variation. Semiconductor industry measurement and metrology requirements for advanced packaging now specify areal topography explicitly. Each new bonding or stacking step adds another measurement point, so instrument demand scales with process complexity rather than with wafer starts.
Implant Surface Specifications and Printed Part Qualification Expand Non-Contact Topography Demand
Regulated surfaces are the second source of growth. Orthopaedic and dental implant surfaces are specified by roughness and texture because those parameters influence osseointegration and wear. Manufacturers must demonstrate that finished surfaces match the registered specification, and contact styli can damage delicate coatings. Non-contact measurement delivers the evidence without altering the part, which is why implant producers have standardised on optical topography.
Additive manufacturing has created an adjacent and faster-moving problem. Printed metal surfaces carry partially melted particles, re-entrant features and steep local slopes that older profile parameters describe poorly. The ISO 25178 series gave engineers areal parameters that can actually characterise such surfaces, and the ISO 21920 series modernised profile measurement alongside it. Aerospace and medical qualification programmes now cite those parameters directly in build acceptance criteria.
Restraints Impact Analysis
| Restraint | Impact on CAGR Forecast | Geographic Relevance | Impact Timeline |
| Instrument price against established stylus profilometry | High | Global | Long term ≥4 years |
| Optical failure on steep, rough, transparent and multilayer surfaces | Medium | Global | Long term ≥4 years |
The restraints below are physical and economic, and neither is close to being eliminated.
Price Against Established Stylus Profilometry Slows Replacement in Cost-Sensitive Workshops
Price is the first barrier a 3D optical profiler must clear, because a capable alternative already sits on the bench. A contact stylus profilometer costs a fraction of an interferometric or confocal system, and for a single roughness value on a turned shaft it answers the question adequately. General machining, tooling and fabrication shops therefore replace slowly, and often only when a customer specification forces areal reporting.
The cost sits in precision hardware and in ownership. A coherence scanning instrument needs a vibration-isolated table, a controlled environment, high-grade objectives, a calibrated reference flat and traceable artefacts. Periodic calibration under ISO/IEC 17025 laboratory competence requirements adds recurring expense, and ISO 10360 style traceability obligations extend to the artefacts themselves. Software licences for areal analysis are frequently a separate line item, which raises the quoted system price further.
Steep Slopes, Transparent Films and Rough Finishes Expose the Limits of Optical Methods
No optical method measures every surface, and that limitation caps the addressable base. Steep slopes reflect light away from the objective and produce dropouts. Transparent and semi-transparent films generate interference from multiple interfaces, so a height map may record a coating boundary rather than the true surface. Very rough or heavily textured finishes scatter light and degrade signal, leaving voids that must be filled by interpolation.
The underlying cause is that each technique trades one weakness for another. Coherence scanning handles rough surfaces but struggles with steep walls and thin films. Confocal tolerates slope but needs more acquisition time. Focus variation suits rough machined parts yet loses resolution on smooth ones. VDI/VDE 2655 guidance on optical roughness measurement and the instrument-specific parts of ISO 25178 document these limits, which buyers must navigate with real operator expertise.
Market Opportunities
Two revenue pools are emerging that sit outside conventional laboratory instrument replacement cycles.
Moving Measurement to the Production Line Opens an Integrated Metrology Revenue Pool
The move from metrology laboratory to production line is the largest structural opportunity in this market. In-line and at-line measurement is a different engineering problem from laboratory work: vibration, thermal drift, cycle time and unskilled operators matter more than ultimate vertical resolution. Instruments engineered for that environment, with robust enclosures, automated handling and pass or fail logic, command recurring volume sales rather than single laboratory placements.
Capture favours suppliers who can integrate with automation rather than optics specialists alone. Demand comes from battery electrode coating lines, electric vehicle sealing and bearing surfaces, display and optics production, and semiconductor assembly. Chromatic confocal point sensors and fringe projection heads are already the common building blocks because they are compact and tolerant. The pull is strongest where a surface defect is discovered too late to rework economically.
Areal Parameter Software and Calibration Services Build a Recurring Revenue Layer
Analysis software and calibration services are becoming a durable annuity alongside instrument sales. A height map is not an answer; the deliverable is a conforming set of areal surface texture parameters with a defensible uncertainty statement. Customers in regulated industries need filtering, form removal and parameter calculation that demonstrably follow published definitions, plus periodic verification against traceable artefacts.
Instrument makers, independent software developers and accredited calibration laboratories can all capture this pool, often alongside one another. Demand comes from medical device manufacturers, aerospace suppliers, optics producers and semiconductor assembly sites that must defend their measurements during a customer or regulatory audit. The ISO 25178 parts covering calibration and metrological characteristics, together with ASME B46.1 in the United States, give this work a defined technical basis, which turns software conformance and artefact traceability into a purchasing criterion.
Segment Analysis
By Technology: Coherence Scanning Interferometry Leads as Chromatic Confocal Sensing Accelerates
Coherence Scanning Interferometry holds 31% share in 2026, the largest single technology position. Its combination of sub-nanometre vertical resolution with tolerance for rough surfaces makes it the default choice for semiconductor, optics and precision machining laboratories. Phase-shifting interferometry remains dominant for very smooth optical flats and lenses, where it still provides the highest accuracy available.
Confocal and Chromatic Confocal Microscopy grows fastest at a 10.7% CAGR through 2033. Confocal handles steeper local slopes than interferometry, and chromatic confocal point sensors are compact, fast and robust enough to mount on production machines. That portability is what converts a laboratory technique into an in-line one. Focus variation, fringe projection and digital holographic microscopy occupy smaller but defensible niches tied to specific surface types.
By Configuration: Benchtop Systems Still Dominate While In-Line Metrology Grows Quickest
Benchtop Laboratory Systems account for 54% share in 2026. Most surface topography work remains sampling-based, performed on extracted parts in a controlled room where vibration and temperature can be managed and where a trained metrologist interprets the result. These systems also carry the highest prices, which inflates their revenue share relative to unit volumes.
In-Line and Integrated Metrology Systems expand fastest at a 12.9% CAGR through 2033. Manufacturers increasingly want topography data while a process is running, not after a lot is complete. Semiconductor assembly, battery electrode coating and precision machining cells are leading this shift. Shop-floor and portable configurations fill the middle ground. The business implication is that ruggedisation, automation interfaces and cycle time now matter as much as optical specification.
By End-Use Industry: Semiconductor Demand Leads While Additive Manufacturing Rises Fastest
Semiconductor and Electronics leads with 34% share in 2026. Wafer-level packaging, bump and pillar inspection, warpage measurement and microelectromechanical device characterisation all require quantitative height data, and the industry replaces metrology equipment on a faster cycle than most. Precision machining and automotive follows, supported by electric vehicle sealing surfaces, bearing races and battery component tolerances.
Additive Manufacturing grows fastest at a 12.4% CAGR through 2033, from a small base. Printed surfaces are difficult to characterise, and aerospace and medical qualification programmes increasingly require areal parameters rather than a single roughness average. Medical devices and implants, optics manufacturing and academic research complete the mix. For suppliers, the implication is that application-specific measurement recipes, not raw instrument performance, win these accounts.
By Offering: Instrument Sales Dominate Revenue While Analysis Software Scales Faster
Instruments account for 71% of revenue in 2026. The hardware carries the cost of precision optics, scanners, vibration-tolerant mechanics and calibrated references, and most customers still buy a complete system from one supplier rather than assembling components. Services, calibration and support make up the remainder, growing steadily with the installed base.
Analysis Software grows fastest at a 10.9% CAGR through 2033. Demand comes from areal parameter reporting, automated filtering and form removal, batch analysis and audit-ready documentation. Customers running mixed fleets want one analysis environment across instruments from different suppliers, which has created space for independent software vendors. The implication is that software conformance to published parameter definitions is becoming a genuine purchasing criterion rather than a bundled extra.
Geography Analysis
Which Region Is Leading the 3D Optical Profiler Market?
North America leads with 34% share in 2026, driven overwhelmingly by the United States with a smaller contribution from Canada and Mexico. The region holds the deepest installed base of high-end optical metrology, concentrated in semiconductor research and development, defence optics, aerospace component manufacturing and medical device production. Several of the founding instrument platforms in interferometric surface measurement were developed and are still built there, which keeps application engineering close to customers. Federal semiconductor manufacturing incentives have funded new fabrication and advanced packaging sites, each requiring metrology capability from the outset. Medical device manufacturers add steady demand because implant surface specifications must be demonstrated during regulatory submission. The principal change ahead is the migration of measurement out of accredited laboratories and onto production floors.
Europe Anchors Instrument Design and Surface Texture Standardisation Work
Europe accounts for 27% of the market in 2026, with Germany, Switzerland, the United Kingdom, France and Austria leading. The region’s position rests on precision engineering rather than volume electronics. German and Swiss machine tool, bearing, automotive and optics manufacturers specify surface texture tightly, and their suppliers must prove conformance. Several significant confocal, focus variation and interferometric instrument makers are based in the region, and much of the technical work behind areal surface texture standardisation has been carried out by national metrology institutes there. VDI/VDE 2655 guidance on optical roughness measurement is widely applied in German industry. The constraint is slower capital spending in automotive supply chains. The opportunity lies in battery manufacturing, where electrode coating uniformity requires continuous topography measurement.
Which Region Is Growing Fastest in the 3D Optical Profiler Market?
Asia Pacific grows fastest at an 11.4% CAGR between 2026 and 2033, rising from 30% share in 2026, led by Taiwan, South Korea, China, Japan and Singapore. Advanced packaging is the reason. Taiwan and South Korea host the largest concentrations of wafer-level packaging and high-bandwidth memory stacking capacity, where bump coplanarity and warpage measurement are production requirements rather than laboratory exercises. China is building domestic packaging and display capacity quickly and is also developing local instrument suppliers. Japan contributes both demand from precision optics and automotive manufacturing and supply from established microscope and measurement companies. Electric vehicle and battery investment across the region adds a second demand stream. The constraint is price sensitivity among smaller subcontract manufacturers, which sustains the stylus installed base.
Latin America Adds Capability Slowly Through Automotive and Aerospace Suppliers
Latin America represents 5% of the market in 2026, concentrated in Brazil and Mexico, with smaller activity in Argentina and Chile. Demand comes mainly from automotive and aerospace component suppliers serving export customers who impose surface specifications contractually, and from a handful of universities and national laboratories. Barriers are substantial: instruments are imported and subject to duties and currency risk, service response times are long, accredited calibration capability is limited, and trained metrologists are scarce. Many plants consequently retain stylus instruments and outsource occasional areal measurement. The most credible opportunity is the growth of automotive manufacturing in northern Mexico, where tier-one suppliers increasingly need in-house capability to satisfy customer audits rather than shipping parts abroad for measurement.
Middle East & Africa Builds Metrology Capacity Around New Industrial Programmes
Middle East & Africa holds 4% of the market in 2026, with activity centred on Israel, the United Arab Emirates, Saudi Arabia, Turkey and South Africa. Israel is the main source of advanced demand, with a dense semiconductor, optics and medical device sector that buys high-end instruments. Elsewhere, demand follows industrial diversification programmes funding aerospace maintenance, defence manufacturing and research universities. Barriers include very small installed bases, limited local service and calibration infrastructure, dependence on distributors for application support, and a shortage of trained operators. South Africa retains mining equipment and automotive component manufacturing that uses surface measurement. The opportunity is in new research and technology centres, which are specifying modern areal metrology rather than inheriting legacy stylus equipment.
Competitive Landscape
The market is moderately concentrated. A small group of instrument makers holds most of the high-end revenue, because building a traceable optical profiler requires precision optics, scanner mechanics, environmental control and parameter software developed together over many years. Below that group sits a layer of specialist suppliers focused on single techniques such as chromatic confocal sensing, focus variation or digital holographic microscopy, and a further tier of regional builders serving price-sensitive buyers. Consolidation has been steady rather than dramatic, typically taking the form of larger analytical instrument and semiconductor equipment groups absorbing technique specialists to complete a portfolio.
Competition is unusual in that conformance is itself a product attribute. Vendors compete on demonstrated agreement with published areal parameter definitions, on the calibration artefacts and uncertainty budgets they supply, on accredited calibration services, and on the measurement recipes they can provide for specific applications. Resolution and repeatability specifications matter, but customers who must defend data during audit weigh traceability more heavily. New entrants arrive mainly from sensor and automation backgrounds, offering compact in-line heads rather than laboratory microscopes, and they compete on cycle time and integration instead of ultimate performance.
Strategic activity has centred on extending laboratory platforms toward production environments, acquiring analysis software capability, and building service and calibration networks close to semiconductor assembly clusters. Partnerships between instrument makers and automation integrators matter because in-line placement depends on handling and data interfaces as much as on optics.
Strategic direction is converging on three themes: standards conformance as a sales argument, hybrid instruments that combine two measurement principles in one frame, and software that makes areal analysis usable by production staff rather than metrologists.
3D Optical Profiler Industry Leaders
Bruker Corporation
Zygo Corporation
KLA Corporation
Keyence Corporation
Carl Zeiss AG
Recent Industry Developments
- December 2021: ISO published the ISO 21920 series on profile surface texture, replacing the long-standing profile standards and realigning profile practice with the areal framework that instruments already supported.
- August 2022: The United States enacted the CHIPS and Science Act, committing public funding to domestic semiconductor fabrication, advanced packaging and research facilities that each require surface metrology capability.
- 2022: ISO issued the part of the ISO 25178 series covering calibration, adjustment and verification of areal topography measuring instruments, giving buyers a common basis for comparing traceability claims.
- September 2023: The European Union Chips Act entered into force, establishing funding for pilot lines and advanced packaging capacity across the region and lifting demand for production metrology.
Companies Covered in the Report
Bruker Corporation
Zygo Corporation
KLA Corporation
Keyence Corporation
Mitutoyo Corporation
Carl Zeiss AG
Sensofar Metrology
Polytec GmbH
Nanovea, Inc.
Evident Corporation
Nikon Corporation
Lyncée Tec SA
Onto Innovation Inc.
3D Optical Profiler Market Report Scope
This report covers non-contact optical instruments that measure surface topography and form quantitatively, including coherence scanning and phase-shifting interferometers, confocal and chromatic confocal systems, focus variation instruments, fringe projection systems, digital holographic microscopes and the areal analysis software sold with them. Contact stylus profilometry, coordinate measuring machines and production machine vision are excluded. The base year is 2025 and the forecast period runs from 2026 to 2033, in US$ Billion.
Technology
- Coherence Scanning Interferometry
- Phase-Shifting Interferometry
- Confocal and Chromatic Confocal Microscopy
- Focus Variation
- Structured Illumination and Fringe Projection
- Digital Holographic Microscopy
Configuration
- Benchtop Laboratory Systems
- Shop-Floor Systems
- In-Line and Integrated Metrology Systems
- Portable Systems
End-Use Industry
- Semiconductor and Electronics
- Precision Machining and Automotive
- Medical Devices and Implants
- Optics and Photonics Manufacturing
- Additive Manufacturing
- Academic and Research
Offering
- Instruments
- Analysis Software
- Services, Calibration and Support
Regions
- North America
- Europe
- Asia Pacific
- Latin America
- Middle East & Africa
Key Questions Answered in the Report
How big is the 3D optical profiler market in 2026?
The market is valued at US$ 0.9 billion in 2026, covering non-contact optical instruments and software used for quantitative surface topography measurement.
What is the forecast size and growth rate through 2033?
The market is projected to reach US$ 1.6 billion by 2033, growing at an 8.6% CAGR and adding US$ 0.7 billion in absolute opportunity.
Which technology leads the 3D optical profiler market?
Coherence Scanning Interferometry leads with 31% share in 2026, because it combines very high vertical resolution with tolerance for rough surfaces.
Which configuration and region are growing fastest?
In-Line and Integrated Metrology Systems grow fastest at a 12.9% CAGR, while Asia Pacific expands at an 11.4% CAGR on advanced packaging demand.
Which region is largest and how concentrated is the supplier base?
North America holds 34% share in 2026, and the market is moderately concentrated, with a small group of instrument makers holding most high-end revenue.
1. Executive Summary
1.1. Global 3D Optical Profiler Market Snapshot
1.2. Future Projections
1.3. Key Report Takeaways
1.4. Regional Snapshot
2. Market Overview
2.1. Market Definition and Report Scope
2.2. Historical Trends 2020–2025
2.3. Market Dynamics
2.3.1. Drivers
2.3.1.1. Advanced Packaging Bump Height Uniformity Makes Areal Measurement a Yield Requirement
2.3.1.2. Implant Surface Specifications and Printed Part Qualification Expand Non-Contact Topography Demand
2.3.2. Restraints
2.3.2.1. Price Against Established Stylus Profilometry Slows Replacement in Cost-Sensitive Workshops
2.3.2.2. Steep Slopes, Transparent Films and Rough Finishes Expose the Limits of Optical Methods
2.3.3. Market Opportunities
2.3.3.1. Moving Measurement to the Production Line Opens an Integrated Metrology Revenue Pool
2.3.3.2. Areal Parameter Software and Calibration Services Build a Recurring Revenue Layer
3. Global 3D Optical Profiler Market Outlook, 2020–2033
3.1. Global 3D Optical Profiler Market Outlook, by Technology, Value (US$ Billion), 2020–2033
3.1.1. Coherence Scanning Interferometry
3.1.2. Phase-Shifting Interferometry
3.1.3. Confocal and Chromatic Confocal Microscopy
3.1.4. Focus Variation
3.1.5. Structured Illumination and Fringe Projection
3.1.6. Digital Holographic Microscopy
3.2. Global 3D Optical Profiler Market Outlook, by Configuration, Value (US$ Billion), 2020–2033
3.2.1. Benchtop Laboratory Systems
3.2.2. Shop-Floor Systems
3.2.3. In-Line and Integrated Metrology Systems
3.2.4. Portable Systems
3.3. Global 3D Optical Profiler Market Outlook, by End-Use Industry, Value (US$ Billion), 2020–2033
3.3.1. Semiconductor and Electronics
3.3.2. Precision Machining and Automotive
3.3.3. Medical Devices and Implants
3.3.4. Optics and Photonics Manufacturing
3.3.5. Additive Manufacturing
3.3.6. Academic and Research
3.4. Global 3D Optical Profiler Market Outlook, by Offering, Value (US$ Billion), 2020–2033
3.4.1. Instruments
3.4.2. Analysis Software
3.4.3. Services, Calibration and Support
3.5. Global 3D Optical Profiler Market Outlook, by Region, Value (US$ Billion), 2020–2033
3.5.1. North America
3.5.2. Europe
3.5.3. Asia Pacific
3.5.4. Latin America
3.5.5. Middle East & Africa
4. North America 3D Optical Profiler Market Outlook, 2020–2033
4.1. North America 3D Optical Profiler Market Outlook, by Technology, Value (US$ Billion), 2020–2033
4.1.1. Coherence Scanning Interferometry
4.1.2. Phase-Shifting Interferometry
4.1.3. Confocal and Chromatic Confocal Microscopy
4.1.4. Focus Variation
4.1.5. Structured Illumination and Fringe Projection
4.1.6. Digital Holographic Microscopy
4.2. North America 3D Optical Profiler Market Outlook, by Configuration, Value (US$ Billion), 2020–2033
4.2.1. Benchtop Laboratory Systems
4.2.2. Shop-Floor Systems
4.2.3. In-Line and Integrated Metrology Systems
4.2.4. Portable Systems
4.3. North America 3D Optical Profiler Market Outlook, by End-Use Industry, Value (US$ Billion), 2020–2033
4.3.1. Semiconductor and Electronics
4.3.2. Precision Machining and Automotive
4.3.3. Medical Devices and Implants
4.3.4. Optics and Photonics Manufacturing
4.3.5. Additive Manufacturing
4.3.6. Academic and Research
4.4. North America 3D Optical Profiler Market Outlook, by Offering, Value (US$ Billion), 2020–2033
4.4.1. Instruments
4.4.2. Analysis Software
4.4.3. Services, Calibration and Support
4.5. North America 3D Optical Profiler Market Outlook, by Country, Value (US$ Billion), 2020–2033
4.5.1. United States 3D Optical Profiler Market Outlook, by Technology, 2020–2033
4.5.2. United States 3D Optical Profiler Market Outlook, by Configuration, 2020–2033
4.5.3. United States 3D Optical Profiler Market Outlook, by End-Use Industry, 2020–2033
4.5.4. United States 3D Optical Profiler Market Outlook, by Offering, 2020–2033
4.5.5. Canada 3D Optical Profiler Market Outlook, by Technology, 2020–2033
4.5.6. Canada 3D Optical Profiler Market Outlook, by Configuration, 2020–2033
4.5.7. Canada 3D Optical Profiler Market Outlook, by End-Use Industry, 2020–2033
4.5.8. Canada 3D Optical Profiler Market Outlook, by Offering, 2020–2033
4.5.9. Mexico 3D Optical Profiler Market Outlook, by Technology, 2020–2033
4.5.10. Mexico 3D Optical Profiler Market Outlook, by Configuration, 2020–2033
4.5.11. Mexico 3D Optical Profiler Market Outlook, by End-Use Industry, 2020–2033
4.5.12. Mexico 3D Optical Profiler Market Outlook, by Offering, 2020–2033
5. Europe 3D Optical Profiler Market Outlook, 2020–2033
5.1. Europe 3D Optical Profiler Market Outlook, by Technology, Value (US$ Billion), 2020–2033
5.1.1. Coherence Scanning Interferometry
5.1.2. Phase-Shifting Interferometry
5.1.3. Confocal and Chromatic Confocal Microscopy
5.1.4. Focus Variation
5.1.5. Structured Illumination and Fringe Projection
5.1.6. Digital Holographic Microscopy
5.2. Europe 3D Optical Profiler Market Outlook, by Configuration, Value (US$ Billion), 2020–2033
5.2.1. Benchtop Laboratory Systems
5.2.2. Shop-Floor Systems
5.2.3. In-Line and Integrated Metrology Systems
5.2.4. Portable Systems
5.3. Europe 3D Optical Profiler Market Outlook, by End-Use Industry, Value (US$ Billion), 2020–2033
5.3.1. Semiconductor and Electronics
5.3.2. Precision Machining and Automotive
5.3.3. Medical Devices and Implants
5.3.4. Optics and Photonics Manufacturing
5.3.5. Additive Manufacturing
5.3.6. Academic and Research
5.4. Europe 3D Optical Profiler Market Outlook, by Offering, Value (US$ Billion), 2020–2033
5.4.1. Instruments
5.4.2. Analysis Software
5.4.3. Services, Calibration and Support
5.5. Europe 3D Optical Profiler Market Outlook, by Country, Value (US$ Billion), 2020–2033
5.5.1. Germany 3D Optical Profiler Market Outlook, by Technology, 2020–2033
5.5.2. Germany 3D Optical Profiler Market Outlook, by Configuration, 2020–2033
5.5.3. Germany 3D Optical Profiler Market Outlook, by End-Use Industry, 2020–2033
5.5.4. Germany 3D Optical Profiler Market Outlook, by Offering, 2020–2033
5.5.5. Switzerland 3D Optical Profiler Market Outlook, by Technology, 2020–2033
5.5.6. Switzerland 3D Optical Profiler Market Outlook, by Configuration, 2020–2033
5.5.7. Switzerland 3D Optical Profiler Market Outlook, by End-Use Industry, 2020–2033
5.5.8. Switzerland 3D Optical Profiler Market Outlook, by Offering, 2020–2033
5.5.9. United Kingdom 3D Optical Profiler Market Outlook, by Technology, 2020–2033
5.5.10. United Kingdom 3D Optical Profiler Market Outlook, by Configuration, 2020–2033
5.5.11. United Kingdom 3D Optical Profiler Market Outlook, by End-Use Industry, 2020–2033
5.5.12. United Kingdom 3D Optical Profiler Market Outlook, by Offering, 2020–2033
5.5.13. France 3D Optical Profiler Market Outlook, by Technology, 2020–2033
5.5.14. France 3D Optical Profiler Market Outlook, by Configuration, 2020–2033
5.5.15. France 3D Optical Profiler Market Outlook, by End-Use Industry, 2020–2033
5.5.16. France 3D Optical Profiler Market Outlook, by Offering, 2020–2033
5.5.17. Austria 3D Optical Profiler Market Outlook, by Technology, 2020–2033
5.5.18. Austria 3D Optical Profiler Market Outlook, by Configuration, 2020–2033
5.5.19. Austria 3D Optical Profiler Market Outlook, by End-Use Industry, 2020–2033
5.5.20. Austria 3D Optical Profiler Market Outlook, by Offering, 2020–2033
6. Asia Pacific 3D Optical Profiler Market Outlook, 2020–2033
6.1. Asia Pacific 3D Optical Profiler Market Outlook, by Technology, Value (US$ Billion), 2020–2033
6.1.1. Coherence Scanning Interferometry
6.1.2. Phase-Shifting Interferometry
6.1.3. Confocal and Chromatic Confocal Microscopy
6.1.4. Focus Variation
6.1.5. Structured Illumination and Fringe Projection
6.1.6. Digital Holographic Microscopy
6.2. Asia Pacific 3D Optical Profiler Market Outlook, by Configuration, Value (US$ Billion), 2020–2033
6.2.1. Benchtop Laboratory Systems
6.2.2. Shop-Floor Systems
6.2.3. In-Line and Integrated Metrology Systems
6.2.4. Portable Systems
6.3. Asia Pacific 3D Optical Profiler Market Outlook, by End-Use Industry, Value (US$ Billion), 2020–2033
6.3.1. Semiconductor and Electronics
6.3.2. Precision Machining and Automotive
6.3.3. Medical Devices and Implants
6.3.4. Optics and Photonics Manufacturing
6.3.5. Additive Manufacturing
6.3.6. Academic and Research
6.4. Asia Pacific 3D Optical Profiler Market Outlook, by Offering, Value (US$ Billion), 2020–2033
6.4.1. Instruments
6.4.2. Analysis Software
6.4.3. Services, Calibration and Support
6.5. Asia Pacific 3D Optical Profiler Market Outlook, by Country, Value (US$ Billion), 2020–2033
6.5.1. Taiwan 3D Optical Profiler Market Outlook, by Technology, 2020–2033
6.5.2. Taiwan 3D Optical Profiler Market Outlook, by Configuration, 2020–2033
6.5.3. Taiwan 3D Optical Profiler Market Outlook, by End-Use Industry, 2020–2033
6.5.4. Taiwan 3D Optical Profiler Market Outlook, by Offering, 2020–2033
6.5.5. South Korea 3D Optical Profiler Market Outlook, by Technology, 2020–2033
6.5.6. South Korea 3D Optical Profiler Market Outlook, by Configuration, 2020–2033
6.5.7. South Korea 3D Optical Profiler Market Outlook, by End-Use Industry, 2020–2033
6.5.8. South Korea 3D Optical Profiler Market Outlook, by Offering, 2020–2033
6.5.9. China 3D Optical Profiler Market Outlook, by Technology, 2020–2033
6.5.10. China 3D Optical Profiler Market Outlook, by Configuration, 2020–2033
6.5.11. China 3D Optical Profiler Market Outlook, by End-Use Industry, 2020–2033
6.5.12. China 3D Optical Profiler Market Outlook, by Offering, 2020–2033
6.5.13. Japan 3D Optical Profiler Market Outlook, by Technology, 2020–2033
6.5.14. Japan 3D Optical Profiler Market Outlook, by Configuration, 2020–2033
6.5.15. Japan 3D Optical Profiler Market Outlook, by End-Use Industry, 2020–2033
6.5.16. Japan 3D Optical Profiler Market Outlook, by Offering, 2020–2033
6.5.17. Singapore 3D Optical Profiler Market Outlook, by Technology, 2020–2033
6.5.18. Singapore 3D Optical Profiler Market Outlook, by Configuration, 2020–2033
6.5.19. Singapore 3D Optical Profiler Market Outlook, by End-Use Industry, 2020–2033
6.5.20. Singapore 3D Optical Profiler Market Outlook, by Offering, 2020–2033
7. Latin America 3D Optical Profiler Market Outlook, 2020–2033
7.1. Latin America 3D Optical Profiler Market Outlook, by Technology, Value (US$ Billion), 2020–2033
7.1.1. Coherence Scanning Interferometry
7.1.2. Phase-Shifting Interferometry
7.1.3. Confocal and Chromatic Confocal Microscopy
7.1.4. Focus Variation
7.1.5. Structured Illumination and Fringe Projection
7.1.6. Digital Holographic Microscopy
7.2. Latin America 3D Optical Profiler Market Outlook, by Configuration, Value (US$ Billion), 2020–2033
7.2.1. Benchtop Laboratory Systems
7.2.2. Shop-Floor Systems
7.2.3. In-Line and Integrated Metrology Systems
7.2.4. Portable Systems
7.3. Latin America 3D Optical Profiler Market Outlook, by End-Use Industry, Value (US$ Billion), 2020–2033
7.3.1. Semiconductor and Electronics
7.3.2. Precision Machining and Automotive
7.3.3. Medical Devices and Implants
7.3.4. Optics and Photonics Manufacturing
7.3.5. Additive Manufacturing
7.3.6. Academic and Research
7.4. Latin America 3D Optical Profiler Market Outlook, by Offering, Value (US$ Billion), 2020–2033
7.4.1. Instruments
7.4.2. Analysis Software
7.4.3. Services, Calibration and Support
7.5. Latin America 3D Optical Profiler Market Outlook, by Country, Value (US$ Billion), 2020–2033
7.5.1. Brazil 3D Optical Profiler Market Outlook, by Technology, 2020–2033
7.5.2. Brazil 3D Optical Profiler Market Outlook, by Configuration, 2020–2033
7.5.3. Brazil 3D Optical Profiler Market Outlook, by End-Use Industry, 2020–2033
7.5.4. Brazil 3D Optical Profiler Market Outlook, by Offering, 2020–2033
7.5.5. Mexico 3D Optical Profiler Market Outlook, by Technology, 2020–2033
7.5.6. Mexico 3D Optical Profiler Market Outlook, by Configuration, 2020–2033
7.5.7. Mexico 3D Optical Profiler Market Outlook, by End-Use Industry, 2020–2033
7.5.8. Mexico 3D Optical Profiler Market Outlook, by Offering, 2020–2033
7.5.9. Argentina 3D Optical Profiler Market Outlook, by Technology, 2020–2033
7.5.10. Argentina 3D Optical Profiler Market Outlook, by Configuration, 2020–2033
7.5.11. Argentina 3D Optical Profiler Market Outlook, by End-Use Industry, 2020–2033
7.5.12. Argentina 3D Optical Profiler Market Outlook, by Offering, 2020–2033
7.5.13. Chile 3D Optical Profiler Market Outlook, by Technology, 2020–2033
7.5.14. Chile 3D Optical Profiler Market Outlook, by Configuration, 2020–2033
7.5.15. Chile 3D Optical Profiler Market Outlook, by End-Use Industry, 2020–2033
7.5.16. Chile 3D Optical Profiler Market Outlook, by Offering, 2020–2033
8. Middle East & Africa 3D Optical Profiler Market Outlook, 2020–2033
8.1. Middle East & Africa 3D Optical Profiler Market Outlook, by Technology, Value (US$ Billion), 2020–2033
8.1.1. Coherence Scanning Interferometry
8.1.2. Phase-Shifting Interferometry
8.1.3. Confocal and Chromatic Confocal Microscopy
8.1.4. Focus Variation
8.1.5. Structured Illumination and Fringe Projection
8.1.6. Digital Holographic Microscopy
8.2. Middle East & Africa 3D Optical Profiler Market Outlook, by Configuration, Value (US$ Billion), 2020–2033
8.2.1. Benchtop Laboratory Systems
8.2.2. Shop-Floor Systems
8.2.3. In-Line and Integrated Metrology Systems
8.2.4. Portable Systems
8.3. Middle East & Africa 3D Optical Profiler Market Outlook, by End-Use Industry, Value (US$ Billion), 2020–2033
8.3.1. Semiconductor and Electronics
8.3.2. Precision Machining and Automotive
8.3.3. Medical Devices and Implants
8.3.4. Optics and Photonics Manufacturing
8.3.5. Additive Manufacturing
8.3.6. Academic and Research
8.4. Middle East & Africa 3D Optical Profiler Market Outlook, by Offering, Value (US$ Billion), 2020–2033
8.4.1. Instruments
8.4.2. Analysis Software
8.4.3. Services, Calibration and Support
8.5. Middle East & Africa 3D Optical Profiler Market Outlook, by Country, Value (US$ Billion), 2020–2033
8.5.1. Israel 3D Optical Profiler Market Outlook, by Technology, 2020–2033
8.5.2. Israel 3D Optical Profiler Market Outlook, by Configuration, 2020–2033
8.5.3. Israel 3D Optical Profiler Market Outlook, by End-Use Industry, 2020–2033
8.5.4. Israel 3D Optical Profiler Market Outlook, by Offering, 2020–2033
8.5.5. United Arab Emirates 3D Optical Profiler Market Outlook, by Technology, 2020–2033
8.5.6. United Arab Emirates 3D Optical Profiler Market Outlook, by Configuration, 2020–2033
8.5.7. United Arab Emirates 3D Optical Profiler Market Outlook, by End-Use Industry, 2020–2033
8.5.8. United Arab Emirates 3D Optical Profiler Market Outlook, by Offering, 2020–2033
8.5.9. Saudi Arabia 3D Optical Profiler Market Outlook, by Technology, 2020–2033
8.5.10. Saudi Arabia 3D Optical Profiler Market Outlook, by Configuration, 2020–2033
8.5.11. Saudi Arabia 3D Optical Profiler Market Outlook, by End-Use Industry, 2020–2033
8.5.12. Saudi Arabia 3D Optical Profiler Market Outlook, by Offering, 2020–2033
8.5.13. Turkey 3D Optical Profiler Market Outlook, by Technology, 2020–2033
8.5.14. Turkey 3D Optical Profiler Market Outlook, by Configuration, 2020–2033
8.5.15. Turkey 3D Optical Profiler Market Outlook, by End-Use Industry, 2020–2033
8.5.16. Turkey 3D Optical Profiler Market Outlook, by Offering, 2020–2033
8.5.17. South Africa 3D Optical Profiler Market Outlook, by Technology, 2020–2033
8.5.18. South Africa 3D Optical Profiler Market Outlook, by Configuration, 2020–2033
8.5.19. South Africa 3D Optical Profiler Market Outlook, by End-Use Industry, 2020–2033
8.5.20. South Africa 3D Optical Profiler Market Outlook, by Offering, 2020–2033
9. Competitive Landscape
9.1. Market Concentration and Industry Leaders
9.2. Competitive Differentiation
9.3. Strategic Moves and Market Direction
9.4. Recent Industry Developments
9.5. Company Profiles
9.5.1. Bruker Corporation
9.5.2. Zygo Corporation
9.5.3. KLA Corporation
9.5.4. Keyence Corporation
9.5.5. Mitutoyo Corporation
9.5.6. Carl Zeiss AG
9.5.7. Sensofar Metrology
9.5.8. Polytec GmbH
9.5.9. Nanovea, Inc.
9.5.10. Evident Corporation
9.5.11. Nikon Corporation
9.5.12. Lyncée Tec SA
9.5.13. Onto Innovation Inc.
10. Appendix
10.1. Research Methodology
10.2. Report Assumptions
10.3. Acronyms and Abbreviations
| Technology | Coherence Scanning Interferometry, Phase-Shifting Interferometry, Confocal and Chromatic Confocal Microscopy, Focus Variation, Structured Illumination and Fringe Projection, Digital Holographic Microscopy |
| Configuration | Benchtop Laboratory Systems, Shop-Floor Systems, In-Line and Integrated Metrology Systems, Portable Systems |
| End-Use Industry | Semiconductor and Electronics, Precision Machining and Automotive, Medical Devices and Implants, Optics and Photonics Manufacturing, Additive Manufacturing, Academic and Research |
| Offering | Instruments, Analysis Software, Services, Calibration and Support |
| Regions | North America, Europe, Asia Pacific, Latin America, Middle East & Africa |
Our Research Methodology
Considering the volatility of business today, traditional approaches to strategizing a game plan can be unfruitful if not detrimental. True ambiguity is no way to determine a forecast. A myriad of predetermined factors must be accounted for such as the degree of risk involved, the magnitude of circumstances, as well as conditions or consequences that are not known or unpredictable. To circumvent binary views that cast uncertainty, the application of market research intelligence to strategically posture, move, and enable actionable outcomes is necessary.
View Methodology
Quality Assured
Rigorous Validation Process

Confidentiality Assured
End-to-end Data Security

Custom Research Services
Tailored To Your Objectives
FAQs
The market is valued at US$ 0.9 billion in 2026, covering non-contact optical instruments and software used for quantitative surface topography measurement.
The market is projected to reach US$ 1.6 billion by 2033, growing at an 8.6% CAGR and adding US$ 0.7 billion in absolute opportunity.
Coherence Scanning Interferometry leads with 31% share in 2026, because it combines very high vertical resolution with tolerance for rough surfaces.
In-Line and Integrated Metrology Systems grow fastest at a 12.9% CAGR, while Asia Pacific expands at an 11.4% CAGR on advanced packaging demand.
North America holds 34% share in 2026, and the market is moderately concentrated, with a small group of instrument makers holding most high-end revenue.
Related Reports
Medical Case Management Market Size, Share, Insights, Competitive Landscape, and Forecast 2026 to 2033
The global medical case management market is valued at US$5.98 billion in 2026, reaching US$9.26 billion by 2033, growing at a 6.4% CAGR
Drug Discovery Informatics Market Size, Share, Insights, Competitive Landscape, and Forecast 2026 to 2033
Drug discovery informatics market is forecast to grow from US$ 3.7 billion in 2026 to US$ 6.9 billion by 2033 at 9.3% CAGR, driven by AI and cloud adoption.
Medical Device Security Market Size, Share, Insights, Competitive Landscape, and Forecast 2026 to 2033
The global medical device security market is valued at US$6.8 billion in 2026, reaching US$12.0 billion by 2033, growing at an 8.4% CAGR
Healthcare IT Integration Market Size, Share, Insights, Competitive Landscape, and Forecast 2026 to 2033
The global healthcare IT integration market is valued at US$4.9 billion in 2026, reaching US$10.6 billion by 2033, growing at an 11.7% CAGR
Veterinary Telehealth Market Size, Share, Insights, Competitive Landscape, and Forecast 2026 to 2033
Veterinary telehealth market to grow from US$ 0.6 billion in 2026 to US$ 1.5 billion by 2033 at a 14.0% CAGR. Explore services, segments and regional insights.
Chemical Peel Market Size, Share, Insights, Competitive Landscape, and Forecast 2026 to 2033
The chemical peel market is projected to grow from US$2.4 billion in 2026 to US$4.3 billion by 2033, at an 8.7% CAGR. Explore segments and regional trends.