



Beeswax Market
Beeswax Market Size, Share, Insights, Competitive Landscape, and Forecast 2026 to 2033
What Is the Outlook for the Beeswax Market to 2033?
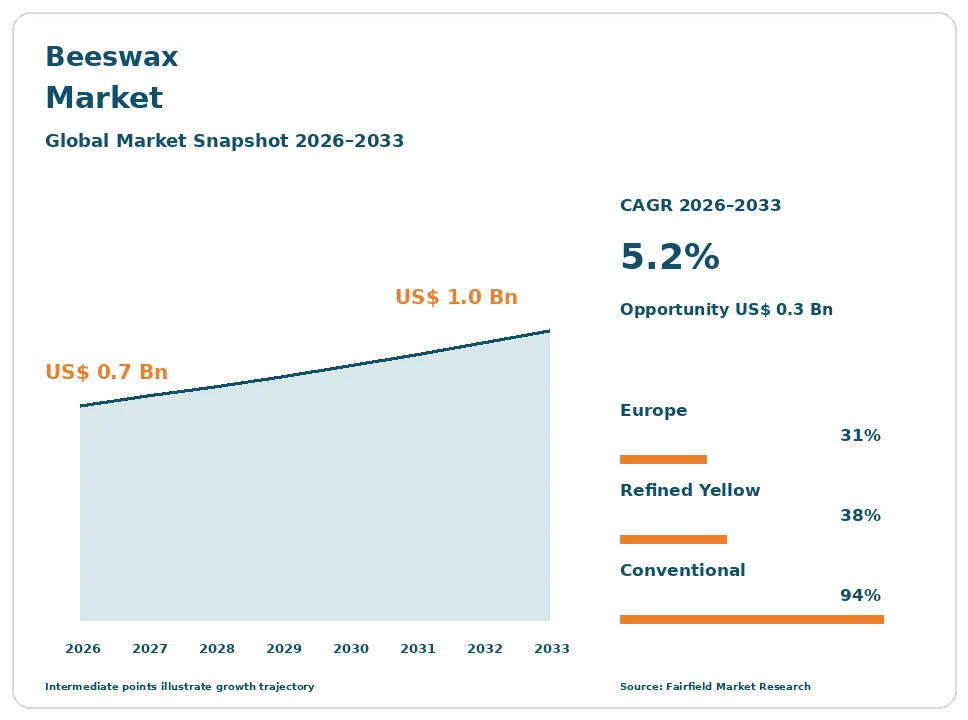
The global Beeswax market size is expected to be valued at US$ 0.7 billion in 2026 and projected to reach US$ 1.0 billion by 2033, growing at a CAGR of 5.2% between 2026 and 2033.
The market grew at a 4.1% CAGR between 2020 and 2025, ending near US$ 0.67 billion, and the ceiling on that growth was supply rather than orders. Beeswax is a co-product of honey production. A hive yields far more honey than wax, so available tonnage follows hive numbers and honey output, and it does not respond when wax prices rise. Demand meanwhile keeps widening across cosmetics, candles, pharmaceutical ointments, polishes and comb foundation sold back to beekeepers. The result is a small natural commodity with persistently tight supply, high and volatile prices, and a strong economic incentive to adulterate. Value growth therefore comes mostly from price and grade mix.
Key Report Takeaways
- By Product Type: Filtered and refined yellow beeswax held 38% share in 2026, while beeswax absolute and derivatives are projected to expand at a 6.9% CAGR through 2033, driven by fragrance extraction and by esterified and saponified grades used in emulsion systems.
- By Production Type: Conventional beeswax held 94% share in 2026, while organic beeswax is projected to grow at an 8.2% CAGR through 2033, limited less by buyer appetite than by the number of apiaries able to meet organic siting and treatment rules.
- By Application: Cosmetics and personal care held 31% share in 2026, while pharmaceuticals and ointments are projected to advance at a 6.6% CAGR through 2033, because monograph-compliant grades carry documentation that general-purpose wax cannot match.
- By Distribution Channel: Wax traders and processors held 41% share in 2026, while online and specialty retail is projected to rise at a 7.3% CAGR through 2033, serving small candle makers, cosmetic formulators and hobby beekeepers in pellet form.
- By Geography: Europe led with 31% share in 2026, while Asia Pacific is projected to grow at a 6.4% CAGR through 2033, supported by large hive populations in China, India and Vietnam and expanding regional cosmetic manufacturing.
Global Beeswax Market Trends and Insights
Drivers Impact Analysis
| Driver | Impact on CAGR Forecast | Geographic Relevance | Impact Timeline |
| Cosmetic formulation demand for a natural structuring and film-forming wax | High | Global, led by Europe and North America | Short term ≤2 years |
| Pharmacopoeial status securing beeswax as a qualified excipient in ointments and coatings | Medium | Europe, North America and Asia Pacific | Medium term 2–4 years |
Two forces account for most of the incremental demand expected for apicultural wax between 2026 and 2033.
Cosmetic Structuring Demand Keeps Beeswax Specified in Balms, Sticks and Emulsions
Cosmetic formulation is the largest single pull on refined beeswax. Chemists use it to set hardness in lip balms, lipsticks and deodorant sticks, to stabilise water-in-oil emulsions, and to leave an occlusive film on skin. Its melting range and plasticity are difficult to reproduce exactly with any single plant wax, so reformulation away from it usually means a blend of two or three substitutes and a new stability programme.
The mechanism is specification inertia combined with ingredient positioning. Beeswax carries a settled INCI designation as Cera Alba and Cera Flava, a long safety history and a familiar consumer name, which keeps it in approved formulations under the EU Cosmetic Products Regulation. Brands building natural and minimal ingredient lists keep specifying it, even as vegan ranges deliberately exclude it. Both trends run at once, and both are growing.
Pharmacopoeial Monographs Secure Beeswax as a Qualified Excipient for Ointment Bases
Pharmaceutical use is the second engine, and it is the most defensible part of the market because it rests on written standards. The European Pharmacopoeia monographs for yellow beeswax and white beeswax, together with the United States Pharmacopeia monograph, define identity, acid and ester values, melting range and purity. A formulation that cites a monograph grade cannot casually switch to an uncharacterised wax, so demand is sticky across the product’s registered life.
The causal factor is regulatory qualification rather than preference. Ointment bases, suppositories, medicated sticks, barrier creams and some tablet and sugar coatings use beeswax as a structuring or release-modifying excipient. Changing an excipient in a registered medicine requires variation filings and stability data, which is costly. Suppliers that hold drug master file documentation and consistent monograph compliance therefore retain accounts for years.
Restraints Impact Analysis
| Restraint | Impact on CAGR Forecast | Geographic Relevance | Impact Timeline |
| Supply fixed by hive numbers and honey output, with no production response to wax prices | High | Global | Long term ≥4 years |
| Adulteration with paraffin and stearin, and veterinary residue carry-over in recycled comb wax | High | Global, most documented in Europe and Asia Pacific | Short term ≤2 years |
The binding constraints are the physical inelasticity of supply and the testing burden created by that scarcity.
Hive Numbers and Honey Output Set Beeswax Volume, and Wax Prices Cannot Change That
Supply inelasticity is the defining constraint of this market. Nobody keeps bees for wax. A colony is managed for honey, pollination income, or both, and wax is what is scraped from cappings, burr comb and culled frames during that work. A hive yields many times more honey than wax by weight, so the quantity available each season is set by hive numbers, forage conditions and honey yields. When wax prices rise, no beekeeper can respond by producing more.
The underlying cause is biological and economic at once. Colony losses from varroa mite infestation, pesticide exposure, poor forage and extreme weather reduce hive numbers in several producing regions. Beekeeping margins are thin, and the labour of rendering and filtering wax is substantial relative to its value. Much wax is also retained on farm and recycled into comb foundation rather than sold.
Paraffin and Stearin Adulteration Forces Buyers to Test Every Lot of Beeswax
Tight supply and high prices have made adulteration a documented and persistent problem. Testing laboratories and regulators across several countries have repeatedly identified beeswax cut with paraffin, stearin or other fats, sometimes at high proportions. The commercial damage runs in two directions. Adulterated comb foundation performs poorly in the hive and has been associated with brood losses, so beekeepers now test incoming foundation. Cosmetic and pharmaceutical buyers separately need authenticated material to meet monograph and specification requirements.
A second compliance issue compounds it. Acaricides used against varroa are lipophilic and accumulate in wax, so residues concentrate in recycled comb. That constrains reuse of old comb, limits which lots can enter pharmaceutical and cosmetic grades, and interacts with EU rules on residues in products of animal origin. Together these make laboratory testing and documented traceability a standard purchasing condition rather than an option.
Market Opportunities
Authenticated and Traceable Beeswax Creates a Documented-Supply Premium Tier
Verified origin has become a product attribute that buyers will pay for. Because adulteration is widespread and residues are a known risk, suppliers that can present authentication results, residue screening and a traceable chain from named apiaries to the drum can price above the commodity market and hold contracts rather than compete lot by lot. Laboratories apply a range of approaches, including thermal, chromatographic and spectroscopic techniques, to distinguish genuine apicultural wax from paraffin and fat blends.
Cooperatives and processors that collect directly from beekeepers are best placed to capture this, since traceability has to start at the hive. Demand comes from cosmetic brands facing retailer ingredient audits, from pharmaceutical buyers needing monograph compliance, and from beekeeping suppliers selling comb foundation. Organic certification for apiculture adds a further premium tier where hive siting, forage and treatment conditions can be met.
Monograph and Cosmetic Grades Lift Revenue per Tonne Far Above Commodity Candle Wax
Grade mix is the clearest route to value growth in a market whose tonnage cannot expand. The same crude wax can be sold cheaply for polishes and candles, or refined, filtered, bleached and characterised to cosmetic or pharmacopoeial specification and sold for a multiple of that price. Beeswax absolute, recovered by solvent extraction for fragrance use, and esterified or saponified derivatives for emulsion systems sit higher still.
Refiners with filtration, bleaching, pastillation and analytical capability can capture this, as can collectors that integrate forward instead of shipping crude blocks. Demand comes from colour cosmetics and skincare formulators, from pharmaceutical manufacturers maintaining registered ointment bases, and from fragrance houses. Candle demand remains valuable as a branded premium segment, but it rewards appearance and scent rather than the documentation that commands the highest grade premiums.
Segment Analysis
By Product Type: Refined Yellow Beeswax Leads While Derivatives Grow Quickest
Filtered and refined yellow beeswax held 38% share in 2026, the largest product type, because it is the workhorse grade for cosmetics, candles, polishes and comb foundation and requires no bleaching step. Crude and raw wax ranks second by volume, bleached white beeswax serves colour-sensitive cosmetic and pharmaceutical uses, and comb foundation sheets sold back to beekeeping form a substantial captive segment. Beeswax absolute and derivatives are the fastest-growing product type at a 6.9% CAGR to 2033, from a small base. Absolute is extracted for fragrance, while esterified, saponified and fractionated derivatives give formulators emulsifying and texture properties that unmodified wax cannot provide. The implication is that processing capability, not access to crude wax alone, decides which suppliers capture margin as the raw material stays scarce.
By Production Type: Conventional Supply Dominates as Certified Organic Beeswax Expands
Conventional beeswax held 94% share in 2026, an overwhelming lead that reflects how beekeeping actually works. Most hives sit within flight range of conventional agriculture, and most beekeepers use synthetic acaricides against varroa, both of which rule out organic status. Organic beeswax is the fastest-growing production type at an 8.2% CAGR to 2033, constrained far more by certified supply than by buyer demand. Organic certification standards for apiculture govern hive siting relative to forage and pollution sources, permitted treatments, hive materials and the wax used in foundation, which is a demanding combination to maintain. Certified volumes come disproportionately from regions with extensive uncultivated forage. For buyers, the practical implication is that organic cosmetic and food formulations often have to be planned around confirmed wax allocation rather than assumed availability.
By Application: Cosmetics Lead Volume While Pharmaceutical Grades Grow Fastest
Cosmetics and personal care held 31% share in 2026, the largest application, drawing refined yellow and bleached white grades into balms, sticks, creams and colour cosmetics. Candles follow closely, with polishes and waxes, textiles and crafts, comb foundation for beekeeping, and food glazing and coating taking the remainder. The food glazing agent application, where beeswax is listed as E 901, is examined in a separate report and appears here only as a segment. Pharmaceuticals and ointments is the fastest-growing application at a 6.6% CAGR to 2033, because monograph-grade material carries identity, purity and residue documentation that general-purpose wax does not. Residue limits are the practical gatekeeper. The implication is that applications split by documentation requirement, and suppliers increasingly specialise at one end or the other rather than serving all of them.
By Distribution Channel: Traders and Processors Hold the Flow While Online Retail Expands
Wax traders and processors held 41% share in 2026, because beeswax reaches the market in small lots from very many producers and must be aggregated, rendered, filtered and graded before an industrial buyer will take it. Direct purchase from beekeepers and cooperatives is the second channel, used by processors and by beekeeping suppliers sourcing foundation stock, while ingredient distributors serve cosmetic and pharmaceutical formulators needing documentation. Online and specialty retail is the fastest-growing channel at a 7.3% CAGR to 2033, supplying small candle makers, independent cosmetic formulators and hobby beekeepers, usually in pellet or pastille form that needs no melting equipment. The commercial significance is that aggregation remains the hardest part of this supply chain, and whoever controls collection holds the strongest position on authenticity and traceability.
Geography Analysis
Import Reliance and Natural Formulation Demand Shape North America’s Beeswax Trade
North America accounted for 24% share in 2026 and is expected to grow at a 4.5% CAGR to 2033, the slowest of the five regions. The United States and Canada both operate substantial commercial beekeeping sectors, oriented heavily toward pollination services for almonds, fruit and vegetables, which means colonies are managed for hive strength and rental income rather than for wax yield. Domestic wax recovery therefore falls well short of industrial consumption, and refiners import crude and refined material. Demand is concentrated in cosmetics, personal care, premium candles and pharmaceutical ointment bases, supported by a well-established refining and specialty wax industry. Colony losses reported each season by beekeepers remain the principal uncertainty, since they set how much comb is culled and rendered into saleable wax.
Which Region Is Leading the Beeswax Market?
Europe leads the beeswax market with 31% share in 2026, growing at a 5.0% CAGR to 2033. Leadership rests on processing and specification rather than on hive numbers. The region hosts most of the world’s established wax refiners, and the European Pharmacopoeia monographs for yellow and white beeswax set the grading language used far beyond the bloc. Germany, France, Italy, Spain, Poland and Romania combine significant beekeeping with dense cosmetic, pharmaceutical and candle manufacturing. Regulation reinforces the position: the Cosmetic Products Regulation, rules on residues in products of animal origin, and organic apiculture standards all raise the documentation buyers expect. The main change under way is the normalisation of authenticity testing, with adulteration findings having moved laboratory analysis from an occasional check to routine incoming inspection.
Which Region Is Growing Fastest in the Beeswax Market?
Asia Pacific is the fastest-growing region in the beeswax market, advancing at a 6.4% CAGR to 2033 from 27% share in 2026. The region holds very large hive populations, with China and India among the largest honey producers in the world and Vietnam, Thailand and Australia adding substantial volumes. That gives it the deepest raw material base, much of which has historically been exported as crude or lightly processed blocks. Growth now comes from two directions at once: rising domestic consumption as cosmetic, personal care and candle manufacturing expands across China, India, Korea and Japan, and investment in local filtering, bleaching and pastillation capacity. The defining change is forward integration, as exporters move from selling crude wax toward supplying characterised grades with analytical documentation.
Honey Export Economics Determine Latin America’s Beeswax Recovery
Latin America held 10% share in 2026 and is forecast to grow at a 5.3% CAGR to 2033. Argentina, Brazil and Mexico are major honey exporters, and their wax recovery moves with that trade, since cappings wax accumulates wherever honey is extracted at scale. Chile and Uruguay add smaller volumes, and several countries supply organic-certified material from extensive, lightly treated apiaries. The barriers are structural: fragmented smallholder production that is costly to aggregate, limited domestic refining and analytical capacity, currency volatility on export contracts, and colony losses linked to pesticide exposure and drought. The clearest opportunity is cooperative-level rendering and filtration, which would allow producers to sell graded wax with traceability documentation instead of crude blocks priced at a discount.
African Hive Density and Gulf Demand Define Middle East & Africa
Middle East & Africa represented 8% share in 2026 and is projected to expand at a 5.1% CAGR to 2033. Ethiopia is among the largest beeswax producers in the world, with Tanzania, Kenya, Zambia and Angola also supplying significant volumes from traditional and transitional hives that yield proportionally more wax than modern frame systems. Much of that output is exported crude. Demand within the region is concentrated in the Gulf states, Turkey, Egypt and South Africa, across cosmetics, candles and traditional preparations. Barriers include limited rendering and refining infrastructure, inconsistent grading, long and costly logistics, and weak laboratory capacity. The opportunity is straightforward and well understood locally: refining closer to the hive would capture value that currently leaves the continent inside unprocessed blocks.
Competitive Landscape
The beeswax market is fragmented at the raw material end and concentrated at the processing end, which is the single most important thing to understand about its structure. Supply originates with millions of beekeepers worldwide, almost all of them small, selling cappings and cull comb in lots measured in kilograms. Aggregation passes through village collectors, cooperatives, honey packers and regional traders before reaching a refiner. At that point the field narrows sharply: a modest number of specialist wax refiners, mostly long-established family or privately held businesses in Europe and North America, handle the filtering, bleaching, characterisation and documentation that industrial buyers require. Consolidation has been slow, because the binding asset is collection relationships rather than capital equipment.
Competition rests on authenticity, consistency and documentation. Vendors are judged on verified absence of paraffin and stearin, conformity to European Pharmacopoeia and United States Pharmacopeia monographs where claimed, residue screening results, colour and odour consistency between lots, melting range control, organic and other certification status, and the ability to supply a stated volume through a poor season. Price matters, but a failed authenticity test costs far more than a price premium. New entrants appear mainly as origin-country processors moving forward into refining, and as traceability-focused cooperatives selling directly to cosmetic brands.
Strategic activity concentrates on securing collection and proving provenance. Participants invest in analytical laboratories, build direct relationships with beekeeping cooperatives, add pastillation and bleaching capacity, and develop organic and traceable sourcing programmes that stand up to customer audits.
Vendor strategy is converging on verified supply, since in a commodity that cannot be produced to order, trustworthy material is the only durable advantage.
Beeswax Industry Leaders
- Koster Keunen, LLC
- Strahl & Pitsch, Inc.
- Kahl GmbH & Co. KG
- Norevo GmbH
- Dadant & Sons, Inc.
Recent Industry Developments
- July 2013: The EU Cosmetic Products Regulation became fully applicable across member states – it fixed the safety assessment, responsible person and INCI labelling framework under which Cera Alba and Cera Flava are used in cosmetic products.
- January 2022: The European Union organic production regulation became applicable, including its specific rules for apiculture – it tightened the hive siting, forage, treatment and hive material conditions that certified organic beeswax must satisfy.
- 2024: The European Union adopted revised marketing rules for honey requiring the countries of origin to be declared on blends – it improves returns to domestic beekeeping, which is what determines how much wax is recovered.
Companies Covered in the Report
- Koster Keunen, LLC
- Strahl & Pitsch, Inc.
- Kahl GmbH & Co. KG
- Norevo GmbH
- Poth Hille & Co Ltd
- The British Wax Refining Company Ltd
- New Zealand Beeswax Ltd
- Dadant & Sons, Inc.
- Mann Lake Ltd.
- Betterbee, Inc.
- Stakich, Inc.
- Beeswax Co., LLC
- Dutchman’s Gold Inc.
Beeswax Market Report Scope
This report covers wax secreted by honey bees and recovered from hives and honey processing, including crude and raw beeswax, filtered and refined yellow beeswax, bleached white beeswax, absolute and derivatives, and comb foundation sheets, in conventional and organic supply. Use as a food glazing agent is examined in a separate report and is counted here only as a segment. The base year is 2025, and the forecast period runs from 2026 to 2033, valued in US$ Billion.
Product Type
- Crude and raw beeswax
- Filtered and refined yellow beeswax
- Bleached white beeswax
- Beeswax absolute and derivatives
- Comb foundation sheets
Production Type
- Conventional
- Organic
Application
- Cosmetics and personal care
- Candles
- Pharmaceuticals and ointments
- Food glazing and coating
- Polishes and waxes
- Textiles and crafts
- Beekeeping comb foundation
Distribution Channel
- Direct from beekeepers and cooperatives
- Wax traders and processors
- Ingredient distributors
- Online and specialty retail
Regions
- North America
- Europe
- Asia Pacific
- Latin America
- Middle East & Africa
Key Questions Answered in the Report
What is the current size of the beeswax market?
The beeswax market is valued at US$ 0.7 billion in 2026, covering crude, refined, bleached, derivative and comb foundation grades of apicultural wax.
What is the beeswax market forecast and CAGR to 2033?
The market is projected to reach US$ 1.0 billion by 2033, expanding at a 5.2% CAGR and adding US$ 0.3 billion in absolute value.
Which product type leads the beeswax market?
Filtered and refined yellow beeswax leads with 38% share in 2026, because it serves cosmetics, candles, polishes and comb foundation without a bleaching step.
Which segment and region are growing fastest?
Beeswax absolute and derivatives grow fastest among products at a 6.9% CAGR, while Asia Pacific leads regional growth at a 6.4% CAGR.
Which region holds the largest beeswax market share?
Europe holds the largest share at 31% in 2026, supported by its concentration of wax refiners and pharmacopoeial grading standards.
1. Executive Summary
1.1. Global Beeswax Market Snapshot
1.2. Future Projections, 2026-2033
1.3. Key Market Trends
1.4. Regional Snapshot
2. Market Overview
2.1. Market Definition and Report Scope
2.2. Historical Market Trends, 2020-2025
2.3. Market Dynamics
2.3.1. Drivers Impact Analysis
2.3.1.1. Cosmetic Structuring Demand Keeps Beeswax Specified in Balms, Sticks and Emulsions
2.3.1.2. Pharmacopoeial Monographs Secure Beeswax as a Qualified Excipient for Ointment Bases
2.3.2. Restraints Impact Analysis
2.3.2.1. Hive Numbers and Honey Output Set Beeswax Volume, and Wax Prices Cannot Change That
2.3.2.2. Paraffin and Stearin Adulteration Forces Buyers to Test Every Lot of Beeswax
2.3.3. Market Opportunities
2.3.3.1. Authenticated and Traceable Beeswax Creates a Documented-Supply Premium Tier
2.3.3.2. Monograph and Cosmetic Grades Lift Revenue per Tonne Far Above Commodity Candle Wax
3. Global Beeswax Market Outlook, 2020-2033
3.1. Global Beeswax Market Outlook, by Product Type, Value (US$ Billion), 2020-2033
3.1.1. Crude and raw beeswax
3.1.2. Filtered and refined yellow beeswax
3.1.3. Bleached white beeswax
3.1.4. Beeswax absolute and derivatives
3.1.5. Comb foundation sheets
3.2. Global Beeswax Market Outlook, by Production Type, Value (US$ Billion), 2020-2033
3.2.1. Conventional
3.2.2. Organic
3.3. Global Beeswax Market Outlook, by Application, Value (US$ Billion), 2020-2033
3.3.1. Cosmetics and personal care
3.3.2. Candles
3.3.3. Pharmaceuticals and ointments
3.3.4. Food glazing and coating
3.3.5. Polishes and waxes
3.3.6. Textiles and crafts
3.3.7. Beekeeping comb foundation
3.4. Global Beeswax Market Outlook, by Distribution Channel, Value (US$ Billion), 2020-2033
3.4.1. Direct from beekeepers and cooperatives
3.4.2. Wax traders and processors
3.4.3. Ingredient distributors
3.4.4. Online and specialty retail
3.5. Global Beeswax Market Outlook, by Region, Value (US$ Billion), 2020-2033
3.5.1. North America
3.5.2. Europe
3.5.3. Asia Pacific
3.5.4. Latin America
3.5.5. Middle East & Africa
4. North America Beeswax Market Outlook, 2020-2033
4.1. North America Beeswax Market Outlook, by Product Type, Value (US$ Billion), 2020-2033
4.1.1. Crude and raw beeswax
4.1.2. Filtered and refined yellow beeswax
4.1.3. Bleached white beeswax
4.1.4. Beeswax absolute and derivatives
4.1.5. Comb foundation sheets
4.2. North America Beeswax Market Outlook, by Production Type, Value (US$ Billion), 2020-2033
4.2.1. Conventional
4.2.2. Organic
4.3. North America Beeswax Market Outlook, by Application, Value (US$ Billion), 2020-2033
4.3.1. Cosmetics and personal care
4.3.2. Candles
4.3.3. Pharmaceuticals and ointments
4.3.4. Food glazing and coating
4.3.5. Polishes and waxes
4.3.6. Textiles and crafts
4.3.7. Beekeeping comb foundation
4.4. North America Beeswax Market Outlook, by Distribution Channel, Value (US$ Billion), 2020-2033
4.4.1. Direct from beekeepers and cooperatives
4.4.2. Wax traders and processors
4.4.3. Ingredient distributors
4.4.4. Online and specialty retail
4.5. North America Beeswax Market Outlook, by Country, Value (US$ Billion), 2020-2033
4.5.1. United States Beeswax Market Outlook, by Product Type, 2020-2033
4.5.2. United States Beeswax Market Outlook, by Production Type, 2020-2033
4.5.3. United States Beeswax Market Outlook, by Application, 2020-2033
4.5.4. United States Beeswax Market Outlook, by Distribution Channel, 2020-2033
4.5.5. Canada Beeswax Market Outlook, by Product Type, 2020-2033
4.5.6. Canada Beeswax Market Outlook, by Production Type, 2020-2033
4.5.7. Canada Beeswax Market Outlook, by Application, 2020-2033
4.5.8. Canada Beeswax Market Outlook, by Distribution Channel, 2020-2033
5. Europe Beeswax Market Outlook, 2020-2033
5.1. Europe Beeswax Market Outlook, by Product Type, Value (US$ Billion), 2020-2033
5.1.1. Crude and raw beeswax
5.1.2. Filtered and refined yellow beeswax
5.1.3. Bleached white beeswax
5.1.4. Beeswax absolute and derivatives
5.1.5. Comb foundation sheets
5.2. Europe Beeswax Market Outlook, by Production Type, Value (US$ Billion), 2020-2033
5.2.1. Conventional
5.2.2. Organic
5.3. Europe Beeswax Market Outlook, by Application, Value (US$ Billion), 2020-2033
5.3.1. Cosmetics and personal care
5.3.2. Candles
5.3.3. Pharmaceuticals and ointments
5.3.4. Food glazing and coating
5.3.5. Polishes and waxes
5.3.6. Textiles and crafts
5.3.7. Beekeeping comb foundation
5.4. Europe Beeswax Market Outlook, by Distribution Channel, Value (US$ Billion), 2020-2033
5.4.1. Direct from beekeepers and cooperatives
5.4.2. Wax traders and processors
5.4.3. Ingredient distributors
5.4.4. Online and specialty retail
5.5. Europe Beeswax Market Outlook, by Country, Value (US$ Billion), 2020-2033
5.5.1. Germany Beeswax Market Outlook, by Product Type, 2020-2033
5.5.2. Germany Beeswax Market Outlook, by Production Type, 2020-2033
5.5.3. Germany Beeswax Market Outlook, by Application, 2020-2033
5.5.4. Germany Beeswax Market Outlook, by Distribution Channel, 2020-2033
5.5.5. France Beeswax Market Outlook, by Product Type, 2020-2033
5.5.6. France Beeswax Market Outlook, by Production Type, 2020-2033
5.5.7. France Beeswax Market Outlook, by Application, 2020-2033
5.5.8. France Beeswax Market Outlook, by Distribution Channel, 2020-2033
5.5.9. Italy Beeswax Market Outlook, by Product Type, 2020-2033
5.5.10. Italy Beeswax Market Outlook, by Production Type, 2020-2033
5.5.11. Italy Beeswax Market Outlook, by Application, 2020-2033
5.5.12. Italy Beeswax Market Outlook, by Distribution Channel, 2020-2033
5.5.13. Spain Beeswax Market Outlook, by Product Type, 2020-2033
5.5.14. Spain Beeswax Market Outlook, by Production Type, 2020-2033
5.5.15. Spain Beeswax Market Outlook, by Application, 2020-2033
5.5.16. Spain Beeswax Market Outlook, by Distribution Channel, 2020-2033
5.5.17. Poland Beeswax Market Outlook, by Product Type, 2020-2033
5.5.18. Poland Beeswax Market Outlook, by Production Type, 2020-2033
5.5.19. Poland Beeswax Market Outlook, by Application, 2020-2033
5.5.20. Poland Beeswax Market Outlook, by Distribution Channel, 2020-2033
5.5.21. Romania Beeswax Market Outlook, by Product Type, 2020-2033
5.5.22. Romania Beeswax Market Outlook, by Production Type, 2020-2033
5.5.23. Romania Beeswax Market Outlook, by Application, 2020-2033
5.5.24. Romania Beeswax Market Outlook, by Distribution Channel, 2020-2033
6. Asia Pacific Beeswax Market Outlook, 2020-2033
6.1. Asia Pacific Beeswax Market Outlook, by Product Type, Value (US$ Billion), 2020-2033
6.1.1. Crude and raw beeswax
6.1.2. Filtered and refined yellow beeswax
6.1.3. Bleached white beeswax
6.1.4. Beeswax absolute and derivatives
6.1.5. Comb foundation sheets
6.2. Asia Pacific Beeswax Market Outlook, by Production Type, Value (US$ Billion), 2020-2033
6.2.1. Conventional
6.2.2. Organic
6.3. Asia Pacific Beeswax Market Outlook, by Application, Value (US$ Billion), 2020-2033
6.3.1. Cosmetics and personal care
6.3.2. Candles
6.3.3. Pharmaceuticals and ointments
6.3.4. Food glazing and coating
6.3.5. Polishes and waxes
6.3.6. Textiles and crafts
6.3.7. Beekeeping comb foundation
6.4. Asia Pacific Beeswax Market Outlook, by Distribution Channel, Value (US$ Billion), 2020-2033
6.4.1. Direct from beekeepers and cooperatives
6.4.2. Wax traders and processors
6.4.3. Ingredient distributors
6.4.4. Online and specialty retail
6.5. Asia Pacific Beeswax Market Outlook, by Country, Value (US$ Billion), 2020-2033
6.5.1. China Beeswax Market Outlook, by Product Type, 2020-2033
6.5.2. China Beeswax Market Outlook, by Production Type, 2020-2033
6.5.3. China Beeswax Market Outlook, by Application, 2020-2033
6.5.4. China Beeswax Market Outlook, by Distribution Channel, 2020-2033
6.5.5. India Beeswax Market Outlook, by Product Type, 2020-2033
6.5.6. India Beeswax Market Outlook, by Production Type, 2020-2033
6.5.7. India Beeswax Market Outlook, by Application, 2020-2033
6.5.8. India Beeswax Market Outlook, by Distribution Channel, 2020-2033
6.5.9. Vietnam Beeswax Market Outlook, by Product Type, 2020-2033
6.5.10. Vietnam Beeswax Market Outlook, by Production Type, 2020-2033
6.5.11. Vietnam Beeswax Market Outlook, by Application, 2020-2033
6.5.12. Vietnam Beeswax Market Outlook, by Distribution Channel, 2020-2033
6.5.13. Thailand Beeswax Market Outlook, by Product Type, 2020-2033
6.5.14. Thailand Beeswax Market Outlook, by Production Type, 2020-2033
6.5.15. Thailand Beeswax Market Outlook, by Application, 2020-2033
6.5.16. Thailand Beeswax Market Outlook, by Distribution Channel, 2020-2033
6.5.17. Australia Beeswax Market Outlook, by Product Type, 2020-2033
6.5.18. Australia Beeswax Market Outlook, by Production Type, 2020-2033
6.5.19. Australia Beeswax Market Outlook, by Application, 2020-2033
6.5.20. Australia Beeswax Market Outlook, by Distribution Channel, 2020-2033
6.5.21. Korea Beeswax Market Outlook, by Product Type, 2020-2033
6.5.22. Korea Beeswax Market Outlook, by Production Type, 2020-2033
6.5.23. Korea Beeswax Market Outlook, by Application, 2020-2033
6.5.24. Korea Beeswax Market Outlook, by Distribution Channel, 2020-2033
6.5.25. Japan Beeswax Market Outlook, by Product Type, 2020-2033
6.5.26. Japan Beeswax Market Outlook, by Production Type, 2020-2033
6.5.27. Japan Beeswax Market Outlook, by Application, 2020-2033
6.5.28. Japan Beeswax Market Outlook, by Distribution Channel, 2020-2033
7. Latin America Beeswax Market Outlook, 2020-2033
7.1. Latin America Beeswax Market Outlook, by Product Type, Value (US$ Billion), 2020-2033
7.1.1. Crude and raw beeswax
7.1.2. Filtered and refined yellow beeswax
7.1.3. Bleached white beeswax
7.1.4. Beeswax absolute and derivatives
7.1.5. Comb foundation sheets
7.2. Latin America Beeswax Market Outlook, by Production Type, Value (US$ Billion), 2020-2033
7.2.1. Conventional
7.2.2. Organic
7.3. Latin America Beeswax Market Outlook, by Application, Value (US$ Billion), 2020-2033
7.3.1. Cosmetics and personal care
7.3.2. Candles
7.3.3. Pharmaceuticals and ointments
7.3.4. Food glazing and coating
7.3.5. Polishes and waxes
7.3.6. Textiles and crafts
7.3.7. Beekeeping comb foundation
7.4. Latin America Beeswax Market Outlook, by Distribution Channel, Value (US$ Billion), 2020-2033
7.4.1. Direct from beekeepers and cooperatives
7.4.2. Wax traders and processors
7.4.3. Ingredient distributors
7.4.4. Online and specialty retail
7.5. Latin America Beeswax Market Outlook, by Country, Value (US$ Billion), 2020-2033
7.5.1. Argentina Beeswax Market Outlook, by Product Type, 2020-2033
7.5.2. Argentina Beeswax Market Outlook, by Production Type, 2020-2033
7.5.3. Argentina Beeswax Market Outlook, by Application, 2020-2033
7.5.4. Argentina Beeswax Market Outlook, by Distribution Channel, 2020-2033
7.5.5. Brazil Beeswax Market Outlook, by Product Type, 2020-2033
7.5.6. Brazil Beeswax Market Outlook, by Production Type, 2020-2033
7.5.7. Brazil Beeswax Market Outlook, by Application, 2020-2033
7.5.8. Brazil Beeswax Market Outlook, by Distribution Channel, 2020-2033
7.5.9. Mexico Beeswax Market Outlook, by Product Type, 2020-2033
7.5.10. Mexico Beeswax Market Outlook, by Production Type, 2020-2033
7.5.11. Mexico Beeswax Market Outlook, by Application, 2020-2033
7.5.12. Mexico Beeswax Market Outlook, by Distribution Channel, 2020-2033
7.5.13. Chile Beeswax Market Outlook, by Product Type, 2020-2033
7.5.14. Chile Beeswax Market Outlook, by Production Type, 2020-2033
7.5.15. Chile Beeswax Market Outlook, by Application, 2020-2033
7.5.16. Chile Beeswax Market Outlook, by Distribution Channel, 2020-2033
7.5.17. Uruguay Beeswax Market Outlook, by Product Type, 2020-2033
7.5.18. Uruguay Beeswax Market Outlook, by Production Type, 2020-2033
7.5.19. Uruguay Beeswax Market Outlook, by Application, 2020-2033
7.5.20. Uruguay Beeswax Market Outlook, by Distribution Channel, 2020-2033
8. Middle East & Africa Beeswax Market Outlook, 2020-2033
8.1. Middle East & Africa Beeswax Market Outlook, by Product Type, Value (US$ Billion), 2020-2033
8.1.1. Crude and raw beeswax
8.1.2. Filtered and refined yellow beeswax
8.1.3. Bleached white beeswax
8.1.4. Beeswax absolute and derivatives
8.1.5. Comb foundation sheets
8.2. Middle East & Africa Beeswax Market Outlook, by Production Type, Value (US$ Billion), 2020-2033
8.2.1. Conventional
8.2.2. Organic
8.3. Middle East & Africa Beeswax Market Outlook, by Application, Value (US$ Billion), 2020-2033
8.3.1. Cosmetics and personal care
8.3.2. Candles
8.3.3. Pharmaceuticals and ointments
8.3.4. Food glazing and coating
8.3.5. Polishes and waxes
8.3.6. Textiles and crafts
8.3.7. Beekeeping comb foundation
8.4. Middle East & Africa Beeswax Market Outlook, by Distribution Channel, Value (US$ Billion), 2020-2033
8.4.1. Direct from beekeepers and cooperatives
8.4.2. Wax traders and processors
8.4.3. Ingredient distributors
8.4.4. Online and specialty retail
8.5. Middle East & Africa Beeswax Market Outlook, by Country and Subregion, Value (US$ Billion), 2020-2033
8.5.1. Ethiopia Beeswax Market Outlook, by Product Type, 2020-2033
8.5.2. Ethiopia Beeswax Market Outlook, by Production Type, 2020-2033
8.5.3. Ethiopia Beeswax Market Outlook, by Application, 2020-2033
8.5.4. Ethiopia Beeswax Market Outlook, by Distribution Channel, 2020-2033
8.5.5. Tanzania Beeswax Market Outlook, by Product Type, 2020-2033
8.5.6. Tanzania Beeswax Market Outlook, by Production Type, 2020-2033
8.5.7. Tanzania Beeswax Market Outlook, by Application, 2020-2033
8.5.8. Tanzania Beeswax Market Outlook, by Distribution Channel, 2020-2033
8.5.9. Kenya Beeswax Market Outlook, by Product Type, 2020-2033
8.5.10. Kenya Beeswax Market Outlook, by Production Type, 2020-2033
8.5.11. Kenya Beeswax Market Outlook, by Application, 2020-2033
8.5.12. Kenya Beeswax Market Outlook, by Distribution Channel, 2020-2033
8.5.13. Zambia Beeswax Market Outlook, by Product Type, 2020-2033
8.5.14. Zambia Beeswax Market Outlook, by Production Type, 2020-2033
8.5.15. Zambia Beeswax Market Outlook, by Application, 2020-2033
8.5.16. Zambia Beeswax Market Outlook, by Distribution Channel, 2020-2033
8.5.17. Angola Beeswax Market Outlook, by Product Type, 2020-2033
8.5.18. Angola Beeswax Market Outlook, by Production Type, 2020-2033
8.5.19. Angola Beeswax Market Outlook, by Application, 2020-2033
8.5.20. Angola Beeswax Market Outlook, by Distribution Channel, 2020-2033
8.5.21. Gulf states Beeswax Market Outlook, by Product Type, 2020-2033
8.5.22. Gulf states Beeswax Market Outlook, by Production Type, 2020-2033
8.5.23. Gulf states Beeswax Market Outlook, by Application, 2020-2033
8.5.24. Gulf states Beeswax Market Outlook, by Distribution Channel, 2020-2033
8.5.25. Turkey Beeswax Market Outlook, by Product Type, 2020-2033
8.5.26. Turkey Beeswax Market Outlook, by Production Type, 2020-2033
8.5.27. Turkey Beeswax Market Outlook, by Application, 2020-2033
8.5.28. Turkey Beeswax Market Outlook, by Distribution Channel, 2020-2033
8.5.29. Egypt Beeswax Market Outlook, by Product Type, 2020-2033
8.5.30. Egypt Beeswax Market Outlook, by Production Type, 2020-2033
8.5.31. Egypt Beeswax Market Outlook, by Application, 2020-2033
8.5.32. Egypt Beeswax Market Outlook, by Distribution Channel, 2020-2033
8.5.33. South Africa Beeswax Market Outlook, by Product Type, 2020-2033
8.5.34. South Africa Beeswax Market Outlook, by Production Type, 2020-2033
8.5.35. South Africa Beeswax Market Outlook, by Application, 2020-2033
8.5.36. South Africa Beeswax Market Outlook, by Distribution Channel, 2020-2033
9. Competitive Landscape
9.1. Market Concentration and Industry Leaders
9.2. Competitive Differentiation
9.3. Strategic Initiatives
9.4. Recent Industry Developments
9.5. Company Profiles
9.5.1. Koster Keunen, LLC
9.5.2. Strahl & Pitsch, Inc.
9.5.3. Kahl GmbH & Co. KG
9.5.4. Norevo GmbH
9.5.5. Poth Hille & Co Ltd
9.5.6. The British Wax Refining Company Ltd
9.5.7. New Zealand Beeswax Ltd
9.5.8. Dadant & Sons, Inc.
9.5.9. Mann Lake Ltd.
9.5.10. Betterbee, Inc.
9.5.11. Stakich, Inc.
9.5.12. Beeswax Co., LLC
9.5.13. Dutchman's Gold Inc.
10. Appendix
10.1. Research Methodology
10.2. Report Assumptions
10.3. Acronyms and Abbreviations
| Product Type | Crude and raw beeswax, Filtered and refined yellow beeswax, Bleached white beeswax, Beeswax absolute and derivatives, Comb foundation sheets |
| Production Type | Conventional, Organic |
| Application | Cosmetics and personal care, Candles, Pharmaceuticals and ointments, Food glazing and coating, Polishes and waxes, Textiles and crafts, Beekeeping comb foundation |
| Distribution Channel | Direct from beekeepers and cooperatives, Wax traders and processors, Ingredient distributors, Online and specialty retail |
| Regions | North America, Europe, Asia Pacific, Latin America, Middle East & Africa |
Our Research Methodology
Considering the volatility of business today, traditional approaches to strategizing a game plan can be unfruitful if not detrimental. True ambiguity is no way to determine a forecast. A myriad of predetermined factors must be accounted for such as the degree of risk involved, the magnitude of circumstances, as well as conditions or consequences that are not known or unpredictable. To circumvent binary views that cast uncertainty, the application of market research intelligence to strategically posture, move, and enable actionable outcomes is necessary.
View Methodology
Quality Assured
Rigorous Validation Process

Confidentiality Assured
End-to-end Data Security

Custom Research Services
Tailored To Your Objectives
FAQs
The beeswax market is valued at US$ 0.7 billion in 2026, covering crude, refined, bleached, derivative and comb foundation grades of apicultural wax.
The market is projected to reach US$ 1.0 billion by 2033, expanding at a 5.2% CAGR and adding US$ 0.3 billion in absolute value.
Filtered and refined yellow beeswax leads with 38% share in 2026, because it serves cosmetics, candles, polishes and comb foundation without a bleaching step.
Beeswax absolute and derivatives grow fastest among products at a 6.9% CAGR, while Asia Pacific leads regional growth at a 6.4% CAGR.
Europe holds the largest share at 31% in 2026, supported by its concentration of wax refiners and pharmacopoeial grading standards.
Related Reports
Yeast Protein Market Size, Share, Insights, Competitive Landscape, and Forecast 2026 to 2033
The global yeast protein market is valued at US$0.9 billion in 2026, reaching US$2.0 billion by 2033, growing at a 12.1% CAGR
Starch Derivatives Market Size, Share, Insights, Competitive Landscape, and Forecast 2026 to 2033
The global starch derivatives market is valued at US$62.5 billion in 2026, reaching US$88.0 billion by 2033, growing at a 5.0% CAGR
Quick Service Restaurants Market Size, Share, Insights, Competitive Landscape, and Forecast 2026 to 2033
The global quick service restaurants market is valued at US$1,090.0 billion in 2026, reaching US$1,556.0 billion by 2033, growing at a 5.2% CAGR
Plant Extracts Market Size, Share, Insights, Competitive Landscape, and Forecast 2026 to 2033
The global plant extracts market is valued at US$42.0 billion in 2026, reaching US$68.5 billion by 2033, growing at a 7.2% CAGR
Kombucha Market Size, Share, Insights, Competitive Landscape, and Forecast 2026 to 2033
The Kombucha Market is projected to grow from US$ 3.2 billion in 2026 to US$ 4.8 billion by 2033 at a 6.0% CAGR. Explore trends and leading segments.
Insect Protein Market Size, Share, Insights, Competitive Landscape, and Forecast 2026 to 2033
Insect Protein Market is projected to grow from US$ 1.03 billion in 2026 to US$ 3.17 billion by 2033 at a 17.4% CAGR. Explore trends and key segments.