Carbon Black Market Outlook
Global Carbon Black Market Becomes Integral Part of Modern Automotive Culture
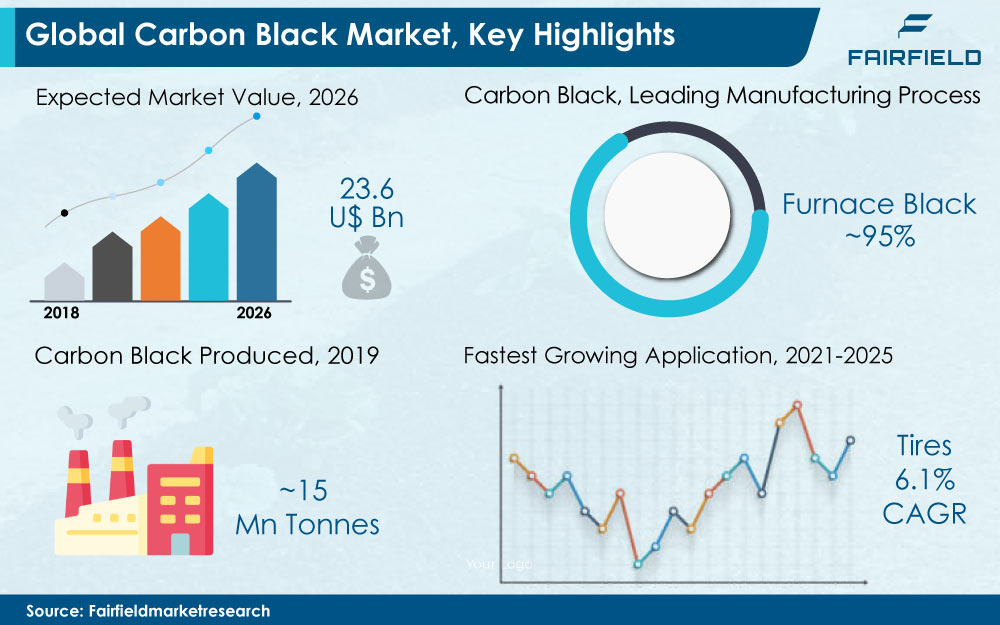
Modern tires with carbon black reinforcement drive extra miles as compared to older tires that need to be changed after every 5,000 kms. Carbon black allows new age tires to perform even after running for 50,000 kms. The automotive industry has witnessed a remarkable change with the uptake of carbon black. In the recent study conducted by Fairfield Market Research, the carbon black market was valued at US$17.4 Bn in 2018 and it is expected to reach US$23.6 Bn by 2025, registering a healthy CAGR of 6.5% between 2021 and 2025. Today, carbon black is a vital element in production of many products that are used in our day-to-day life, wherein stronger and deeper black colour is desired. This fine black powder composed of elemental carbon is made by burning hydrocarbons such as coal tar, ethylene tar, fluid catalytic cracking (FCC) tar, or charred vegetable matter.

Carbon black is manufactured by partial combustion and pyrolysis of low-value oil residues usually derived from coal or crude oils at elevated temperatures under controlled conditions. More than 95% of the carbon black is manufactured through furnace black process. Carbon black is primarily used as reinforcement agent, but is also used as pigment, conductive or insulating agent, rheology modifier, and UV stabilizer in variety of rubber and non-rubber applications. These areas of application continue to drive the growth of global carbon black market. In many places, carbon black is used as an additive to augment material performance including viscosity, conductivity, and static charge control. Wide application of in rubber tires, industrial rubber goods, and automotive rubber parts as a reinforcing agent or as colouring agent in inks, paints & coatings, plastics, wire and cables further maintain the buoyancy of carbon black market.
Specialty Carbon Black Finds Lucrative Growth Prospects Compared to Commodities in Carbon Black Market
Carbon black is widely consumed in three grades: rubber carbon black, mechanical rubber goods (MRG), and specialty carbon black. It is estimated that around 15 million tonnes of carbon black was produced in 2019. In the past few years, there has been burgeoning demand for specialty carbon black. Currently, this segment of carbon black market is niche and accounts for around 8% of the total volume; however, these are products with higher realizations and margins command higher prices compared to commodity carbon black such as rubber carbon black, and MRG. Specialty carbon blacks remains sought-after in carbon black market owing to the use as black pigmenting, conductive, and UV stabilizing agents to enhance material performances in paints, printing ink toners, plastics, batteries, wire and cables, sealant systems, and solid carbons. Specialty carbon blacks are also used in negative electrode in lead-acid batteries and for both the electrodes in Li-ion batteries, thus improving conductivity, power performance, and life cycle of batteries.
Rubber carbon black is one of the most widely used grade and along with MRG accounted for more than 92% of the total carbon black market. Its cost-effectiveness makes it ideal for tire components such as sidewalls, treads, and inner liners. This type of carbon black is used to improve strength, durability, and processing of high-performance tires and other industrial rubber goods. The automotive tire market is poised to register at a CAGR of 4.5% between 2021-2025 supported by strong demand from automotive production and adoption of high-performance and premium tires. The demand for carbon black in tire industry is also bolstered by rise in sales of tire replacements. Growth in radialization of tires and consumers demanding tire pressure monitoring systems into the vehicles will drive the tire replacement demand thus offering lucrative opportunities for the global carbon black market.
Tires Key Consumer Segment in Global Carbon Black Market
The tire industry is one of the largest consumers of carbon black accounting for more than 70% of the global demand in 2019. Increasing disposable incomes in developing economies is anticipated to spur the growth of new vehicles, thus driving the demand for carbon black in the tire industry. Expanding economic activities is anticipated to soar vehicles miles travelled (VMT) per year, thus encouraging tire replacement rates. The demand for carbon black in the tire industry is likely to be driven by revival of significant growth in tire replacement market. Tire replacement accounts for more than 2/3rd of the total tire demand, especially in developed economies. Key factors such as increase in the middle-class population in industrialized countries is resulting in rise of vehicle ownerships, rapid changes in electric vehicles, and adoption to shared transportation, driverless technology are projected to drive the transportation industry, thus soaring the demand of carbon black in tire industry, in turn driving the carbon black market forward.
Industrial and mechanical rubber goods are also major applications of carbon black. These applications consume MRG as well as specialty carbon blacks. Carbon black is employed in mechanical rubber goods (conveyer belts, hoses, gaskets & seals), automotive rubber parts (anti-vibration parts, sealant systems, wiper blades, fascia), electronic packaging films, and shoe soles. The global carbon black market has also observed significant growth in niche applications such as printing inks, paints, plastics, wires & cables plastics, and consumer goods. These applications typically consume specialty carbon black, one of the fastest-growing product types in the carbon black market.
China Continues Dominance in Global Carbon Black Market
Asia Pacific accounted for more than 60% of the demand for carbon black in 2019. The production cost is lowest in the region owing to availability low-priced feedstock and lower labor rates. The region has vast coal resources and hence distilled coal tar is the mostly widely feedstock, thus making the pricing economical compared to other regions. China accounts for more than 40% of the total carbon black production. In the past few years, a lot of investment in tire industry has been observed in India, Thailand, and Indonesia. Revival of the automotive industry, especially growth in passenger and light commercial vehicles, supported by economic recoveries in the region will boost the tire consumption, thus in turn lifting the demand for caron black, thereby pushing prospects of carbon black market.
Europe is anticipated to exhibit stable demand for both rubber and MRG carbon black. However, rising demand for conductive additives from paints, plastics, inks, and especially EV batteries will fuel the demand for high-value specialty carbon black. Specialty carbon black is likely to play vital role in EU’s ‘Smart and Sustainable Mobility Strategy’ of getting 30 million EVs by the end of this decade. Specialty carbon black is crucial to support an electronically conductive path in batteries and are critical to the performance of Li-ion batteries. This would remain a major growth influencer for carbon black market.
Companies in Carbon Black Market Focus on Cleaner, Renewable Sources for Production
The global carbon black market is diversified with multinational companies such as Cabot Corporation, Birla Carbon, Orion Engineered Carbons, Jiangxi Black Cat Carbon, and Tokai Carbon Co., Ltd. battling out with players having strong regional influence. These companies are competing based on price, production performance, and quality of the product. In the past few years, companies have started focusing on technological advancements in the process and integrate cleaner, renewable sources to produce carbon black. In 2021, Monolith Materials, announced new investments to support its growth plan in carbon black area. The company with its proprietary technology uses renewable energy to convert natural gas into carbon black. The company expect to reduce GHG emissions by as much as 1 million tons annually as compared to traditional production processes.
The Global Carbon Black Market is Segmented as Below:
By Product Coverage
- Rubber Carbon Black
- MGR
- Specialty Black
By Application Coverage
- Tires
- Rubber Goods
- Plastics
- Inks & Toners
- Batteries
- Paints & Coatings
- Misc. (Wires & Cables, Consumer Goods, etc.)
By Geographical Coverage
- North America
- U.S.
- Canada
- Europe
- Germany
- France
- UK
- Italy
- Turkey
- Spain
- Russia
- Rest of Europe
- Asia Pacific
- China
- Japan
- South Korea
- India
- Southeast Asia
- Rest of Asia Pacific
- Latin America
- Brazil
- Mexico
- Rest of Latin America
- Middle East & Africa
- GCC
- Egypt
- Rest of Middle East & Africa
Leading Companies
- Cabot Corporation
- Birla Carbon
- Orion Engineered Carbons
- Jiangxi Black Cat Carbon
- Tokai Carbon
- CSRC Group
- Phillips Carbon Black Ltd
- OMSK Carbon
- JSC
- Asahi Carbon Co. Ltd.
- Himadri Speciality Chemical Limited
Inside This Report You Will Find:
1. Executive Summary
2. Market Overview
3. Production Output and Trade Statistics
4. Price Trends Analysis and Future Projects, 2017 - 2025
5. Global Carbon Black Market Outlook, 2017 - 2025
6. North America Carbon Black Market Outlook, 2017 - 2025
7. Europe Carbon Black Market Outlook, 2017 - 2025
8. Asia Pacific Carbon Black Market Outlook, 2017 - 2025
9. Latin America Carbon Black Market Outlook, 2017 - 2025
10. Middle East & Africa Carbon Black Market Outlook, 2017 - 2025
11. Competitive Landscape
12. Appendix
Post Sale Support, Research Updates & Offerings:
We value the trust shown by our customers in Fairfield Market Research. We support our clients through our post sale support, research updates and offerings.
- The report will be prepared in a PPT format and will be delivered in a PDF format.
- Additionally, Market Estimation and Forecast numbers will be shared in Excel Workbook.
- If a report being sold was published over a year ago, we will offer a complimentary copy of the updated research report along with Market Estimation and Forecast numbers within 2-3 weeks’ time of the sale.
- If we update this research study within the next 2 quarters, post purchase of the report, we will offer a Complimentary copy of the updated Market Estimation and Forecast numbers in Excel Workbook.
- If there is a geopolitical conflict, pandemic, recession, and the like which can impact global economic scenario and business activity, which might entirely alter the market dynamics or future projections in the industry, we will create a Research Update upon your request at a nominal charge.
1. Executive Summary
1.1. Global Carbon Black Market Snapshot
1.2. Future Projections
1.3. Key Market Trends
1.4. Analyst Recommendations
2. Market Overview
2.1. Market Definitions and Segmentations
2.2. Market Dynamics
2.2.1. Drivers
2.2.2. Restraints
2.2.3. Market Opportunities
2.3. Value Chain Analysis
2.4. Porter’s Five Forces Analysis
2.5. Covid-19 Impact Analysis
2.5.1. Supply
2.5.2. Demand
2.6. Economic Overview
3. Production Output and Trade Statistics
4. Price Trends Analysis and Future Projects, 2017 - 2025
4.1. Price Trends Analysis and Future Projects, 2017 - 2025
4.2. Global Average Price Analysis, by Product vs Application, US$ per Kg
5. Global Carbon Black Market Outlook, 2017 - 2025
5.1. Global Carbon Black Market Outlook, by Product, Volume (Kilo Tons) and Value (US$ Mn), 2017 - 2025
5.1.1. Key Highlights
5.1.1.1. Rubber Carbon Black
5.1.1.2. MGR
5.1.1.3. Specialty Black
5.2. Global Carbon Black Market Outlook, by Application, Volume (Kilo Tons) and Value (US$ Mn), 2017 - 2025
5.2.1. Key Highlights
5.2.1.1. Tires
5.2.1.2. Rubber Goods
5.2.1.3. Plastics
5.2.1.4. Inks & Toners
5.2.1.5. Batteries
5.2.1.6. Paints & Coatings
5.2.1.7. Misc. (Wires & Cables, Consumer Goods, etc.)
5.3. Global Carbon Black Market Outlook, by Region, Volume (Kilo Tons) and Value (US$ Mn), 2017 - 2025
5.3.1. Key Highlights
5.3.1.1. North America
5.3.1.2. Europe
5.3.1.3. Asia Pacific
5.3.1.4. Latin America
5.3.1.5. Middle East & Africa
6. North America Carbon Black Market Outlook, 2017 - 2025
6.1. North America Carbon Black Market Outlook, by Product, Volume (Kilo Tons) and Value (US$ Mn), 2017 - 2025
6.1.1. Key Highlights
6.1.1.1. Rubber Carbon Black
6.1.1.2. MGR
6.1.1.3. Specialty Black
6.1.2. BPS Analysis/Market Attractiveness Analysis
6.2. North America Carbon Black Market Outlook, by Application, Volume (Kilo Tons) and Value (US$ Mn), 2017 - 2025
6.2.1. Key Highlights
6.2.1.1. Tires
6.2.1.2. Rubber Goods
6.2.1.3. Plastics
6.2.1.4. Inks & Toners
6.2.1.5. Batteries
6.2.1.6. Paints & Coatings
6.2.1.7. Misc. (Wires & Cables, Consumer Goods, etc.)
6.2.2. BPS Analysis/Market Attractiveness Analysis
6.3. North America Carbon Black Market Outlook, by Country, Volume (Kilo Tons) and Value (US$ Mn), 2017 - 2025
6.3.1. Key Highlights
6.3.1.1. U.S. Carbon Black Market by Product, Volume (Kilo Tons) and Value (US$ Mn), 2017 - 2025
6.3.1.2. U.S. Carbon Black Market by Application, Volume (Kilo Tons) and Value (US$ Mn), 2017 - 2025
6.3.1.3. Canada Carbon Black Market by Product, Volume (Kilo Tons) and Value (US$ Mn), 2017 - 2025
6.3.1.4. Canada Carbon Black Market by Application, Volume (Kilo Tons) and Value (US$ Mn), 2017 - 2025
6.3.2. BPS Analysis/Market Attractiveness Analysis
7. Europe Carbon Black Market Outlook, 2017 - 2025
7.1. Europe Carbon Black Market Outlook, by Product, Volume (Kilo Tons) and Value (US$ Mn), 2017 - 2025
7.1.1. Key Highlights
7.1.1.1. Rubber Carbon Black
7.1.1.2. MGR
7.1.1.3. Specialty Black
7.1.2. BPS Analysis/Market Attractiveness Analysis
7.2. Europe Carbon Black Market Outlook, by Application, Volume (Kilo Tons) and Value (US$ Mn), 2017 - 2025
7.2.1. Key Highlights
7.2.1.1. Tires
7.2.1.2. Rubber Goods
7.2.1.3. Plastics
7.2.1.4. Inks & Toners
7.2.1.5. Batteries
7.2.1.6. Paints & Coatings
7.2.1.7. Misc. (Wires & Cables, Consumer Goods, etc.)
7.2.2. BPS Analysis/Market Attractiveness Analysis
7.3. Europe Carbon Black Market Outlook, by Country, Volume (Kilo Tons) and Value (US$ Mn), 2017 - 2025
7.3.1. Key Highlights
7.3.1.1. Germany Carbon Black Market by Product, Volume (Kilo Tons) and Value (US$ Mn), 2017 - 2025
7.3.1.2. Germany Carbon Black Market by Application, Volume (Kilo Tons) and Value (US$ Mn), 2017 - 2025
7.3.1.3. U.K. Carbon Black Market by Product, Volume (Kilo Tons) and Value (US$ Mn), 2017 - 2025
7.3.1.4. U.K. Carbon Black Market by Application, Volume (Kilo Tons) and Value (US$ Mn), 2017 - 2025
7.3.1.5. France Carbon Black Market by Product, Volume (Kilo Tons) and Value (US$ Mn), 2017 - 2025
7.3.1.6. France Carbon Black Market by Application, Volume (Kilo Tons) and Value (US$ Mn), 2017 - 2025
7.3.1.7. Italy Carbon Black Market by Product, Volume (Kilo Tons) and Value (US$ Mn), 2017 - 2025
7.3.1.8. Italy Carbon Black Market by Application, Volume (Kilo Tons) and Value (US$ Mn), 2017 - 2025
7.3.1.9. Spain Carbon Black Market by Product, Volume (Kilo Tons) and Value (US$ Mn), 2017 - 2025
7.3.1.10. Spain Carbon Black Market by Application, Volume (Kilo Tons) and Value (US$ Mn), 2017 - 2025
7.3.1.11. Russia Carbon Black Market by Product, Volume (Kilo Tons) and Value (US$ Mn), 2017 - 2025
7.3.1.12. Russia Carbon Black Market by Application, Volume (Kilo Tons) and Value (US$ Mn), 2017 - 2025
7.3.1.13. Rest of Europe Carbon Black Market by Product, Volume (Kilo Tons) and Value (US$ Mn), 2017 - 2025
7.3.1.14. Rest of Europe Carbon Black Market by Application, Volume (Kilo Tons) and Value (US$ Mn), 2017 - 2025
7.3.2. BPS Analysis/Market Attractiveness Analysis
8. Asia Pacific Carbon Black Market Outlook, 2017 - 2025
8.1. Asia Pacific Carbon Black Market Outlook, by Product, Volume (Kilo Tons) and Value (US$ Mn), 2017 - 2025
8.1.1. Key Highlights
8.1.1.1. Rubber Carbon Black
8.1.1.2. MGR
8.1.1.3. Specialty Black
8.1.2. BPS Analysis/Market Attractiveness Analysis
8.2. Asia Pacific Carbon Black Market Outlook, by Application, Volume (Kilo Tons) and Value (US$ Mn), 2017 - 2025
8.2.1. Key Highlights
8.2.1.1. Tires
8.2.1.2. Rubber Goods
8.2.1.3. Plastics
8.2.1.4. Inks & Toners
8.2.1.5. Batteries
8.2.1.6. Paints & Coatings
8.2.1.7. Misc. (Wires & Cables, Consumer Goods, etc.)
8.2.2. BPS Analysis/Market Attractiveness Analysis
8.3. Asia Pacific Carbon Black Market Outlook, by Country, Volume (Kilo Tons) and Value (US$ Mn), 2017 - 2025
8.3.1. Key Highlights
8.3.1.1. China Carbon Black Market by Product, Volume (Kilo Tons) and Value (US$ Mn), 2017 - 2025
8.3.1.2. China Carbon Black Market by Application, Volume (Kilo Tons) and Value (US$ Mn), 2017 - 2025
8.3.1.3. Japan Carbon Black Market by Product, Volume (Kilo Tons) and Value (US$ Mn), 2017 - 2025
8.3.1.4. Japan Carbon Black Market by Application, Volume (Kilo Tons) and Value (US$ Mn), 2017 - 2025
8.3.1.5. South Korea Carbon Black Market by Product, Volume (Kilo Tons) and Value (US$ Mn), 2017 - 2025
8.3.1.6. South Korea Carbon Black Market by Application, Volume (Kilo Tons) and Value (US$ Mn), 2017 - 2025
8.3.1.7. India Carbon Black Market by Product, Volume (Kilo Tons) and Value (US$ Mn), 2017 - 2025
8.3.1.8. India Carbon Black Market by Application, Volume (Kilo Tons) and Value (US$ Mn), 2017 - 2025
8.3.1.9. Southeast Asia Carbon Black Market by Product, Volume (Kilo Tons) and Value (US$ Mn), 2017 - 2025
8.3.1.10. Southeast Asia Carbon Black Market by Application, Volume (Kilo Tons) and Value (US$ Mn), 2017 - 2025
8.3.1.11. Rest of Asia Pacific Carbon Black Market by Product, Volume (Kilo Tons) and Value (US$ Mn), 2017 - 2025
8.3.1.12. Rest of Asia Pacific Carbon Black Market by Application, Volume (Kilo Tons) and Value (US$ Mn), 2017 - 2025
8.3.2. BPS Analysis/Market Attractiveness Analysis
9. Latin America Carbon Black Market Outlook, 2017 - 2025
9.1. Latin America Carbon Black Market Outlook, by Product, Volume (Kilo Tons) and Value (US$ Mn), 2017 - 2025
9.1.1. Key Highlights
9.1.1.1. Rubber Carbon Black
9.1.1.2. MGR
9.1.1.3. Specialty Black
9.1.2. BPS Analysis/Market Attractiveness Analysis
9.2. Latin America Carbon Black Market Outlook, by Application, Volume (Kilo Tons) and Value (US$ Mn), 2017 - 2025
9.2.1. Key Highlights
9.2.1.1. Tires
9.2.1.2. Rubber Goods
9.2.1.3. Plastics
9.2.1.4. Inks & Toners
9.2.1.5. Batteries
9.2.1.6. Paints & Coatings
9.2.1.7. Misc. (Wires & Cables, Consumer Goods, etc.)
9.2.2. BPS Analysis/Market Attractiveness Analysis
9.3. Latin America Carbon Black Market Outlook, by Country, Volume (Kilo Tons) and Value (US$ Mn), 2017 - 2025
9.3.1. Key Highlights
9.3.1.1. Brazil Carbon Black Market by Product, Volume (Kilo Tons) and Value (US$ Mn), 2017 - 2025
9.3.1.2. Brazil Carbon Black Market by Application, Volume (Kilo Tons) and Value (US$ Mn), 2017 - 2025
9.3.1.3. Mexico Carbon Black Market by Product, Volume (Kilo Tons) and Value (US$ Mn), 2017 - 2025
9.3.1.4. Mexico Carbon Black Market by Application, Volume (Kilo Tons) and Value (US$ Mn), 2017 - 2025
9.3.1.5. Rest of Latin America Carbon Black Market by Product, Volume (Kilo Tons) and Value (US$ Mn), 2017 - 2025
9.3.1.6. Rest of Latin America Carbon Black Market by Application, Volume (Kilo Tons) and Value (US$ Mn), 2017 - 2025
9.3.2. BPS Analysis/Market Attractiveness Analysis
10. Middle East & Africa Carbon Black Market Outlook, 2017 - 2025
10.1. Middle East & Africa Carbon Black Market Outlook, by Product, Volume (Kilo Tons) and Value (US$ Mn), 2017 - 2025
10.1.1. Key Highlights
10.1.1.1. Rubber Carbon Black
10.1.1.2. MGR
10.1.1.3. Specialty Black
10.1.2. BPS Analysis/Market Attractiveness Analysis
10.2. Middle East & Africa Carbon Black Market Outlook, by Application, Volume (Kilo Tons) and Value (US$ Mn), 2017 - 2025
10.2.1. Key Highlights
10.2.1.1. Tires
10.2.1.2. Rubber Goods
10.2.1.3. Plastics
10.2.1.4. Inks & Toners
10.2.1.5. Batteries
10.2.1.6. Paints & Coatings
10.2.1.7. Misc. (Wires & Cables, Consumer Goods, etc.)
10.2.2. BPS Analysis/Market Attractiveness Analysis
10.3. Middle East & Africa Carbon Black Market Outlook, by Country, Volume (Kilo Tons) and Value (US$ Mn), 2017 - 2025
10.3.1. Key Highlights
10.3.1.1. GCC Carbon Black Market by Product, Volume (Kilo Tons) and Value (US$ Mn), 2017 - 2025
10.3.1.2. GCC Carbon Black Market by Application, Volume (Kilo Tons) and Value (US$ Mn), 2017 - 2025
10.3.1.3. South Africa Carbon Black Market by Product, Volume (Kilo Tons) and Value (US$ Mn), 2017 - 2025
10.3.1.4. South Africa Carbon Black Market by Application, Volume (Kilo Tons) and Value (US$ Mn), 2017 - 2025
10.3.1.5. Rest of Middle East & Africa Carbon Black Market by Product, Volume (Kilo Tons) and Value (US$ Mn), 2017 - 2025
10.3.1.6. Rest of Middle East & Africa Carbon Black Market by Application, Volume (Kilo Tons) and Value (US$ Mn), 2017 - 2025
10.3.2. BPS Analysis/Market Attractiveness Analysis
11. Competitive Landscape
11.1. Product vs Application Heatmap
11.2. Carbon Black Market Structure
11.3. Company Market Share Analysis, 2019
11.4. Technological Developments
11.5. Company Profiles
11.5.1. Cabot Corporation
11.5.1.1. Company Overview
11.5.1.2. Product Portfolio
11.5.1.3. Financial Overview
11.5.1.4. Business Strategies and Development
11.5.2. Birla Carbon
11.5.2.1. Company Overview
11.5.2.2. Product Portfolio
11.5.2.3. Financial Overview
11.5.2.4. Business Strategies and Development
11.5.3. Orion Engineered Carbons
11.5.3.1. Company Overview
11.5.3.2. Product Portfolio
11.5.3.3. Financial Overview
11.5.3.4. Business Strategies and Development
11.5.4. Jiangxi Black Cat Carbon
11.5.4.1. Company Overview
11.5.4.2. Product Portfolio
11.5.4.3. Financial Overview
11.5.4.4. Business Strategies and Development
11.5.5. Tokai Carbon
11.5.5.1. Company Overview
11.5.5.2. Product Portfolio
11.5.5.3. Production Capacities
11.5.5.4. Business Strategies and Development
11.5.6. CSRC Group
11.5.6.1. Company Overview
11.5.6.2. Product Portfolio
11.5.6.3. Financial Overview
11.5.6.4. Business Strategies and Development
11.5.7. Phillips Carbon Black Ltd.
11.5.7.1. Company Overview
11.5.7.2. Product Portfolio
11.5.7.3. Production Capacities
11.5.7.4. Business Strategies and Development
11.5.8. OMSK Carbon
11.5.8.1. Company Overview
11.5.8.2. Product Portfolio
11.5.8.3. Production Capacities
11.5.8.4. Business Strategies and Development
11.5.9. JSC
11.5.9.1. Company Overview
11.5.9.2. Product Portfolio
11.5.9.3. Production Capacities
11.5.9.4. Business Strategies and Development
11.5.10. Asahi Carbon Co. Ltd.
11.5.10.1. Company Overview
11.5.10.2. Product Portfolio
11.5.10.3. Production Capacities
11.5.10.4. Business Strategies and Development
11.5.11. Himadri Speciality Chemical Limited
11.5.11.1. Company Overview
11.5.11.2. Product Portfolio
11.5.11.3. Production Capacities
11.5.11.4. Business Strategies and Development
12. Appendix
12.1. Research Methodology
12.2. Report Assumptions
12.3. Acronyms and Abbreviations
|
BASE YEAR |
HISTORICAL DATA |
FORECAST PERIOD |
UNITS |
|||
 |
2020 |
 |
2017 - 2019 |
 |
2021 - 2025 |
Value: US$ Million Volume: Kilo Tons |
|
REPORT FEATURES |
DETAILS |
|
Product Coverage |
|
|
Application Coverage |
|
|
Geographical Coverage |
|
|
Leading Companies |
|
|
Report Highlights |
Market Estimates and Forecast, Market Dynamics, Industry Trends, Competition Landscape, Product-, Application-, Region-, Country-wise Trends & Analysis, COVID-19 Impact Analysis (Demand and Supply Chain), Key Trends |