



Cell Cytometry Market
Cell Cytometry Market Size, Share, Insights, Competitive Landscape, and Forecast 2026 to 2033
Cell Cytometry Market Analysis, 2026–2033
Cell Cytometry Market
Cell Cytometry Market Size, Share, Insights, Competitive Landscape, and Forecast 2026 to 2033
Cell Cytometry Market Size and Trend Analysis
How Fast Is the Cell Cytometry Market Expanding?
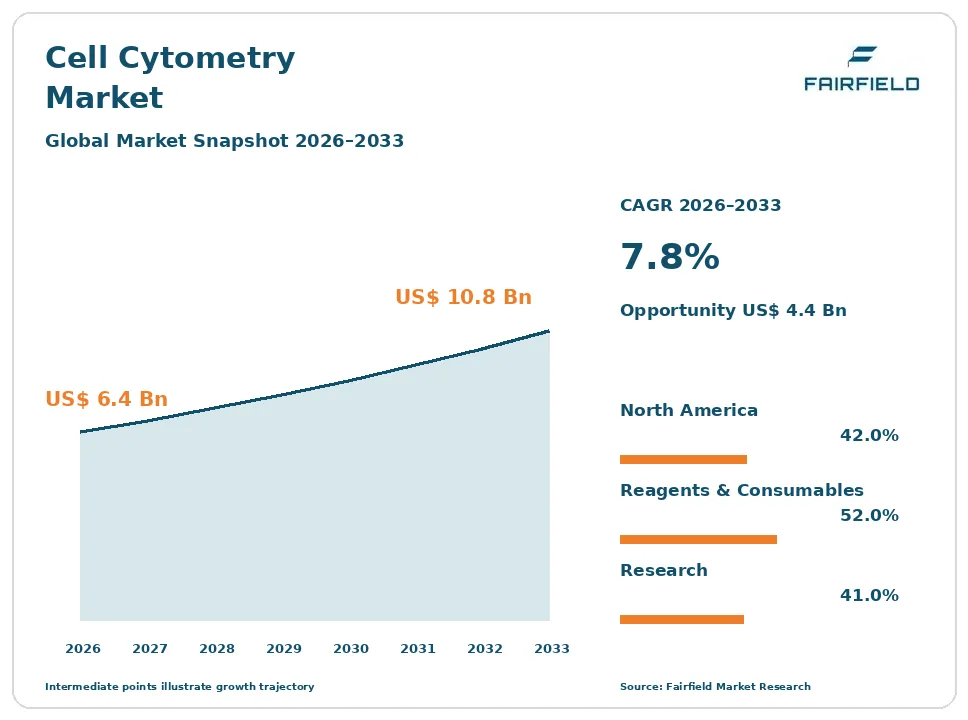
The global Cell Cytometry market size is expected to be valued at US$ 6.4 billion in 2026 and projected to reach US$ 10.8 billion by 2033, growing at a CAGR of 7.8% between 2026 and 2033.
The market grew at an estimated 6.6% CAGR between 2020 and 2025, with a pandemic-era surge in immunology research followed by a softer instrument cycle. Growth now rests on three supports. Cell and gene therapy development has made cytometry a release and characterisation method rather than only a discovery tool. Routine clinical use in haematology, immunology and transplant monitoring provides a stable reagent base that does not depend on grant cycles. Spectral detection has widened panels from a handful of markers to dozens, lifting antibody and dye consumption per experiment. The direction of travel is steady mid single-digit to high single-digit expansion, carried by consumables rather than by instrument placements.
Key Report Takeaways
- By Product: Reagents and Consumables held 52% share in 2026, while Software and Services is projected to expand at a 9.4% CAGR through 2033, because high-parameter data analysis now requires specialist tools and support contracts.
- By Technology: Conventional Flow Cytometry held 46% share in 2026, while Spectral Flow Cytometry is projected to expand at a 12.3% CAGR through 2033, as full-spectrum detection removes the panel design limits of filter-based optics.
- By Application: Research held 41% share in 2026, while Biopharmaceutical Development and Quality Control is projected to expand at a 9.6% CAGR through 2033, driven by cell therapy characterisation and release testing requirements.
- By End User: Academic and Research Institutes held 34% share in 2026, while Contract Research Organizations are projected to expand at a 9.1% CAGR through 2033, as sponsors outsource immune monitoring and bioanalytical work.
- By Geography: North America held 42% share in 2026, while Asia Pacific is projected to expand at a 10.4% CAGR through 2033, supported by biologics manufacturing capacity and public research funding.
Global Cell Cytometry Market Trends and Insights
Drivers Impact Analysis
| Driver | Impact on CAGR Forecast | Geographic Relevance | Impact Timeline |
| Cell and gene therapy characterisation and release testing | High | North America, Europe, Asia Pacific | Medium term 2–4 years |
| Routine clinical use in haematology, immunology and transplant monitoring | Medium | Global | Short term ≤2 years |
Both principal drivers shift cytometry from discretionary research spending toward obligatory, repeat-volume testing.
Cell and Gene Therapy Manufacturing Turns Cell Cytometry Into a Regulated Quality Control Method
Biopharmaceutical manufacturing has become the most reliable growth engine for cytometry, because a cell therapy product is measured cell by cell. Identity, purity, viability, transduction efficiency and residual populations are all assessed by flow methods, and every batch requires them. Unlike discovery work, release testing is mandatory, repeated and written into regulatory filings, so demand does not fall when research budgets tighten. Each manufacturing site also needs qualified instruments and validated panels.
The mechanism is validation. Assays supporting release decisions must be developed, validated and run under documented conditions, with good laboratory practice and good clinical laboratory practice expectations applying to bioanalytical work supporting trials. The Clinical and Laboratory Standards Institute guidance on validating cell-based assays by flow cytometry gives sponsors a recognised framework, which standardises what manufacturers must buy and how often they must requalify.
Routine Haematology, Immunology and Transplant Testing Anchors Recurring Cell Cytometry Demand
Clinical laboratory work provides the market’s stable floor, because the test volumes are driven by patient numbers rather than by funding decisions. Immunophenotyping for leukaemia and lymphoma, lymphocyte subset counting, immunodeficiency assessment, paroxysmal nocturnal haemoglobinuria screening and transplant crossmatch testing all run continuously in hospital laboratories. These assays consume standardised antibody panels in predictable monthly quantities, which makes the installed clinical base the most forecastable revenue in the market.
The underlying mechanism is accreditation. Laboratories operating under ISO 15189 or, in the United States, under CLIA certification and College of American Pathologists inspection must use validated methods, documented panels and traceable calibration, which discourages substitution and informal cost-saving. Where cytometry is used for diagnostic purposes in the European Union, the In Vitro Diagnostic Regulation imposes a further documentation layer that reinforces supplier continuity.
Restraints Impact Analysis
| Restraint | Impact on CAGR Forecast | Geographic Relevance | Impact Timeline |
| Instrument capital cost and dependence on the academic funding cycle | High | Europe, Latin America, Middle East & Africa | Medium term 2–4 years |
| Standardisation gaps and the shortage of trained cytometrists | Medium | Global | Long term ≥4 years |
Capital intensity and measurement comparability are the two constraints that most often delay purchases.
Instrument Capital Cost and the Academic Funding Cycle Delay Cell Cytometry Replacement Purchases
Instrument cost makes cytometry demand lumpy and sensitive to budget cycles. A multi-laser spectral analyser or a cell sorter is a capital purchase that competes with other shared equipment, and universities typically fund it through grants, core facility reserves or institutional capital rounds rather than operating budgets. When public research funding flattens, replacement is deferred and existing instruments are run well beyond their intended service life, which suppresses placements and the reagent pull-through that follows them.
The cost is not only the purchase price. Sorters need biosafety containment, dedicated rooms, uninterruptible power and service contracts, and high-parameter systems require trained operators and ongoing qualification. Core facilities recover these costs through internal charge-back rates that already strain smaller laboratories. In regions where grant funding is thin, that total cost of ownership, rather than the headline price, is what blocks adoption.
Standardisation Gaps and the Shortage of Trained Cytometrists Limit Comparability of Cell Cytometry Results
Reproducibility is a persistent weakness, and it restrains adoption in multi-site and regulated work. Results from the same sample can differ between instruments, laboratories and operators because of detector configuration, compensation or unmixing choices, antibody clone and lot variation, gating strategy and sample handling. Where a study spans several sites, the harmonisation effort can rival the cost of the experiment itself, and some sponsors avoid cytometric endpoints for that reason.
The underlying cause is a combination of method freedom and scarce expertise. MIFlowCyt reporting standards and fluorescence intensity calibration reference materials improve comparability but are not universally applied. High-parameter spectral panels magnify the problem, since unmixing errors propagate invisibly. Experienced cytometrists capable of designing a thirty-colour panel and validating it are in short supply, and training capacity has not matched instrument capability.
Market Opportunities
High-Dimensional Analysis Software and Panel Design Services Open a New Cell Cytometry Revenue Pool
Software and expert services are the fastest-emerging revenue pool, because spectral detection created an analysis problem that instrument vendors did not previously have to solve. Panels of thirty or more parameters cannot be interpreted by sequential manual gating, so laboratories need dimensionality reduction, automated population identification, unmixing quality control and batch-effect correction. These are licensed products with recurring subscriptions, and they attach to the instrument base regardless of whether new hardware is purchased.
Instrument manufacturers, independent analysis software suppliers and reagent companies can all capture this pool, and the buyers are core facility directors, biopharmaceutical bioanalytical groups and contract research organisations running multi-site studies. Demand is reinforced by regulated work, where an auditable analysis trail matters as much as the result. Panel design consultancy and validation support are being sold alongside the software as a bundled service.
Pre-Formulated and Lyophilised Antibody Panels Expand the Consumable Pool in Cell Cytometry
Standardised, pre-mixed panels are a growing consumable category because they attack the reproducibility problem directly. Lyophilised or dried-down cocktails supplied in a single tube remove pipetting error, reduce lot-to-lot variability, cut preparation time and travel without cold chain. They command a premium over individual conjugates, and once a laboratory validates a catalogue panel, repurchasing is effectively locked in for the life of the protocol.
The strongest demand comes from clinical laboratories, cell therapy manufacturers and multi-site clinical trials, where consistency between sites is a regulatory as much as a scientific requirement. Reagent manufacturers and instrument vendors with antibody portfolios are positioned to capture it, and custom panel services extend the model to sponsor-specific assays. Decentralised manufacturing of cell therapies, with testing performed near the point of care, strengthens the case further.
Segment Analysis
By Product: Reagents and Consumables Dominate Revenue While Software and Services Grow Quickest
Reagents and Consumables accounted for 52% of the market in 2026, and this is the structural fact of the industry. Instruments are placed to generate years of antibody, fluorochrome, dye, bead and assay kit revenue, which is why panel compatibility is the real competitive lock-in rather than optics. Instruments form the second largest product line, with Accessories supplying tubes, plates and calibration particles. Software and Services is the fastest-growing product at a 9.4% CAGR to 2033, because high-parameter datasets require analysis tools, unmixing quality control and support contracts that did not exist in the filter-based era. The business implication is that vendors increasingly price hardware aggressively to win placements, then defend margin through validated reagents and subscription software, making the installed base the most valuable asset on the balance sheet.
By Technology: Conventional Flow Cytometry Leads as Spectral Detection Sets the Pace
Conventional Flow Cytometry held 46% share in 2026, reflecting a vast installed base in clinical and research laboratories where established protocols, validated panels and accreditation records make replacement disruptive. Cell Sorting serves isolation workflows, Mass Cytometry supports very high parameter immune profiling without spectral overlap, and Imaging Cytometry adds morphology and localisation. Spectral Flow Cytometry is the fastest-expanding technology at a 12.3% CAGR through 2033. By capturing the full emission spectrum of every fluorochrome and unmixing computationally, it removes the filter constraints that capped conventional panels, allowing far more markers from one sample. That matters most where samples are precious, such as paediatric, biopsy and clinical trial specimens. The commercial consequence is a migration of panel design expertise and reagent demand toward spectral-compatible dye portfolios.
By Application: Research Holds the Largest Share While Biopharmaceutical Quality Control Accelerates
Research represented 41% of demand in 2026, spanning immunology, oncology, stem cell biology, microbiology and marine and environmental work, and it remains the largest application because it has the widest instrument base. Clinical Diagnostics follows, with haematology, immunology and transplant testing providing steady volume, while Industrial Testing covers food, water and bioprocess monitoring. Biopharmaceutical Development and Quality Control is the fastest-growing application at a 9.6% CAGR to 2033. Cell and gene therapy manufacturing requires per-batch identity, purity, viability and potency-supporting measurements, and these are mandatory rather than discretionary. The implication for suppliers is a shift in buyer behaviour: manufacturing customers value documentation, lot consistency, instrument qualification support and change control far more than peak specification, which rewards vendors with regulated-market service infrastructure.
By End User: Academic and Research Institutes Lead While Contract Research Organizations Expand Fastest
Academic and Research Institutes held 34% of demand in 2026, because core facilities concentrate the largest share of installed analysers and sorters and generate continuous reagent consumption across many research groups. Clinical and Diagnostic Laboratories, including hospital haematology and immunology services, form the next largest group with the most predictable volumes. Pharmaceutical and Biotechnology Companies buy for discovery, translational immune monitoring and manufacturing control. Contract Research Organizations are the fastest-growing end user at a 9.1% CAGR through 2033, as sponsors outsource immunophenotyping, receptor occupancy and bioanalytical flow work to providers that already hold validated methods and accredited quality systems. This concentrates purchasing into fewer, more demanding accounts that negotiate on reagent supply continuity and cross-site harmonisation rather than on list price alone.
Geography Analysis
Which Region Is Leading the Cell Cytometry Market?
North America leads the cell cytometry market with 42% share in 2026, because the United States combines the largest biomedical research funding base with the deepest concentration of biopharmaceutical and cell therapy developers. Core facilities at academic medical centres hold a very large installed instrument base, and federal research funding sustains reagent consumption across thousands of laboratories. Clinical demand is equally important: laboratories operating under CLIA certification and College of American Pathologists accreditation run high volumes of immunophenotyping and lymphocyte subset testing under validated protocols. Cell therapy manufacturing capacity, much of it concentrated around a few biotechnology clusters, drives quality control instrument placements. Canada contributes research and clinical demand at smaller scale. The region’s main shift is toward spectral replacement cycles in core facilities seeking higher parameter counts from existing sample volumes.
Europe Combines Diagnostic Regulation With Strong Core Facility Infrastructure
Europe accounts for 27% of the market in 2026, led by Germany, the United Kingdom, France, Switzerland, Italy and the Nordic countries. The region has an unusually dense network of academic core facilities and a long-established cytometry community that supports method development and training. Demand is reinforced by regulation: where cytometry is used diagnostically, the In Vitro Diagnostic Regulation requires conformity documentation and sets conditions on in-house assays developed by health institutions, which pushes laboratories toward documented commercial reagents and qualified instruments. ISO 15189 accreditation has the same effect on hospital laboratories. Biopharmaceutical manufacturing in Switzerland, Ireland and Germany adds quality control demand. The constraints are flat public research budgets in several countries and slow, heavily tendered capital procurement.
Which Region Is Growing Fastest in the Cell Cytometry Market?
Asia Pacific is the fastest-growing geography at a 10.4% CAGR between 2026 and 2033, from a 23% share in 2026. China, Japan, India, the Republic of Korea, Singapore and Australia drive the expansion. Three conditions explain it. Biologics and cell therapy manufacturing capacity has been built rapidly, and each new facility requires qualified analysers for release and in-process testing. Public research funding has risen substantially in China and India, expanding the academic instrument base from a lower starting point. Hospital laboratory modernisation is increasing clinical immunophenotyping volumes. Domestic instrument and reagent manufacturers have also gained share on price and local service, particularly in benchtop analysers, which is changing competitive dynamics in a way global suppliers are responding to with regional manufacturing.
Latin America Builds Cytometry Capacity Around Private Diagnostic Networks and Public Universities
Latin America holds 5% of the market in 2026, with Brazil, Mexico, Argentina, Chile and Colombia generating most demand. Growth comes from private diagnostic laboratory chains investing in haematological malignancy immunophenotyping and from public university core facilities that serve regional research communities. The barriers are financial and operational: capital budgets for sorters and spectral systems are limited, import duties and currency movements raise effective instrument prices, and service engineer coverage is thin, so instrument downtime is longer than in other regions. Trained cytometrists are scarce and often concentrated in a few centres. The clearest opportunity lies in pre-formulated lyophilised panels, which reduce dependence on cold chain logistics and local preparation expertise while improving comparability between sites.
Middle East & Africa Demand Concentrates in Gulf Research Investment and South African Clinical Laboratories
Middle East & Africa represents 3% of the market in 2026, with demand concentrated in a small number of well-funded centres. Saudi Arabia, the United Arab Emirates, Qatar and Israel are investing in research universities, specialist hospitals and biotechnology initiatives that purchase high-specification instruments outright. South Africa has the most established clinical cytometry base on the continent, supported by extensive lymphocyte subset monitoring programmes that consume large reagent volumes routinely. Elsewhere, constraints are severe: limited capital budgets, unreliable power and cold chain, few service engineers and very small trained workforces. Reagent import logistics are a recurring operational problem. The main opportunity is compact, low-maintenance benchtop analysers paired with stabilised reagents designed for ambient transport and minimal operator intervention.
Competitive Landscape
The cell cytometry market is highly concentrated at the top. A small group of diversified life science tools companies holds the majority of instrument placements and the antibody and reagent portfolios that feed them, and their position is reinforced by validated protocols, accreditation records and service networks that make switching costly for clinical laboratories. Below that tier, a set of focused specialists has taken meaningful share in spectral analysis, mass cytometry, imaging cytometry and benchtop systems, several growing quickly by targeting core facilities frustrated by the limits of filter-based optics. Consolidation has been continuous, with reagent and software businesses repeatedly absorbed into instrument groups seeking to control the whole workflow.
Competition is fought over the consumable stream rather than the instrument. Vendors compete on breadth and quality of conjugated antibodies, dye brightness and spectral separation, panel design support, lot-to-lot consistency, software usability and service responsiveness. Open versus closed reagent ecosystems is a live commercial question, since customers increasingly resist being locked to a single supplier’s conjugates. New entrants have arrived from microfluidics and from imaging, and single-cell sequencing competes for some questions where molecular depth matters more than throughput, although cytometry retains decisive advantages in speed, cost per cell and viable cell recovery.
Strategic activity has centred on broadening reagent catalogues for spectral panels, adding analysis software, expanding regulated-market service and qualification capability, and building regional manufacturing to shorten supply chains.
Vendor strategy is converging on four themes: defending installed bases with validated consumables, moving up the value chain into analysis software, serving cell therapy manufacturing with documentation and qualification support, and simplifying operation to widen the user base beyond specialists.
Cell Cytometry Industry Leaders
Becton, Dickinson and Company
Beckman Coulter Life Sciences
Thermo Fisher Scientific
Sony Biotechnology
Cytek Biosciences
Recent Industry Developments
- May 2024: Under the European Union In Vitro Diagnostic Regulation, the condition that health institutions may use in-house devices only where no equivalent device is available on the market became applicable – it pushed hospital laboratories to justify or replace locally developed cytometry assays.
- December 2024: Revised Clinical Laboratory Improvement Amendments personnel qualification requirements issued by the Centers for Medicare & Medicaid Services took effect in the United States – it tightened the staffing standards that high-complexity cytometry testing must meet.
- December 2025: The transition period for medical laboratories to the 2022 edition of ISO 15189 closed, making the revised risk-based accreditation standard the operative requirement – it raised documentation and competence expectations for diagnostic cytometry services.
Companies Covered in the Report
- Becton, Dickinson and Company
- Beckman Coulter Life Sciences
- Thermo Fisher Scientific
- Agilent Technologies
- Sony Biotechnology
- Cytek Biosciences
- Bio-Rad Laboratories
- Miltenyi Biotec
- Standard BioTools
- Sysmex Corporation
- DiaSorin
- Revvity
- Stratedigm
Cell Cytometry Market Report Scope
This study counts instruments, reagents, consumables, accessories and analysis software together, since reagents and consumables form the larger recurring share. Coverage includes conventional and spectral flow cytometry, cell sorters, mass cytometry, imaging and microfluidic benchtop analysers, antibodies, fluorochromes, dyes, beads and assay kits. Sequencing-based single-cell platforms are excluded. The base year is 2025, the forecast period is 2026 to 2033, and values are in US$ Billion.
Product
- Reagents and Consumables
- Instruments
- Software and Services
- Accessories
Technology
- Conventional Flow Cytometry
- Spectral Flow Cytometry
- Cell Sorting
- Mass Cytometry
- Imaging Cytometry
Application
- Research
- Clinical Diagnostics
- Biopharmaceutical Development and Quality Control
- Industrial Testing
End User
- Academic and Research Institutes
- Clinical and Diagnostic Laboratories
- Pharmaceutical and Biotechnology Companies
- Contract Research Organizations
Regions
- North America
- Europe
- Asia Pacific
- Latin America
- Middle East & Africa
Key Questions Answered in the Report
How big is the cell cytometry market in 2026?
The market is valued at US$ 6.4 billion in 2026, counting instruments, reagents, consumables, accessories and analysis software across research, clinical and biopharmaceutical use.
What is the forecast size and growth rate to 2033?
The market is projected to reach US$ 10.8 billion by 2033 at a 7.8% CAGR, giving an absolute dollar opportunity of US$ 4.4 billion across the forecast period.
Which product segment leads the cell cytometry market?
Reagents and Consumables lead with 52% share in 2026, because instruments are placed to generate years of recurring antibody, dye and assay kit revenue.
Which technology and region are growing fastest?
Spectral Flow Cytometry grows fastest at a 12.3% CAGR, while Asia Pacific is the fastest-expanding geography at a 10.4% CAGR between 2026 and 2033.
Which region leads and how concentrated is the market?
North America leads with 42% share in 2026, and concentration is high, with a few diversified tools companies holding most instrument and reagent revenue.
1. Executive Summary
1.1. Global Cell Cytometry Market Snapshot
1.2. Future Projections
1.3. Key Report Takeaways
1.4. Regional Snapshot
2. Market Overview
2.1. Market Definition and Report Scope
2.2. Historical Trends 2020–2025
2.3. Market Dynamics
2.3.1. Drivers
2.3.1.1. Cell and Gene Therapy Manufacturing Turns Cell Cytometry Into a Regulated Quality Control Method
2.3.1.2. Routine Haematology, Immunology and Transplant Testing Anchors Recurring Cell Cytometry Demand
2.3.2. Restraints
2.3.2.1. Instrument Capital Cost and the Academic Funding Cycle Delay Cell Cytometry Replacement Purchases
2.3.2.2. Standardisation Gaps and the Shortage of Trained Cytometrists Limit Comparability of Cell Cytometry Results
2.3.3. Market Opportunities
2.3.3.1. High-Dimensional Analysis Software and Panel Design Services Open a New Cell Cytometry Revenue Pool
2.3.3.2. Pre-Formulated and Lyophilised Antibody Panels Expand the Consumable Pool in Cell Cytometry
3. Global Cell Cytometry Market Outlook, 2020–2033
3.1. Global Cell Cytometry Market Outlook, by Product, Value (US$ Billion), 2020–2033
3.1.1. Reagents and Consumables
3.1.2. Instruments
3.1.3. Software and Services
3.1.4. Accessories
3.2. Global Cell Cytometry Market Outlook, by Technology, Value (US$ Billion), 2020–2033
3.2.1. Conventional Flow Cytometry
3.2.2. Spectral Flow Cytometry
3.2.3. Cell Sorting
3.2.4. Mass Cytometry
3.2.5. Imaging Cytometry
3.3. Global Cell Cytometry Market Outlook, by Application, Value (US$ Billion), 2020–2033
3.3.1. Research
3.3.2. Clinical Diagnostics
3.3.3. Biopharmaceutical Development and Quality Control
3.3.4. Industrial Testing
3.4. Global Cell Cytometry Market Outlook, by End User, Value (US$ Billion), 2020–2033
3.4.1. Academic and Research Institutes
3.4.2. Clinical and Diagnostic Laboratories
3.4.3. Pharmaceutical and Biotechnology Companies
3.4.4. Contract Research Organizations
3.5. Global Cell Cytometry Market Outlook, by Region, Value (US$ Billion), 2020–2033
3.5.1. North America
3.5.2. Europe
3.5.3. Asia Pacific
3.5.4. Latin America
3.5.5. Middle East & Africa
4. North America Cell Cytometry Market Outlook, 2020–2033
4.1. North America Cell Cytometry Market Outlook, by Product, Value (US$ Billion), 2020–2033
4.1.1. Reagents and Consumables
4.1.2. Instruments
4.1.3. Software and Services
4.1.4. Accessories
4.2. North America Cell Cytometry Market Outlook, by Technology, Value (US$ Billion), 2020–2033
4.2.1. Conventional Flow Cytometry
4.2.2. Spectral Flow Cytometry
4.2.3. Cell Sorting
4.2.4. Mass Cytometry
4.2.5. Imaging Cytometry
4.3. North America Cell Cytometry Market Outlook, by Application, Value (US$ Billion), 2020–2033
4.3.1. Research
4.3.2. Clinical Diagnostics
4.3.3. Biopharmaceutical Development and Quality Control
4.3.4. Industrial Testing
4.4. North America Cell Cytometry Market Outlook, by End User, Value (US$ Billion), 2020–2033
4.4.1. Academic and Research Institutes
4.4.2. Clinical and Diagnostic Laboratories
4.4.3. Pharmaceutical and Biotechnology Companies
4.4.4. Contract Research Organizations
4.5. North America Cell Cytometry Market Outlook, by Country, Value (US$ Billion), 2020–2033
4.5.1. United States Cell Cytometry Market Outlook, by Product, 2020–2033
4.5.2. United States Cell Cytometry Market Outlook, by Technology, 2020–2033
4.5.3. United States Cell Cytometry Market Outlook, by Application, 2020–2033
4.5.4. United States Cell Cytometry Market Outlook, by End User, 2020–2033
4.5.5. Canada Cell Cytometry Market Outlook, by Product, 2020–2033
4.5.6. Canada Cell Cytometry Market Outlook, by Technology, 2020–2033
4.5.7. Canada Cell Cytometry Market Outlook, by Application, 2020–2033
4.5.8. Canada Cell Cytometry Market Outlook, by End User, 2020–2033
5. Europe Cell Cytometry Market Outlook, 2020–2033
5.1. Europe Cell Cytometry Market Outlook, by Product, Value (US$ Billion), 2020–2033
5.1.1. Reagents and Consumables
5.1.2. Instruments
5.1.3. Software and Services
5.1.4. Accessories
5.2. Europe Cell Cytometry Market Outlook, by Technology, Value (US$ Billion), 2020–2033
5.2.1. Conventional Flow Cytometry
5.2.2. Spectral Flow Cytometry
5.2.3. Cell Sorting
5.2.4. Mass Cytometry
5.2.5. Imaging Cytometry
5.3. Europe Cell Cytometry Market Outlook, by Application, Value (US$ Billion), 2020–2033
5.3.1. Research
5.3.2. Clinical Diagnostics
5.3.3. Biopharmaceutical Development and Quality Control
5.3.4. Industrial Testing
5.4. Europe Cell Cytometry Market Outlook, by End User, Value (US$ Billion), 2020–2033
5.4.1. Academic and Research Institutes
5.4.2. Clinical and Diagnostic Laboratories
5.4.3. Pharmaceutical and Biotechnology Companies
5.4.4. Contract Research Organizations
5.5. Europe Cell Cytometry Market Outlook, by Country, Value (US$ Billion), 2020–2033
5.5.1. Germany Cell Cytometry Market Outlook, by Product, 2020–2033
5.5.2. Germany Cell Cytometry Market Outlook, by Technology, 2020–2033
5.5.3. Germany Cell Cytometry Market Outlook, by Application, 2020–2033
5.5.4. Germany Cell Cytometry Market Outlook, by End User, 2020–2033
5.5.5. United Kingdom Cell Cytometry Market Outlook, by Product, 2020–2033
5.5.6. United Kingdom Cell Cytometry Market Outlook, by Technology, 2020–2033
5.5.7. United Kingdom Cell Cytometry Market Outlook, by Application, 2020–2033
5.5.8. United Kingdom Cell Cytometry Market Outlook, by End User, 2020–2033
5.5.9. France Cell Cytometry Market Outlook, by Product, 2020–2033
5.5.10. France Cell Cytometry Market Outlook, by Technology, 2020–2033
5.5.11. France Cell Cytometry Market Outlook, by Application, 2020–2033
5.5.12. France Cell Cytometry Market Outlook, by End User, 2020–2033
5.5.13. Switzerland Cell Cytometry Market Outlook, by Product, 2020–2033
5.5.14. Switzerland Cell Cytometry Market Outlook, by Technology, 2020–2033
5.5.15. Switzerland Cell Cytometry Market Outlook, by Application, 2020–2033
5.5.16. Switzerland Cell Cytometry Market Outlook, by End User, 2020–2033
5.5.17. Italy Cell Cytometry Market Outlook, by Product, 2020–2033
5.5.18. Italy Cell Cytometry Market Outlook, by Technology, 2020–2033
5.5.19. Italy Cell Cytometry Market Outlook, by Application, 2020–2033
5.5.20. Italy Cell Cytometry Market Outlook, by End User, 2020–2033
5.5.21. Ireland Cell Cytometry Market Outlook, by Product, 2020–2033
5.5.22. Ireland Cell Cytometry Market Outlook, by Technology, 2020–2033
5.5.23. Ireland Cell Cytometry Market Outlook, by Application, 2020–2033
5.5.24. Ireland Cell Cytometry Market Outlook, by End User, 2020–2033
6. Asia Pacific Cell Cytometry Market Outlook, 2020–2033
6.1. Asia Pacific Cell Cytometry Market Outlook, by Product, Value (US$ Billion), 2020–2033
6.1.1. Reagents and Consumables
6.1.2. Instruments
6.1.3. Software and Services
6.1.4. Accessories
6.2. Asia Pacific Cell Cytometry Market Outlook, by Technology, Value (US$ Billion), 2020–2033
6.2.1. Conventional Flow Cytometry
6.2.2. Spectral Flow Cytometry
6.2.3. Cell Sorting
6.2.4. Mass Cytometry
6.2.5. Imaging Cytometry
6.3. Asia Pacific Cell Cytometry Market Outlook, by Application, Value (US$ Billion), 2020–2033
6.3.1. Research
6.3.2. Clinical Diagnostics
6.3.3. Biopharmaceutical Development and Quality Control
6.3.4. Industrial Testing
6.4. Asia Pacific Cell Cytometry Market Outlook, by End User, Value (US$ Billion), 2020–2033
6.4.1. Academic and Research Institutes
6.4.2. Clinical and Diagnostic Laboratories
6.4.3. Pharmaceutical and Biotechnology Companies
6.4.4. Contract Research Organizations
6.5. Asia Pacific Cell Cytometry Market Outlook, by Country, Value (US$ Billion), 2020–2033
6.5.1. China Cell Cytometry Market Outlook, by Product, 2020–2033
6.5.2. China Cell Cytometry Market Outlook, by Technology, 2020–2033
6.5.3. China Cell Cytometry Market Outlook, by Application, 2020–2033
6.5.4. China Cell Cytometry Market Outlook, by End User, 2020–2033
6.5.5. Japan Cell Cytometry Market Outlook, by Product, 2020–2033
6.5.6. Japan Cell Cytometry Market Outlook, by Technology, 2020–2033
6.5.7. Japan Cell Cytometry Market Outlook, by Application, 2020–2033
6.5.8. Japan Cell Cytometry Market Outlook, by End User, 2020–2033
6.5.9. India Cell Cytometry Market Outlook, by Product, 2020–2033
6.5.10. India Cell Cytometry Market Outlook, by Technology, 2020–2033
6.5.11. India Cell Cytometry Market Outlook, by Application, 2020–2033
6.5.12. India Cell Cytometry Market Outlook, by End User, 2020–2033
6.5.13. Republic of Korea Cell Cytometry Market Outlook, by Product, 2020–2033
6.5.14. Republic of Korea Cell Cytometry Market Outlook, by Technology, 2020–2033
6.5.15. Republic of Korea Cell Cytometry Market Outlook, by Application, 2020–2033
6.5.16. Republic of Korea Cell Cytometry Market Outlook, by End User, 2020–2033
6.5.17. Singapore Cell Cytometry Market Outlook, by Product, 2020–2033
6.5.18. Singapore Cell Cytometry Market Outlook, by Technology, 2020–2033
6.5.19. Singapore Cell Cytometry Market Outlook, by Application, 2020–2033
6.5.20. Singapore Cell Cytometry Market Outlook, by End User, 2020–2033
6.5.21. Australia Cell Cytometry Market Outlook, by Product, 2020–2033
6.5.22. Australia Cell Cytometry Market Outlook, by Technology, 2020–2033
6.5.23. Australia Cell Cytometry Market Outlook, by Application, 2020–2033
6.5.24. Australia Cell Cytometry Market Outlook, by End User, 2020–2033
7. Latin America Cell Cytometry Market Outlook, 2020–2033
7.1. Latin America Cell Cytometry Market Outlook, by Product, Value (US$ Billion), 2020–2033
7.1.1. Reagents and Consumables
7.1.2. Instruments
7.1.3. Software and Services
7.1.4. Accessories
7.2. Latin America Cell Cytometry Market Outlook, by Technology, Value (US$ Billion), 2020–2033
7.2.1. Conventional Flow Cytometry
7.2.2. Spectral Flow Cytometry
7.2.3. Cell Sorting
7.2.4. Mass Cytometry
7.2.5. Imaging Cytometry
7.3. Latin America Cell Cytometry Market Outlook, by Application, Value (US$ Billion), 2020–2033
7.3.1. Research
7.3.2. Clinical Diagnostics
7.3.3. Biopharmaceutical Development and Quality Control
7.3.4. Industrial Testing
7.4. Latin America Cell Cytometry Market Outlook, by End User, Value (US$ Billion), 2020–2033
7.4.1. Academic and Research Institutes
7.4.2. Clinical and Diagnostic Laboratories
7.4.3. Pharmaceutical and Biotechnology Companies
7.4.4. Contract Research Organizations
7.5. Latin America Cell Cytometry Market Outlook, by Country, Value (US$ Billion), 2020–2033
7.5.1. Brazil Cell Cytometry Market Outlook, by Product, 2020–2033
7.5.2. Brazil Cell Cytometry Market Outlook, by Technology, 2020–2033
7.5.3. Brazil Cell Cytometry Market Outlook, by Application, 2020–2033
7.5.4. Brazil Cell Cytometry Market Outlook, by End User, 2020–2033
7.5.5. Mexico Cell Cytometry Market Outlook, by Product, 2020–2033
7.5.6. Mexico Cell Cytometry Market Outlook, by Technology, 2020–2033
7.5.7. Mexico Cell Cytometry Market Outlook, by Application, 2020–2033
7.5.8. Mexico Cell Cytometry Market Outlook, by End User, 2020–2033
7.5.9. Argentina Cell Cytometry Market Outlook, by Product, 2020–2033
7.5.10. Argentina Cell Cytometry Market Outlook, by Technology, 2020–2033
7.5.11. Argentina Cell Cytometry Market Outlook, by Application, 2020–2033
7.5.12. Argentina Cell Cytometry Market Outlook, by End User, 2020–2033
7.5.13. Chile Cell Cytometry Market Outlook, by Product, 2020–2033
7.5.14. Chile Cell Cytometry Market Outlook, by Technology, 2020–2033
7.5.15. Chile Cell Cytometry Market Outlook, by Application, 2020–2033
7.5.16. Chile Cell Cytometry Market Outlook, by End User, 2020–2033
7.5.17. Colombia Cell Cytometry Market Outlook, by Product, 2020–2033
7.5.18. Colombia Cell Cytometry Market Outlook, by Technology, 2020–2033
7.5.19. Colombia Cell Cytometry Market Outlook, by Application, 2020–2033
7.5.20. Colombia Cell Cytometry Market Outlook, by End User, 2020–2033
8. Middle East & Africa Cell Cytometry Market Outlook, 2020–2033
8.1. Middle East & Africa Cell Cytometry Market Outlook, by Product, Value (US$ Billion), 2020–2033
8.1.1. Reagents and Consumables
8.1.2. Instruments
8.1.3. Software and Services
8.1.4. Accessories
8.2. Middle East & Africa Cell Cytometry Market Outlook, by Technology, Value (US$ Billion), 2020–2033
8.2.1. Conventional Flow Cytometry
8.2.2. Spectral Flow Cytometry
8.2.3. Cell Sorting
8.2.4. Mass Cytometry
8.2.5. Imaging Cytometry
8.3. Middle East & Africa Cell Cytometry Market Outlook, by Application, Value (US$ Billion), 2020–2033
8.3.1. Research
8.3.2. Clinical Diagnostics
8.3.3. Biopharmaceutical Development and Quality Control
8.3.4. Industrial Testing
8.4. Middle East & Africa Cell Cytometry Market Outlook, by End User, Value (US$ Billion), 2020–2033
8.4.1. Academic and Research Institutes
8.4.2. Clinical and Diagnostic Laboratories
8.4.3. Pharmaceutical and Biotechnology Companies
8.4.4. Contract Research Organizations
8.5. Middle East & Africa Cell Cytometry Market Outlook, by Country, Value (US$ Billion), 2020–2033
8.5.1. Saudi Arabia Cell Cytometry Market Outlook, by Product, 2020–2033
8.5.2. Saudi Arabia Cell Cytometry Market Outlook, by Technology, 2020–2033
8.5.3. Saudi Arabia Cell Cytometry Market Outlook, by Application, 2020–2033
8.5.4. Saudi Arabia Cell Cytometry Market Outlook, by End User, 2020–2033
8.5.5. United Arab Emirates Cell Cytometry Market Outlook, by Product, 2020–2033
8.5.6. United Arab Emirates Cell Cytometry Market Outlook, by Technology, 2020–2033
8.5.7. United Arab Emirates Cell Cytometry Market Outlook, by Application, 2020–2033
8.5.8. United Arab Emirates Cell Cytometry Market Outlook, by End User, 2020–2033
8.5.9. Qatar Cell Cytometry Market Outlook, by Product, 2020–2033
8.5.10. Qatar Cell Cytometry Market Outlook, by Technology, 2020–2033
8.5.11. Qatar Cell Cytometry Market Outlook, by Application, 2020–2033
8.5.12. Qatar Cell Cytometry Market Outlook, by End User, 2020–2033
8.5.13. Israel Cell Cytometry Market Outlook, by Product, 2020–2033
8.5.14. Israel Cell Cytometry Market Outlook, by Technology, 2020–2033
8.5.15. Israel Cell Cytometry Market Outlook, by Application, 2020–2033
8.5.16. Israel Cell Cytometry Market Outlook, by End User, 2020–2033
8.5.17. South Africa Cell Cytometry Market Outlook, by Product, 2020–2033
8.5.18. South Africa Cell Cytometry Market Outlook, by Technology, 2020–2033
8.5.19. South Africa Cell Cytometry Market Outlook, by Application, 2020–2033
8.5.20. South Africa Cell Cytometry Market Outlook, by End User, 2020–2033
9. Competitive Landscape
9.1. Market Concentration and Industry Leaders
9.2. Competitive Differentiation
9.3. Strategic Moves and Market Direction
9.4. Recent Industry Developments
9.5. Company Profiles
9.5.1. Becton, Dickinson and Company
9.5.2. Beckman Coulter Life Sciences
9.5.3. Thermo Fisher Scientific
9.5.4. Agilent Technologies
9.5.5. Sony Biotechnology
9.5.6. Cytek Biosciences
9.5.7. Bio-Rad Laboratories
9.5.8. Miltenyi Biotec
9.5.9. Standard BioTools
9.5.10. Sysmex Corporation
9.5.11. DiaSorin
9.5.12. Revvity
9.5.13. Stratedigm
10. Appendix
10.1. Research Methodology
10.2. Report Assumptions
10.3. Acronyms and Abbreviations
| Product | Reagents and Consumables, Instruments, Software and Services, Accessories |
| Technology | Conventional Flow Cytometry, Spectral Flow Cytometry, Cell Sorting, Mass Cytometry, Imaging Cytometry |
| Application | Research, Clinical Diagnostics, Biopharmaceutical Development and Quality Control, Industrial Testing |
| End User | Academic and Research Institutes, Clinical and Diagnostic Laboratories, Pharmaceutical and Biotechnology Companies, Contract Research Organizations |
| Regions | North America, Europe, Asia Pacific, Latin America, Middle East & Africa |
Our Research Methodology
Considering the volatility of business today, traditional approaches to strategizing a game plan can be unfruitful if not detrimental. True ambiguity is no way to determine a forecast. A myriad of predetermined factors must be accounted for such as the degree of risk involved, the magnitude of circumstances, as well as conditions or consequences that are not known or unpredictable. To circumvent binary views that cast uncertainty, the application of market research intelligence to strategically posture, move, and enable actionable outcomes is necessary.
View Methodology
Quality Assured
Rigorous Validation Process

Confidentiality Assured
End-to-end Data Security

Custom Research Services
Tailored To Your Objectives
FAQs
The market is valued at US$ 6.4 billion in 2026, counting instruments, reagents, consumables, accessories and analysis software across research, clinical and biopharmaceutical use.
The market is projected to reach US$ 10.8 billion by 2033 at a 7.8% CAGR, giving an absolute dollar opportunity of US$ 4.4 billion across the forecast period.
Reagents and Consumables lead with 52% share in 2026, because instruments are placed to generate years of recurring antibody, dye and assay kit revenue.
Spectral Flow Cytometry grows fastest at a 12.3% CAGR, while Asia Pacific is the fastest-expanding geography at a 10.4% CAGR between 2026 and 2033.
North America leads with 42% share in 2026, and concentration is high, with a few diversified tools companies holding most instrument and reagent revenue.
Related Reports
Veterinary Telehealth Market Size, Share, Insights, Competitive Landscape, and Forecast 2026 to 2033
Veterinary telehealth market to grow from US$ 0.6 billion in 2026 to US$ 1.5 billion by 2033 at a 14.0% CAGR. Explore services, segments and regional insights.
Chemical Peel Market Size, Share, Insights, Competitive Landscape, and Forecast 2026 to 2033
The chemical peel market is projected to grow from US$2.4 billion in 2026 to US$4.3 billion by 2033, at an 8.7% CAGR. Explore segments and regional trends.
Smart Home Health Market Size, Share, Insights, Competitive Landscape, and Forecast 2026 to 2033
The smart home health market is projected to grow from US$5.80 billion in 2026 to US$9.90 billion by 2033, at a 7.9% CAGR, driven by aging and home monitoring.
Population Health Management Market Size, Share, Insights, Competitive Landscape, and Forecast 2026 to 2033
The population health management market is projected to grow from US$46.93 billion in 2026 to US$132.63 billion by 2033, at a 16.0% CAGR, led by value-based care.
Medical Second Opinion Market Size, Share, Insights, Competitive Landscape, and Forecast 2026 to 2033
The medical second opinion market is projected to grow from US$9.69 billion in 2026 to US$28.55 billion by 2033, at a 16.7% CAGR, led by virtual care.
Patient Blood Management Market Size, Share, Insights, Competitive Landscape, and Forecast 2026 to 2033
Explore the patient blood management market, reaching US$ 25.61 billion by 2033 at 6.4% CAGR, with product and regional insights.