



Data Center Rack Market
Data Center Rack Market Size, Share, Insights, Competitive Landscape, and Forecast 2026 to 2033
Report Overview
Data Center Rack Market Size and Trend Analysis
How Fast Will Data Center Rack Demand Grow?
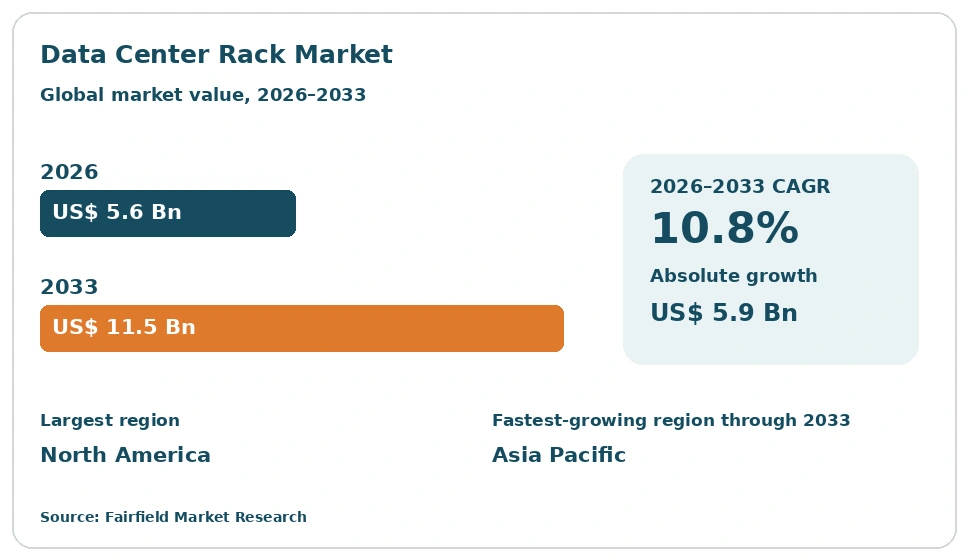
The global Data Center Rack market size is expected to be valued at US$ 5.6 billion in 2026 and projected to reach US$ 11.5 billion by 2033, growing at a CAGR of 10.8% between 2026 and 2033. Growth is anchored in rising rack power density, as accelerated computing pushes cabinet loads far beyond what legacy halls were designed to carry. Operators are replacing shallow, lightly loaded frames with deeper, wider, containment-ready enclosures that integrate busway power, structured cabling and liquid-ready thermal paths. The market advanced at a historical CAGR of 8.6% between 2020 and 2025, and the absolute dollar opportunity through 2033 is US$ 5.9 billion.
Key Report Takeaways
- By Rack Type: Enclosed rack cabinets led with 54% share in 2026, while containment-ready cabinets are projected to expand at a 13.9% CAGR through 2033, driven by hot-aisle and cold-aisle sealing mandates applied during retrofit projects.
- By Rack Height: 42U frames led with 46% share in 2026, while above 48U cabinets are projected to expand at a 14.6% CAGR through 2033, driven by taller slab-to-slab clearances and deeper accelerator chassis stacks.
- By Data Centre Type: Hyperscale facilities led with 41% share in 2026, while edge sites are projected to expand at a 15.2% CAGR through 2033, driven by distributed inference serving and private wireless aggregation points.
- By End User: IT and telecom operators led with 38% share in 2026, while retail and e-commerce firms are projected to expand at a 13.6% CAGR through 2033, driven by real-time personalisation engines and warehouse automation workloads.
- By Region: North America led with 38% share in 2026, ahead of Asia Pacific, Europe, Latin America and Middle East & Africa; Asia Pacific is projected to expand at a 13.0% CAGR through 2033, supported by sovereign cloud build-outs.
Market Trends and Insights
Market Growth Drivers
Rising Rack Power Density Is Forcing Wholesale Cabinet Replacement
Rack power density is the strongest demand signal in this market today. Accelerated computing concentrates far more electrical load into each cabinet than general-purpose servers ever did, and the mechanical frame is the first component that fails to keep pace. Older enclosures were specified for modest static loads, shallow depths and simple front-to-back airflow. Dense accelerator trays break all three limits at once, so operators buy new racks instead of patching old ones.
The shift is visible across the supply base. Vendors now publish heavier static and dynamic load ratings, deeper frames, wider vertical cable zones and reinforced base assemblies aimed at accelerated workloads. Power distribution has moved inside the cabinet through vertical busway and intelligent strips, while blanking panels, brush seals and chimney kits control recirculation. Each change raises the value captured by a single rack line item.
Hyperscale and Colocation Build-Outs Lift Unit Volumes Sharply
Large-scale construction converts directly into rack unit demand. A single new data hall is specified in rows and pods, and every pod carries a fixed count of cabinets, power distribution units and containment panels. When cloud providers and colocation operators commission capacity, racks are ordered early because they set the floor layout that cabling, cooling and electrical trades must follow. That sequencing makes rack procurement an early, predictable element of each project.
Buying behaviour has changed with scale. Operators now standardise on a small number of cabinet stock-keeping units across many sites, then order them in long-term frame agreements with scheduled releases. Suppliers respond with regional fabrication, pre-integrated kits and factory-fitted power and cable management. Integrated racks shipped partly populated shorten commissioning time, which matters when capacity is leased before the building is finished.
Restraints Impact Analysis of Market
Steel, Copper and Freight Costs Squeeze Rack Economics
Input costs limit how freely operators upgrade their cabinet estate. A rack is a fabricated steel assembly shipped as bulky freight, so its delivered price tracks carbon steel, zinc coating, copper for busway and bonding, and container rates. When those inputs move together, quoted prices move quickly and budget holders defer non-critical refreshes. Price volatility also complicates multi-year frame agreements that assume stable unit costs across many sites.
Manufacturers carry the same pressure. Punching, forming, welding and powder-coating lines are capital heavy, and margins depend on steady utilisation and predictable coil pricing. Tariff changes, anti-dumping duties and regional content rules further fragment sourcing decisions. Suppliers respond by localising fabrication near demand clusters, simplifying weldments, standardising panel gauges and designing flat-pack frames that cut shipping volume. Those measures soften the impact but do not remove the exposure.
Legacy Floor Loading and Ceiling Limits Block Dense Cabinets
Building constraints stop many operators from deploying the racks they want. A fully loaded high-density cabinet can exceed the point load that an older raised floor or structural slab was designed to accept. Slab-to-slab clearance, door widths, lift capacity and ramp gradients impose further limits. Where the building cannot take the weight or the height, the customer buys a lighter, shorter cabinet and accepts lower capacity per square metre.
These limits are physical and slow to remove. Reinforcing a floor, raising a ceiling or widening a loading route means structural work, downtime and permits that rarely clear quickly in occupied enterprise sites. Many operators instead split dense workloads across more cabinets at lower utilisation, which lifts rack counts but caps the premium product mix. Vendors respond with seismic bases, load-spreading plates and modular frames assembled inside the room.
Market Opportunities
Liquid-Ready Cabinets Open a Premium Product Tier
Liquid cooling creates a genuinely new rack category rather than an accessory sale. A liquid-ready cabinet must route supply and return manifolds, carry leak detection, support rear-door heat exchangers or in-rack cooling distribution units, and still preserve service access and cable pathways. That combination carries a materially higher content value than a conventional enclosure, and it ties the rack supplier into the thermal design conversation at the earliest stage of a project.
The commercial opening is widening because adoption is incremental. Operators rarely convert a whole hall at once, so they want cabinets that run air-cooled today and accept liquid later without replacement. Vendors are answering with pre-plumbed frame options, manifold mounting rails, drip trays and sealed cable entries offered as factory-fitted configurations. Partnerships between enclosure makers and thermal specialists are becoming a routine route to market.
Edge and Micro Data Centres Create New Enclosure Demand
Edge deployment extends the addressable market beyond traditional halls. Factories, hospitals, retail back rooms, telecom aggregation sites and roadside cabinets all need compute close to the point of use, and none of them offers a clean data hall environment. That requirement favours self-contained micro enclosures with filtration, sealed doors, integrated cooling, metered power, battery backup and remote monitoring built into a single ordered unit.
These sites change the economics of a rack sale. Volumes are high, each unit is small, and the customer usually lacks on-site technical staff, so suppliers compete on pre-integration, remote visibility and service coverage rather than on frame specification alone. Ruggedised and noise-attenuated variants widen the fit for industrial and public-facing spaces. Private wireless rollouts and distributed inference workloads are the clearest sources of this demand.
Category-wise Insights
Which Rack Type Holds the Largest Share of Installations?
Enclosed rack cabinets hold the largest position, at 54% share in 2026, because sealed, lockable enclosures deliver airflow separation, physical security and tidy cable management in shared halls. Colocation tenancy rules and enterprise audit requirements both favour a lockable door over an open frame. Containment-ready cabinets grow fastest, at a 13.9% CAGR through 2033, as operators retrofit sealing kits, chimney ducts and aisle panels into existing rooms to raise supply air temperatures. Open frame racks keep a steady niche in network closets and cross-connect rooms where cable access matters more than containment, while wall-mount racks serve branch and edge sites. The practical effect is a mix shift toward higher-content products: each enclosed or containment-ready cabinet carries more accessory revenue in panels, seals, power strips and cable managers than an open frame ever did.
Taller Cabinets Absorb Deeper and Heavier Accelerated Compute
42U frames remain the volume standard, at 46% share in 2026, because the height suits common building clearances, freight dimensions and lift access across most sites. Above 48U cabinets grow fastest, at a 14.6% CAGR through 2033, as new halls are designed with taller slab-to-slab clearance specifically to add usable rack units per square metre. Accelerator chassis are deeper and heavier than classic rack servers, so buyers also move toward 1,200 millimetre depths and reinforced frames alongside the extra height. 45U to 48U cabinets bridge the two positions in retrofit projects, while below 42U units stay tied to edge and office deployments. For operators, taller cabinets improve the return on an expensive electrical and mechanical shell, which is why height is now specified at the building design stage rather than at fit-out.
Hyperscale Volume Leads While Edge Deployments Compound Fastest
Hyperscale facilities account for the largest demand, at 41% share in 2026, because single campuses order cabinets in thousands against standardised internal designs. Repeatable pod layouts, long-term frame agreements and factory pre-integration all concentrate volume with a small group of qualified suppliers. Edge sites grow fastest, at a 15.2% CAGR through 2033, from a much smaller installed base, as inference serving and private wireless push compute toward factories, hospitals and retail sites. Colocation providers sit between the two, buying flexible cabinets that suit varied tenant densities, while enterprise rooms refresh more slowly under tighter capital control. The split matters commercially: hyperscale wins on unit volume and specification discipline, whereas edge wins on product content, service attachment and the number of separate locations that each need monitoring and support.
IT and Telecom Anchor Demand as Retail Workloads Accelerate
IT and telecom operators form the largest end-user group, at 38% share in 2026, covering cloud platforms, carriers, internet exchanges and managed service providers that run continuous capacity programmes. Retail and e-commerce firms grow fastest, at a 13.6% CAGR through 2033, as real-time personalisation, fraud scoring and warehouse automation move workloads into owned and leased capacity near demand. BFSI buyers prioritise locked, audited cabinets with dual-feed metered power for regulatory reasons, and government and defence users add physical hardening and supply-chain documentation. Healthcare demand follows imaging archives, electronic record systems and clinical applications that must sit close to the hospital campus. For suppliers, the practical implication is that accessory and compliance specification, not the bare frame itself, increasingly decides which vendor wins a given vertical account.
Geography Analysis
Which Region Is Leading the Data Center Rack Market?
North America leads the market, with 38% share in 2026 and a 9.4% CAGR through 2033. The United States contributes most of that total, concentrated in Northern Virginia, Dallas, Phoenix, central Ohio and the Pacific Northwest, with Canada adding capacity in Quebec and Ontario where hydro power is available. Demand is driven by sustained hyperscale and colocation construction, early adoption of accelerated computing, and large refresh cycles in enterprise rooms built a decade ago. Access to long-duration power contracts and established construction supply chains lets operators commission halls quickly. Regional fabrication by established enclosure manufacturers shortens lead times, while interconnection queues and utility constraints in core markets are pushing new projects toward secondary metros with available grid capacity.
Europe Pairs Efficiency Rules With Steady Colocation Expansion
Europe holds 23% share in 2026 and grows at a 9.6% CAGR through 2033. Germany, the United Kingdom, the Netherlands, Ireland and the Nordic countries carry most activity, with Frankfurt, London, Amsterdam, Dublin and Paris remaining the primary interconnection hubs. Energy efficiency reporting duties under the Energy Efficiency Directive, and planning restrictions in several capitals, push operators toward higher supply air temperatures and tight containment rather than more floor area. That favours sealed cabinets, aisle containment kits and metered power distribution. Nordic sites attract capacity through cool climates, renewable supply and heat reuse schemes that feed district heating networks. Enterprise consolidation into colocation also sustains steady cabinet replacement across Southern and Central European markets.
Which Region Is Growing Fastest in the Data Center Rack Market?
Asia Pacific grows fastest, at a 13.0% CAGR through 2033, from 29% share in 2026. China, India, Japan, Singapore, Malaysia, South Korea and Australia drive the expansion. Data localisation rules and sovereign cloud programmes require capacity to be built inside national borders, which creates demand in markets that previously relied on offshore hosting. Johor has absorbed projects constrained by Singapore’s capacity limits, while India combines rapid digital payment volumes with state-level incentives for new parks. Regional manufacturing strength in steel fabrication and electrical assembly supports local rack production and short lead times. Operators in the region are also specifying higher-density cabinets from the outset, since much of the build is new rather than retrofitted.
Latin America Builds Capacity Around Connectivity and Local Hosting
Latin America accounts for 6% share in 2026 and grows at a 10.8% CAGR through 2033. Brazil, Mexico, Chile and Colombia lead, with São Paulo, Querétaro, Santiago and Bogotá acting as the main hubs. Subsea cable landings on both coasts have improved latency enough to justify local hosting for workloads that once ran from the United States. Banking regulators and public-sector tenders increasingly require data to remain in-country, which supports colocation construction. Operators favour standardised enclosed cabinets with metered power and monitoring, because skilled on-site staffing is limited. Import duties and currency movement affect delivered equipment costs, so suppliers with regional assembly or distribution partners hold a practical advantage on lead time and price.
Middle East and Africa Scale Capacity Behind Sovereign Programmes
Middle East & Africa holds 4% share in 2026 and grows at a 12.0% CAGR through 2033. The United Arab Emirates, Saudi Arabia, Qatar, South Africa, Nigeria and Kenya anchor demand. Government digital transformation programmes and sovereign cloud requirements are the main driver, with national agendas directing public workloads into locally hosted capacity. Cabinet specification reflects the climate: high ambient temperatures and dust push operators toward sealed enclosures, filtration, containment and close-coupled cooling rather than open frames. Subsea cable investment along the African coasts is extending viable hosting beyond the established South African market. Power reliability remains uneven in parts of the region, so cabinets are frequently ordered with integrated monitoring, dual-feed distribution and local battery backup.
Competitive Landscape
The market is moderately concentrated. A group of global electrical and enclosure manufacturers supplies most hyperscale and colocation volume, while regional fabricators and specialist cabinet makers serve enterprise, network and edge requirements. Concentration has increased as large buyers standardise designs and award multi-site frame agreements, which rewards suppliers able to fabricate in several regions and hold qualified stock. Consolidation has steadily pulled rack, power distribution and thermal product lines into single corporate portfolios, signalling that customers now prefer to buy an integrated white space package rather than assemble it from separate vendors.
Competition runs on integration rather than sheet metal. Vendors differentiate through verified static and dynamic load ratings, frame depth, seismic certification, containment compatibility, tool-less serviceability and the quality of factory pre-integration. Intelligent power distribution, environmental sensing, locking systems and management software increasingly decide tenders, because operators want cabinet-level visibility feeding their monitoring platforms. Liquid-ready designs, manifold support and leak detection have become active points of comparison. Smaller specialists stay relevant through custom fabrication, short lead times and ruggedised designs that larger catalogue suppliers do not economically serve.
Strategic activity concentrates on capacity, partnership and product breadth. Manufacturers continue to add regional fabrication and configuration centres, which matters because delivered lead time now influences awards as much as unit price. Collaboration between enclosure makers, cooling specialists and server vendors produces reference cabinet designs that shorten qualification for buyers. Investment in configuration tooling, digital twins and pre-cabled shipping reduces on-site labour, a decisive factor when skilled installers are scarce.
Competitive direction points toward the rack becoming a configured system rather than a commodity frame. Suppliers that combine mechanical capability, power distribution, thermal readiness and software visibility are positioned to hold the specification, while sustainability reporting and recycled steel content are emerging as routine tender requirements across the vendor base.
Industry Leaders
- Vertiv Holdings Co
- Schneider Electric SE
- Eaton Corporation plc
- Legrand SA
- Rittal GmbH & Co. KG
- nVent Electric plc
- Panduit Corp.
- Chatsworth Products, Inc.
Companies Covered in the Report
- Vertiv Holdings Co
- Schneider Electric SE
- Eaton Corporation plc
- Legrand SA
- Rittal GmbH & Co. KG
- nVent Electric plc
- Panduit Corp.
- Chatsworth Products, Inc.
- Belden Inc.
- Delta Electronics, Inc.
- Hewlett Packard Enterprise Company
- Dell Technologies Inc.
- Super Micro Computer, Inc.
- Great Lakes Data Racks & Cabinets
- ABB Ltd
Data Center Rack Market Report Scope
The market is segmented by rack type, rack height, data centre type, end user and region.
| By Rack Type | Open Frame Racks, Enclosed Rack Cabinets, Containment-Ready Cabinets, Wall-Mount Racks |
| By Rack Height | Below 42U, 42U, 45U to 48U, Above 48U |
| By Data Centre Type | Hyperscale, Colocation, Enterprise, Edge |
| By End User | IT and Telecom, BFSI, Government and Defence, Healthcare, Retail and E-commerce, Others |
| By Region | North America, Europe, Asia Pacific, Latin America, Middle East & Africa |
1. Executive Summary
1.1 Data Center Rack Market Snapshot
1.2 Future Projections
1.3 Key Market Trends
1.4 Regional Snapshot
2. Market Overview
2.1 Market Definition and Report Scope
2.2 Historical Market Trends
2.3 Market Dynamics
2.3.1 Drivers
2.3.1.1 Rising Rack Power Density Is Forcing Wholesale Cabinet Replacement
2.3.1.2 Hyperscale and Colocation Build-Outs Lift Unit Volumes Sharply
2.3.2 Restraints
2.3.2.1 Steel, Copper and Freight Costs Squeeze Rack Economics
2.3.2.2 Legacy Floor Loading and Ceiling Limits Block Dense Cabinets
2.3.3 Market Opportunities
2.3.3.1 Liquid-Ready Cabinets Open a Premium Product Tier
2.3.3.2 Edge and Micro Data Centres Create New Enclosure Demand
3. Global Data Center Rack Market Outlook, 2026–2033
3.1 Global Data Center Rack Market Outlook, by Rack Type, Value (US$ Billion), 2026–2033
3.1.1 Open Frame Racks
3.1.2 Enclosed Rack Cabinets
3.1.3 Containment-Ready Cabinets
3.1.4 Wall-Mount Racks
3.2 Global Data Center Rack Market Outlook, by Rack Height, Value (US$ Billion), 2026–2033
3.2.1 Below 42U
3.2.2 42U
3.2.3 45U to 48U
3.2.4 Above 48U
3.3 Global Data Center Rack Market Outlook, by Data Centre Type, Value (US$ Billion), 2026–2033
3.3.1 Hyperscale
3.3.2 Colocation
3.3.3 Enterprise
3.3.4 Edge
3.4 Global Data Center Rack Market Outlook, by End User, Value (US$ Billion), 2026–2033
3.4.1 IT and Telecom
3.4.2 BFSI
3.4.3 Government and Defence
3.4.4 Healthcare
3.4.5 Retail and E-commerce
3.4.6 Others
3.5 Global Data Center Rack Market Outlook, by Region, Value (US$ Billion), 2026–2033
3.5.1 North America
3.5.2 Europe
3.5.3 Asia Pacific
3.5.4 Latin America
3.5.5 Middle East & Africa
4. North America Data Center Rack Market Outlook, 2026–2033
4.1 North America Data Center Rack Market Outlook, by Rack Type, Value (US$ Billion), 2026–2033
4.1.1 Open Frame Racks
4.1.2 Enclosed Rack Cabinets
4.1.3 Containment-Ready Cabinets
4.1.4 Wall-Mount Racks
4.2 North America Data Center Rack Market Outlook, by Rack Height, Value (US$ Billion), 2026–2033
4.2.1 Below 42U
4.2.2 42U
4.2.3 45U to 48U
4.2.4 Above 48U
4.3 North America Data Center Rack Market Outlook, by Data Centre Type, Value (US$ Billion), 2026–2033
4.3.1 Hyperscale
4.3.2 Colocation
4.3.3 Enterprise
4.3.4 Edge
4.4 North America Data Center Rack Market Outlook, by End User, Value (US$ Billion), 2026–2033
4.4.1 IT and Telecom
4.4.2 BFSI
4.4.3 Government and Defence
4.4.4 Healthcare
4.4.5 Retail and E-commerce
4.4.6 Others
4.5 North America Data Center Rack Market Outlook, by Country, Value (US$ Billion), 2026–2033
4.5.1 United States Data Center Rack Market Outlook, by Rack Type, 2026–2033
4.5.2 United States Data Center Rack Market Outlook, by Rack Height, 2026–2033
4.5.3 United States Data Center Rack Market Outlook, by Data Centre Type, 2026–2033
4.5.4 United States Data Center Rack Market Outlook, by End User, 2026–2033
4.5.5 Canada Data Center Rack Market Outlook, by Rack Type, 2026–2033
4.5.6 Canada Data Center Rack Market Outlook, by Rack Height, 2026–2033
4.5.7 Canada Data Center Rack Market Outlook, by Data Centre Type, 2026–2033
4.5.8 Canada Data Center Rack Market Outlook, by End User, 2026–2033
5. Europe Data Center Rack Market Outlook, 2026–2033
5.1 Europe Data Center Rack Market Outlook, by Rack Type, Value (US$ Billion), 2026–2033
5.1.1 Open Frame Racks
5.1.2 Enclosed Rack Cabinets
5.1.3 Containment-Ready Cabinets
5.1.4 Wall-Mount Racks
5.2 Europe Data Center Rack Market Outlook, by Rack Height, Value (US$ Billion), 2026–2033
5.2.1 Below 42U
5.2.2 42U
5.2.3 45U to 48U
5.2.4 Above 48U
5.3 Europe Data Center Rack Market Outlook, by Data Centre Type, Value (US$ Billion), 2026–2033
5.3.1 Hyperscale
5.3.2 Colocation
5.3.3 Enterprise
5.3.4 Edge
5.4 Europe Data Center Rack Market Outlook, by End User, Value (US$ Billion), 2026–2033
5.4.1 IT and Telecom
5.4.2 BFSI
5.4.3 Government and Defence
5.4.4 Healthcare
5.4.5 Retail and E-commerce
5.4.6 Others
5.5 Europe Data Center Rack Market Outlook, by Country and Subregion, Value (US$ Billion), 2026–2033
5.5.1 Germany Data Center Rack Market Outlook, by Rack Type, 2026–2033
5.5.2 Germany Data Center Rack Market Outlook, by Rack Height, 2026–2033
5.5.3 Germany Data Center Rack Market Outlook, by Data Centre Type, 2026–2033
5.5.4 Germany Data Center Rack Market Outlook, by End User, 2026–2033
5.5.5 United Kingdom Data Center Rack Market Outlook, by Rack Type, 2026–2033
5.5.6 United Kingdom Data Center Rack Market Outlook, by Rack Height, 2026–2033
5.5.7 United Kingdom Data Center Rack Market Outlook, by Data Centre Type, 2026–2033
5.5.8 United Kingdom Data Center Rack Market Outlook, by End User, 2026–2033
5.5.9 Netherlands Data Center Rack Market Outlook, by Rack Type, 2026–2033
5.5.10 Netherlands Data Center Rack Market Outlook, by Rack Height, 2026–2033
5.5.11 Netherlands Data Center Rack Market Outlook, by Data Centre Type, 2026–2033
5.5.12 Netherlands Data Center Rack Market Outlook, by End User, 2026–2033
5.5.13 Ireland Data Center Rack Market Outlook, by Rack Type, 2026–2033
5.5.14 Ireland Data Center Rack Market Outlook, by Rack Height, 2026–2033
5.5.15 Ireland Data Center Rack Market Outlook, by Data Centre Type, 2026–2033
5.5.16 Ireland Data Center Rack Market Outlook, by End User, 2026–2033
5.5.17 Nordic countries Data Center Rack Market Outlook, by Rack Type, 2026–2033
5.5.18 Nordic countries Data Center Rack Market Outlook, by Rack Height, 2026–2033
5.5.19 Nordic countries Data Center Rack Market Outlook, by Data Centre Type, 2026–2033
5.5.20 Nordic countries Data Center Rack Market Outlook, by End User, 2026–2033
6. Asia Pacific Data Center Rack Market Outlook, 2026–2033
6.1 Asia Pacific Data Center Rack Market Outlook, by Rack Type, Value (US$ Billion), 2026–2033
6.1.1 Open Frame Racks
6.1.2 Enclosed Rack Cabinets
6.1.3 Containment-Ready Cabinets
6.1.4 Wall-Mount Racks
6.2 Asia Pacific Data Center Rack Market Outlook, by Rack Height, Value (US$ Billion), 2026–2033
6.2.1 Below 42U
6.2.2 42U
6.2.3 45U to 48U
6.2.4 Above 48U
6.3 Asia Pacific Data Center Rack Market Outlook, by Data Centre Type, Value (US$ Billion), 2026–2033
6.3.1 Hyperscale
6.3.2 Colocation
6.3.3 Enterprise
6.3.4 Edge
6.4 Asia Pacific Data Center Rack Market Outlook, by End User, Value (US$ Billion), 2026–2033
6.4.1 IT and Telecom
6.4.2 BFSI
6.4.3 Government and Defence
6.4.4 Healthcare
6.4.5 Retail and E-commerce
6.4.6 Others
6.5 Asia Pacific Data Center Rack Market Outlook, by Country, Value (US$ Billion), 2026–2033
6.5.1 China Data Center Rack Market Outlook, by Rack Type, 2026–2033
6.5.2 China Data Center Rack Market Outlook, by Rack Height, 2026–2033
6.5.3 China Data Center Rack Market Outlook, by Data Centre Type, 2026–2033
6.5.4 China Data Center Rack Market Outlook, by End User, 2026–2033
6.5.5 India Data Center Rack Market Outlook, by Rack Type, 2026–2033
6.5.6 India Data Center Rack Market Outlook, by Rack Height, 2026–2033
6.5.7 India Data Center Rack Market Outlook, by Data Centre Type, 2026–2033
6.5.8 India Data Center Rack Market Outlook, by End User, 2026–2033
6.5.9 Japan Data Center Rack Market Outlook, by Rack Type, 2026–2033
6.5.10 Japan Data Center Rack Market Outlook, by Rack Height, 2026–2033
6.5.11 Japan Data Center Rack Market Outlook, by Data Centre Type, 2026–2033
6.5.12 Japan Data Center Rack Market Outlook, by End User, 2026–2033
6.5.13 Singapore Data Center Rack Market Outlook, by Rack Type, 2026–2033
6.5.14 Singapore Data Center Rack Market Outlook, by Rack Height, 2026–2033
6.5.15 Singapore Data Center Rack Market Outlook, by Data Centre Type, 2026–2033
6.5.16 Singapore Data Center Rack Market Outlook, by End User, 2026–2033
6.5.17 Malaysia Data Center Rack Market Outlook, by Rack Type, 2026–2033
6.5.18 Malaysia Data Center Rack Market Outlook, by Rack Height, 2026–2033
6.5.19 Malaysia Data Center Rack Market Outlook, by Data Centre Type, 2026–2033
6.5.20 Malaysia Data Center Rack Market Outlook, by End User, 2026–2033
6.5.21 South Korea Data Center Rack Market Outlook, by Rack Type, 2026–2033
6.5.22 South Korea Data Center Rack Market Outlook, by Rack Height, 2026–2033
6.5.23 South Korea Data Center Rack Market Outlook, by Data Centre Type, 2026–2033
6.5.24 South Korea Data Center Rack Market Outlook, by End User, 2026–2033
6.5.25 Australia Data Center Rack Market Outlook, by Rack Type, 2026–2033
6.5.26 Australia Data Center Rack Market Outlook, by Rack Height, 2026–2033
6.5.27 Australia Data Center Rack Market Outlook, by Data Centre Type, 2026–2033
6.5.28 Australia Data Center Rack Market Outlook, by End User, 2026–2033
7. Latin America Data Center Rack Market Outlook, 2026–2033
7.1 Latin America Data Center Rack Market Outlook, by Rack Type, Value (US$ Billion), 2026–2033
7.1.1 Open Frame Racks
7.1.2 Enclosed Rack Cabinets
7.1.3 Containment-Ready Cabinets
7.1.4 Wall-Mount Racks
7.2 Latin America Data Center Rack Market Outlook, by Rack Height, Value (US$ Billion), 2026–2033
7.2.1 Below 42U
7.2.2 42U
7.2.3 45U to 48U
7.2.4 Above 48U
7.3 Latin America Data Center Rack Market Outlook, by Data Centre Type, Value (US$ Billion), 2026–2033
7.3.1 Hyperscale
7.3.2 Colocation
7.3.3 Enterprise
7.3.4 Edge
7.4 Latin America Data Center Rack Market Outlook, by End User, Value (US$ Billion), 2026–2033
7.4.1 IT and Telecom
7.4.2 BFSI
7.4.3 Government and Defence
7.4.4 Healthcare
7.4.5 Retail and E-commerce
7.4.6 Others
7.5 Latin America Data Center Rack Market Outlook, by Country, Value (US$ Billion), 2026–2033
7.5.1 Brazil Data Center Rack Market Outlook, by Rack Type, 2026–2033
7.5.2 Brazil Data Center Rack Market Outlook, by Rack Height, 2026–2033
7.5.3 Brazil Data Center Rack Market Outlook, by Data Centre Type, 2026–2033
7.5.4 Brazil Data Center Rack Market Outlook, by End User, 2026–2033
7.5.5 Mexico Data Center Rack Market Outlook, by Rack Type, 2026–2033
7.5.6 Mexico Data Center Rack Market Outlook, by Rack Height, 2026–2033
7.5.7 Mexico Data Center Rack Market Outlook, by Data Centre Type, 2026–2033
7.5.8 Mexico Data Center Rack Market Outlook, by End User, 2026–2033
7.5.9 Chile Data Center Rack Market Outlook, by Rack Type, 2026–2033
7.5.10 Chile Data Center Rack Market Outlook, by Rack Height, 2026–2033
7.5.11 Chile Data Center Rack Market Outlook, by Data Centre Type, 2026–2033
7.5.12 Chile Data Center Rack Market Outlook, by End User, 2026–2033
7.5.13 Colombia Data Center Rack Market Outlook, by Rack Type, 2026–2033
7.5.14 Colombia Data Center Rack Market Outlook, by Rack Height, 2026–2033
7.5.15 Colombia Data Center Rack Market Outlook, by Data Centre Type, 2026–2033
7.5.16 Colombia Data Center Rack Market Outlook, by End User, 2026–2033
7.5.17 United States Data Center Rack Market Outlook, by Rack Type, 2026–2033
7.5.18 United States Data Center Rack Market Outlook, by Rack Height, 2026–2033
7.5.19 United States Data Center Rack Market Outlook, by Data Centre Type, 2026–2033
7.5.20 United States Data Center Rack Market Outlook, by End User, 2026–2033
8. Middle East & Africa Data Center Rack Market Outlook, 2026–2033
8.1 Middle East & Africa Data Center Rack Market Outlook, by Rack Type, Value (US$ Billion), 2026–2033
8.1.1 Open Frame Racks
8.1.2 Enclosed Rack Cabinets
8.1.3 Containment-Ready Cabinets
8.1.4 Wall-Mount Racks
8.2 Middle East & Africa Data Center Rack Market Outlook, by Rack Height, Value (US$ Billion), 2026–2033
8.2.1 Below 42U
8.2.2 42U
8.2.3 45U to 48U
8.2.4 Above 48U
8.3 Middle East & Africa Data Center Rack Market Outlook, by Data Centre Type, Value (US$ Billion), 2026–2033
8.3.1 Hyperscale
8.3.2 Colocation
8.3.3 Enterprise
8.3.4 Edge
8.4 Middle East & Africa Data Center Rack Market Outlook, by End User, Value (US$ Billion), 2026–2033
8.4.1 IT and Telecom
8.4.2 BFSI
8.4.3 Government and Defence
8.4.4 Healthcare
8.4.5 Retail and E-commerce
8.4.6 Others
8.5 Middle East & Africa Data Center Rack Market Outlook, by Country, Value (US$ Billion), 2026–2033
8.5.1 United Arab Emirates Data Center Rack Market Outlook, by Rack Type, 2026–2033
8.5.2 United Arab Emirates Data Center Rack Market Outlook, by Rack Height, 2026–2033
8.5.3 United Arab Emirates Data Center Rack Market Outlook, by Data Centre Type, 2026–2033
8.5.4 United Arab Emirates Data Center Rack Market Outlook, by End User, 2026–2033
8.5.5 Saudi Arabia Data Center Rack Market Outlook, by Rack Type, 2026–2033
8.5.6 Saudi Arabia Data Center Rack Market Outlook, by Rack Height, 2026–2033
8.5.7 Saudi Arabia Data Center Rack Market Outlook, by Data Centre Type, 2026–2033
8.5.8 Saudi Arabia Data Center Rack Market Outlook, by End User, 2026–2033
8.5.9 Qatar Data Center Rack Market Outlook, by Rack Type, 2026–2033
8.5.10 Qatar Data Center Rack Market Outlook, by Rack Height, 2026–2033
8.5.11 Qatar Data Center Rack Market Outlook, by Data Centre Type, 2026–2033
8.5.12 Qatar Data Center Rack Market Outlook, by End User, 2026–2033
8.5.13 South Africa Data Center Rack Market Outlook, by Rack Type, 2026–2033
8.5.14 South Africa Data Center Rack Market Outlook, by Rack Height, 2026–2033
8.5.15 South Africa Data Center Rack Market Outlook, by Data Centre Type, 2026–2033
8.5.16 South Africa Data Center Rack Market Outlook, by End User, 2026–2033
8.5.17 Nigeria Data Center Rack Market Outlook, by Rack Type, 2026–2033
8.5.18 Nigeria Data Center Rack Market Outlook, by Rack Height, 2026–2033
8.5.19 Nigeria Data Center Rack Market Outlook, by Data Centre Type, 2026–2033
8.5.20 Nigeria Data Center Rack Market Outlook, by End User, 2026–2033
8.5.21 Kenya Data Center Rack Market Outlook, by Rack Type, 2026–2033
8.5.22 Kenya Data Center Rack Market Outlook, by Rack Height, 2026–2033
8.5.23 Kenya Data Center Rack Market Outlook, by Data Centre Type, 2026–2033
8.5.24 Kenya Data Center Rack Market Outlook, by End User, 2026–2033
9. Competitive Landscape
9.1 Industry Leaders
9.2 Company Profiles
9.2.1 Vertiv Holdings Co
9.2.2 Schneider Electric SE
9.2.3 Eaton Corporation plc
9.2.4 Legrand SA
9.2.5 Rittal GmbH & Co. KG
9.2.6 nVent Electric plc
9.2.7 Panduit Corp.
9.2.8 Chatsworth Products, Inc.
9.2.9 Belden Inc.
9.2.10 Delta Electronics, Inc.
9.2.11 Hewlett Packard Enterprise Company
9.2.12 Dell Technologies Inc.
9.2.13 Super Micro Computer, Inc.
9.2.14 Great Lakes Data Racks & Cabinets
9.2.15 ABB Ltd
10. Appendix
10.1 Research Methodology
10.2 Report Assumptions
10.3 Acronyms and Abbreviations
| By Rack Type | Open Frame Racks, Enclosed Rack Cabinets, Containment-Ready Cabinets, Wall-Mount Racks |
| By Rack Height | Below 42U, 42U, 45U to 48U, Above 48U |
| By Data Centre Type | Hyperscale, Colocation, Enterprise, Edge |
| By End User | IT and Telecom, BFSI, Government and Defence, Healthcare, Retail and E-commerce, Others |
| By Region | North America, Europe, Asia Pacific, Latin America, Middle East & Africa |
Our Research Methodology
Considering the volatility of business today, traditional approaches to strategizing a game plan can be unfruitful if not detrimental. True ambiguity is no way to determine a forecast. A myriad of predetermined factors must be accounted for such as the degree of risk involved, the magnitude of circumstances, as well as conditions or consequences that are not known or unpredictable. To circumvent binary views that cast uncertainty, the application of market research intelligence to strategically posture, move, and enable actionable outcomes is necessary.
View Methodology
Quality Assured
Rigorous Validation Process

Confidentiality Assured
End-to-end Data Security

Custom Research Services
Tailored To Your Objectives
FAQs
The global Data Center Rack market is valued at US$ 5.6 billion in 2026 and is projected to reach US$ 11.5 billion by 2033.
Enclosed rack cabinets lead with 54% share in 2026, because sealed, lockable enclosures support containment, airflow control and physical security inside shared data halls.
Hyperscale facilities account for 41% of 2026 demand, while edge sites expand fastest at a 15.2% CAGR through 2033 from a smaller installed base.
Asia Pacific grows fastest at a 13.0% CAGR between 2026 and 2033, supported by sovereign cloud mandates and rapid colocation capacity additions across the region.
Vertiv, Schneider Electric, Eaton, Legrand, Rittal, nVent, Panduit and Chatsworth Products compete across enclosures, power distribution, cable management and thermal containment accessories worldwide.
Related Reports
SiC GaN Power Semiconductor Market Size, Share, Insights, Competitive Landscape, and Forecast 2026 to 2033
Explore the SiC GaN power semiconductor market outlook for 2026–2033, covering products, power ranges, applications, regions, and key companies.
Serverless Architecture Market Size, Share, Insights, Competitive Landscape, and Forecast 2026 to 2033
Explore the serverless architecture market outlook for 2026–2033, covering services, deployment models, industries, regional trends, and key companies.
Network Sandboxing Market Size, Share, Insights, Competitive Landscape, and Forecast 2026 to 2033
The global network sandboxing market is valued at US$5.8 billion in 2026, reaching US$14.7 billion by 2033, growing at a 14.2% CAGR
Location of Things Market Size, Share, Insights, Competitive Landscape, and Forecast 2026 to 2033
The global location of things market is valued at US$52.31 billion in 2026, reaching US$297.93 billion by 2033, growing at a 28.2% CAGR
Chemical Mechanical Planarization Market Size, Share, Insights, Competitive Landscape, and Forecast 2026 to 2033
The global chemical mechanical planarization market is valued at US$7.2 billion in 2026, reaching US$11.95 billion by 2033, growing at a 7.5% CAGR
Contact Center as a Service Market Size, Share, Insights, Competitive Landscape, and Forecast 2026 to 2033
Explore the contact center as a service market outlook for 2026–2033, including cloud deployment, AI tooling, regional trends, and competitive insights.