



Electric Two Wheeler Market
Electric Two Wheeler Market Size, Share, Insights, Competitive Landscape, and Forecast 2026 to 2033
How Fast Will the Electric Two Wheeler Market Grow?
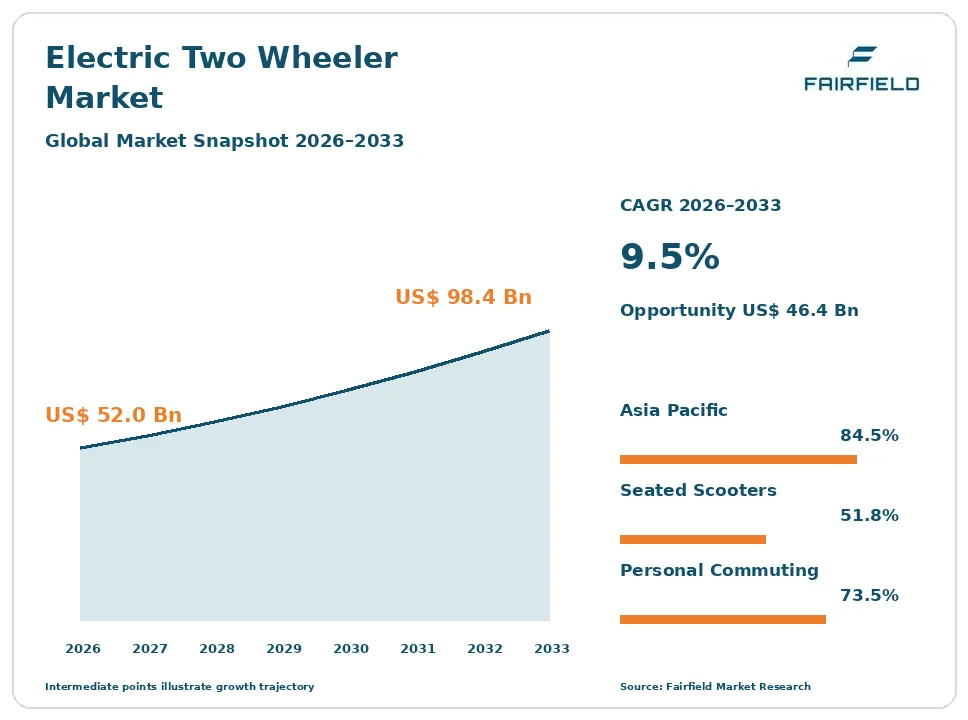
The global electric two wheeler market size is expected to be valued at US$ 52.0 billion in 2026 and projected to reach US$ 98.4 billion by 2033, growing at a CAGR of 9.5% between 2026 and 2033.
Between 2020 and 2025 the market expanded at roughly 18.6% a year, driven almost entirely by China and India, with growth interrupted whenever purchase incentives were cut. Three forces carry the slower but steadier growth to 2033. Running cost per kilometre against petrol remains the decisive purchase argument in the markets where these vehicles actually sell. Delivery and ride-hailing fleets buy on payback arithmetic rather than preference. Battery safety standards introduced after fire incidents have raised build quality and consolidated supply. The direction is a maturing volume market, with unit growth outpacing value growth as entry-tier pricing tightens.
Key Report Takeaways
- By Vehicle Type: Seated step-through electric scooters held 51.8% share in 2026, while electric motorcycles are projected to expand at a 12.4% CAGR through 2033, driven by riders trading up from commuter petrol motorcycles as usable range passes everyday needs.
- By Battery Capacity and Voltage Class: Packs below 1.5 kWh on 48-volt systems held 40.6% share in 2026, while the 3.0–5.0 kWh class is projected to grow at a 13.6% CAGR through 2033, supported by higher-speed vehicle classes and fleet duty cycles.
- By Battery Technology and Pack Architecture: Lithium iron phosphate fixed packs held 36.5% share in 2026, while swappable lithium packs are projected to advance at a 15.8% CAGR through 2033, driven by commercial operators who value zero downtime over pack ownership.
- By End Use: Personal commuting held 73.5% share in 2026, while last-mile delivery and logistics fleets are projected to expand at a 14.6% CAGR through 2033, because high daily mileage shortens payback to well under two years.
- By Price Tier: The entry tier below US$ 1,000 held 45.8% share in 2026, while the premium tier above US$ 2,000 is projected to grow at a 12.9% CAGR through 2033, supported by connected features and longer warranty cover.
- By Geography: Asia Pacific held 84.5% share in 2026, while Latin America is projected to post a 14.8% CAGR through 2033, driven by delivery platform fleets in dense capital cities and by imported low-cost models.
Global Electric Two Wheeler Market Trends and Insights
Drivers Impact Analysis
| Driver | Impact on CAGR Forecast | Geographic Relevance | Impact Timeline |
| Running cost per kilometre against petrol in high-use commuting markets | High | Asia Pacific, Latin America, Middle East & Africa | Short term (≤2 years) |
| Delivery and ride-hailing fleet procurement on payback arithmetic | High | Asia Pacific, Europe, Latin America | Medium term (2–4 years) |
Two commercial forces, not environmental preference, account for most of the demand added through 2033.
Running Cost Per Kilometre Against Petrol Decides Electric Two Wheeler Purchases
Total cost of ownership is the entire argument for these vehicles in the markets where they sell in volume. A commuter comparing a petrol scooter with an electric one is weighing fuel spend against electricity, plus the service items an electric drivetrain removes. There is no engine oil, no spark plug, no clutch and no exhaust, and braking wear falls where regeneration is fitted. Buyers run that arithmetic before considering emissions.
The mechanism is daily mileage. A rider covering thirty to sixty kilometres a day accumulates enough fuel saving to recover a price premium inside two to three years, and shorter where petrol is taxed heavily or electricity is subsidised. Lithium iron phosphate cell pricing has fallen far enough that the premium itself has narrowed. Where petrol prices are low or daily distance is short, the arithmetic fails, which is why adoption clusters in specific cities rather than spreading evenly.
Delivery and Ride-Hailing Fleet Procurement Converts Payback Into Bulk Electric Two Wheeler Orders
Commercial fleets are the most reliable source of incremental demand, because they buy on a spreadsheet rather than on preference. A food delivery or parcel rider covers well over a hundred kilometres in a shift, which compresses payback to months rather than years. Fleet operators also value the predictability of energy cost, since electricity tariffs move less violently than fuel prices in most of the markets concerned.
The underlying mechanism is duty cycle economics combined with procurement scale. Platform operators and logistics companies specify vehicles centrally, negotiate service contracts and often lease rather than sell to riders, which removes the individual’s financing barrier. Fleet buyers also tolerate smaller battery packs supported by swapping or depot charging, since route distance is known. City authorities in China, India, Indonesia and Vietnam have encouraged this shift through fleet registration and parking rules that favour electric commercial two-wheelers.
Restraints Impact Analysis
| Restraint | Impact on CAGR Forecast | Geographic Relevance | Impact Timeline |
| Dependence on purchase incentives that are repeatedly restructured or withdrawn | High | Asia Pacific, Europe | Short term (≤2 years) |
| Battery fire incidents and the resulting safety certification burden | Medium | Asia Pacific | Medium term (2–4 years) |
Two pressures explain why demand in this market is unusually volatile from year to year.
Purchase Incentive Restructuring Makes Electric Two Wheeler Demand Policy-Sensitive
Subsidy dependence in this market is real and it has been destabilising. Monthly registrations in major markets have fallen sharply within weeks of an incentive being reduced, and recovered only when a successor scheme appeared. That pattern tells buyers and manufacturers the same thing: a meaningful share of demand sits at a price point that exists only because a government is paying part of it. Planning production against that is difficult.
The cause is the structure of the schemes themselves. Incentives have typically been set per kilowatt-hour with a cap expressed as a percentage of vehicle price, funded from a fixed budget and revised when that budget runs down. India has moved through successive schemes with different per-kilowatt-hour rates and caps, and each revision changed showroom prices overnight. Manufacturers respond by holding inventory, discounting against their own margin or relaunching variants with different battery sizes to fit a new cap.
Battery Safety Certification After Fire Incidents Raises the Cost of Building an Electric Two Wheeler
Battery fires changed this product category permanently, and the compliance cost falls hardest on small assemblers. A cluster of thermal runaway incidents in parked and charging vehicles brought regulatory attention to cell quality, pack design, battery management systems and charger compatibility. Certification now requires documented cell traceability, thermal propagation testing and management system validation, which a workshop-scale assembler buying imported cells and generic controllers cannot produce.
The mechanism is testing cost and design rework rather than a single rule. Amended AIS-156 requirements in India added battery pack, cell and management system provisions with phased compliance dates, and type approval had to be regained for affected models. UN 38.3 transport testing applies to every pack shipped, and UNECE Regulation No. 136 sets electric powertrain safety requirements for L-category vehicles. Residual value uncertainty compounds the problem, because second-hand buyers discount vehicles whose pack history is undocumented.
Market Opportunities
Battery Swapping Networks Open an Energy-as-a-Service Revenue Pool Beyond Vehicle Sales
Battery swapping converts a one-time vehicle sale into recurring energy revenue, and commercial fleets are the customers who make it work. A delivery rider loses money while charging, so paying per swap to exchange a depleted pack in under two minutes is economically rational even at a premium to grid electricity. Separating the pack from the vehicle also removes the most expensive component from the purchase price, which lowers the entry barrier for riders.
Network operators, energy companies and fleet platforms can capture this pool, and the demand comes from delivery, courier and ride-hailing operators rather than private commuters. Swapping only works at density, so networks are built city by city around rider corridors. Interoperability standards work in India, China, Taiwan and Indonesia is gradually reducing the risk that a station serves only one brand, which is the main obstacle to third-party network investment.
Exports to Countries With Large Petrol Two-Wheeler Parcs Create a New Electric Two Wheeler Demand Pool
Markets with tens of millions of petrol two-wheelers already on the road are the largest untapped pool for electric replacements. Countries where the two-wheeler is primary household transport have the fuel-spend profile that makes the switch pay, but limited domestic manufacturing. That gap is a direct export opportunity for manufacturers with scale, and increasingly for complete-knocked-down assembly arrangements that avoid import duty on finished vehicles.
Manufacturers in China and India are best placed to capture it, because their cost base was built for price-sensitive home markets. Demand comes from urban commuters and delivery riders in Indonesia, Vietnam, the Philippines, Nigeria, Kenya, Brazil and Colombia. Local assembly, dealer service networks and financing partnerships determine who succeeds, since a vehicle without a service chain loses residual value quickly and damages repeat demand.
Segment Analysis
By Vehicle Type: Seated Step-Through Scooters Lead While Electric Motorcycles Gain Pace
Seated step-through electric scooters held 51.8% of market value in 2026, the dominant body style because it matches the petrol scooter that most urban Asian households already own. The format suits short trips, carries a passenger and offers under-seat storage, and its low floor makes it practical in traffic. Electric mopeds followed at 22.4%, concentrated in lower-speed urban use, while kick-start-class commuter two-wheelers accounted for 7.2%.
Electric motorcycles hold 18.6% share and grow fastest at a 12.4% CAGR through 2033. The shift reflects usable range and top speed reaching the point where a rider replacing a commuter motorcycle no longer compromises. Higher-voltage architectures and larger packs make that possible, and the segment carries the highest average selling price in the market. The implication is that value growth concentrates in motorcycles even as scooters continue to carry unit volume.
By Battery Capacity and Voltage Class: Small 48-Volt Packs Dominate as Mid-Size Packs Expand Fastest
Packs below 1.5 kWh on 48-volt systems held 40.6% share in 2026, the largest class because they power the low-speed vehicles that dominate Chinese city streets and the entry models sold elsewhere. The 1.5–3.0 kWh class on 60-volt and 72-volt systems took 34.2%, covering mainstream commuter scooters, while packs above 5.0 kWh on high-voltage architectures accounted for 7.7% of value.
The 3.0–5.0 kWh class holds 17.5% share and grows fastest at a 13.6% CAGR through 2033. Demand comes from higher-speed vehicle classes that must meet full type approval, and from fleets needing a full shift without a mid-day charge. Larger packs require better thermal management and more capable battery management systems, which raises the engineering threshold. The business implication is that capacity growth pulls the market toward manufacturers with genuine electrical engineering capability.
By Battery Technology and Pack Architecture: Lithium Iron Phosphate Leads While Swappable Packs Accelerate
Lithium iron phosphate fixed packs held 36.5% share in 2026, overtaking other chemistries because the cells are cheap, tolerant of fast charging and far less prone to thermal runaway than alternatives. Nickel manganese cobalt fixed packs took 27.4%, preferred where energy density and weight matter more than cost. Lead-acid fixed packs still accounted for 24.8%, concentrated in the cheapest vehicles, but their share is falling steadily as lithium pricing declines.
Swappable lithium packs hold 11.3% share and expand fastest at a 15.8% CAGR through 2033. Fleet operators adopt them because downtime costs more than pack ownership, and separating the battery from the vehicle lowers the purchase price for riders. Standardised form factors and interoperability work in several countries are reducing the single-brand risk. The implication is that battery ownership is gradually moving from the rider to network operators and financiers.
By End Use: Personal Commuting Carries Volume While Delivery Fleets Grow Quickest
Personal commuting represented 73.5% of demand in 2026, by far the largest end use, because the household commuter vehicle is what this product replaces. Ride-hailing and rental fleets took 6.8%, concentrated in cities where two-wheeler taxis are licensed, and commercial and institutional fleets, covering postal services, utilities and campus operations, accounted for 4.5%. Private buyers remain the most price-sensitive group in the market.
Last-mile delivery and logistics fleets hold 15.2% share and grow fastest at a 14.6% CAGR through 2033. High daily mileage compresses payback to well under two years, and centralised procurement removes the financing barrier individual riders face. These buyers also accept swappable packs and depot charging that private owners dislike. The implication is that fleet specifications, not consumer taste, increasingly drive product requirements such as load racks and pack durability.
By Price Tier: Entry-Tier Models Hold Share as Premium Vehicles Grow Fastest
The entry tier below US$ 1,000 held 45.8% of value in 2026, the largest band because it covers the lead-acid and small lithium vehicles that sell in the greatest numbers across Chinese and Indian cities. The mid tier between US$ 1,000 and US$ 2,000 took 36.4%, representing mainstream lithium commuter scooters with type approval for higher speeds and better component quality.
The premium tier above US$ 2,000 holds 17.8% share and grows fastest at a 12.9% CAGR through 2033. Buyers in this band pay for larger packs, higher speed classes, connected telematics, longer battery warranties and dealer service networks. Safety certification costs have also pushed some models upward in price, since compliant cells and management systems cannot be fitted to the cheapest builds. The implication is that margin, unlike volume, is migrating up the price ladder.
Geography Analysis
North America Keeps Electric Two Wheelers a Niche Beside Car-Centred Commuting
North America accounted for 3.5% of market value in 2026 and grows at 9.0% a year to 2033, the slowest regional rate. The United States and Canada have no mass two-wheeler commuting culture, so demand concentrates in urban delivery riders, campus fleets and recreational electric motorcycles rather than in household transport. Average selling prices are the highest anywhere, which keeps value share well above unit share.
The main constraints are structural rather than regulatory. Road design, climate and long commuting distances favour cars, and insurance and licensing for powered two-wheelers deter casual buyers. Where adoption does happen, it follows dense food delivery markets in large cities. The clearest change is fire safety attention to uncertified imported batteries, which has prompted local rules on charging in residential buildings and pushed buyers toward certified products sold through established dealers.
Europe Builds Demand Around Type Approval and Urban Access Rules
Europe held 7.5% share in 2026 and grows at 10.2% through 2033. Italy, France, Spain, Germany and the Netherlands account for most registrations, with scooter commuting long established in southern cities. The region’s distinctive feature is regulatory structure: the L-category vehicle type-approval regulation defines moped and motorcycle classes, sets functional safety requirements and determines which licence a rider needs, which shapes exactly how products are specified.
Urban policy drives the rest. Low-emission zones, city centre access restrictions and parking privileges give electric two-wheelers practical advantages that fuel savings alone would not deliver. Delivery platforms in dense cities are the fastest-moving buyer group. The barrier is price: compliant vehicles with full type approval cost considerably more than the entry models sold in other markets, and purchase incentives vary widely between member states. The opportunity lies in fleet leasing arrangements that spread that cost.
Which Region Is Leading the Electric Two Wheeler Market?
Asia Pacific is leading the electric two wheeler market, with 84.5% share in 2026 and a 9.2% CAGR to 2033. This is not a marginal lead; the global market is essentially a story about two countries. China is by far the largest market and also the manufacturing base, with a domestic parc running into the hundreds of millions and a supply chain covering cells, motors, controllers and frames. India is the fastest-growing major market, where electric models now take a meaningful share of new scooter registrations.
Three causes explain the concentration. The two-wheeler is primary household transport across the region, so the fuel-saving arithmetic applies to tens of millions of daily riders. Local cell manufacturing keeps vehicle prices at levels unreachable elsewhere. National standards, including China’s electric bicycle specification and India’s battery safety requirements, have raised quality and pushed out marginal assemblers. The change to watch is charging and parking provision in dense apartment housing, which limits adoption more than price does.
Which Region Is Growing Fastest in the Electric Two Wheeler Market?
Latin America is growing fastest in the electric two wheeler market, at a 14.8% CAGR through 2033 from a 2.5% share in 2026, the smallest base of the five regions. Brazil, Colombia, Mexico and Peru drive most of the increase. Delivery platform fleets in dense capital cities are the first mover, because riders covering long daily distances recover the price premium quickly against petrol bought at import-linked prices.
Two causes support the pace. Motorcycle commuting is already normal across much of the region, so the vehicle format needs no introduction, only a change of drivetrain. Separately, imported low-cost models from Asian manufacturers have reached price points that local buyers can finance. The barriers are serious: limited dealer and service networks, scarce certified charging in older housing, and currency movements that make imported vehicles unpredictably expensive. The opportunity is local assembly paired with rider financing.
Middle East & Africa Adopts Electric Two Wheelers Through Delivery and Ride-Hailing Work
Middle East & Africa held 2.0% share in 2026 and grows at 13.5% to 2033, the second-fastest rate. Egypt, Morocco, Nigeria, Kenya, Rwanda and the United Arab Emirates account for most activity. Commercial riding leads adoption here more clearly than anywhere else, because motorcycle taxis and courier work generate the daily mileage that makes electric running costs decisive against petrol bought at unsubsidised prices.
Battery swapping has taken hold faster in several African cities than in wealthier markets, since riders cannot finance a pack and grid reliability makes overnight charging uncertain. The barriers are capital access for operators, import duties on complete vehicles, and the absence of local certification infrastructure to verify battery safety claims. The opportunity is pay-per-swap energy services bundled with vehicle leasing, which matches the daily cash cycle that riders in these markets actually operate on.
Competitive Landscape
The electric two wheeler market has medium concentration globally with a very long tail. A small group of Chinese manufacturers accounts for a large share of worldwide units, while several hundred smaller assemblers compete at the bottom of the Chinese market and across importing countries. In India the structure is different again, with established petrol two-wheeler manufacturers competing against venture-funded entrants that built electric-only product lines. Consolidation has been happening quietly, as safety certification costs and warranty obligations remove assemblers who cannot fund testing or support a battery guarantee.
Competition runs on four things. Price remains decisive in the entry tier, where a difference of a few thousand rupees or renminbi moves volume. Battery quality and warranty length have become the second axis, because fire incidents taught buyers to ask who made the cells and whether the pack was certified. Service network density is the third, since a vehicle with no local repair option loses residual value and generates poor word of mouth. Charging or swapping access is the fourth, and it increasingly determines whether a fleet customer will buy at all.
Strategic activity concentrates on vertical integration and on fleet channels. Larger manufacturers have moved into cell assembly, motor production and battery management software to control cost and warranty exposure. Others have built or partnered into swapping networks, which locks in energy revenue and creates switching cost. Established petrol two-wheeler manufacturers are using existing dealer networks as their main advantage against newer entrants, while newer entrants compete on software features and direct retail.
The broad strategic direction is toward demonstrable quality rather than lowest price. Vendors are investing in certification, warranty capability and service coverage, because those are what survive an incentive withdrawal.
Electric Two Wheeler Industry Leaders
- Yadea Group Holdings Ltd.
- Aima Technology Group Co., Ltd.
- Ola Electric Mobility Limited
- TVS Motor Company Limited
- Honda Motor Co., Ltd.
Recent Industry Developments
- January 2016: The European Union’s L-category vehicle type-approval regulation became applicable to new two- and three-wheel vehicles – it set functional safety, durability and emission requirements that determine how electric mopeds and motorcycles must be specified for the European market.
- January 2016: UNECE Regulation No. 136 on specific requirements for the electric power train of L-category vehicles entered into force – it gave type-approval authorities a common basis for assessing electrical safety and rechargeable energy storage systems on electric two-wheelers.
- April 2019: China’s revised national safety technical specification for electric bicycles took effect, tightening limits on speed, weight and motor power – it reclassified many existing models into the licensed electric motorcycle category and forced a wave of product redesign and inventory clearance.
- June 2023: India reduced the per-kilowatt-hour purchase incentive for electric two-wheelers and lowered the cap expressed as a share of vehicle price – registrations fell immediately, demonstrating how closely demand in the largest growth market tracks the subsidy schedule.
- October 2024: India began its successor electric mobility scheme, restoring time-limited purchase support for electric two-wheelers alongside charging infrastructure funding – it stabilised demand after a disruptive transition but confirmed that policy, not preference, still sets the sales trajectory.
Companies Covered in the Report
- Yadea Group Holdings Ltd.
- Aima Technology Group Co., Ltd.
- Niu Technologies
- Luyuan Group Holding (Cayman) Limited
- Ola Electric Mobility Limited
- TVS Motor Company Limited
- Bajaj Auto Limited
- Hero MotoCorp Limited
- Ather Energy Limited
- Honda Motor Co., Ltd.
- Yamaha Motor Co., Ltd.
- Piaggio & C. SpA
- Gogoro Inc.
- Zero Motorcycles, Inc.
Electric Two Wheeler Market Report Scope
This report covers battery-electric seated two-wheelers built for road use, analysed by vehicle type, battery capacity and voltage class, battery technology and pack architecture, end use and price tier. Bicycles, pedal-assist electric bicycles, three-wheelers, and standing kick-style electric scooters and other micromobility devices are excluded and form a separate market covered elsewhere. The base year is 2025, the forecast period runs from 2026 to 2033, and all values are expressed in US$ Billion.
Vehicle Type
- Electric Scooters (Seated Step-Through)
- Electric Mopeds
- Electric Motorcycles
- Electric Kick-Start-Class Commuter Two-Wheelers
Battery Capacity and Voltage Class
- Below 1.5 kWh (48 V)
- 1.5–3.0 kWh (60–72 V)
- 3.0–5.0 kWh (72–96 V)
- Above 5.0 kWh (High Voltage)
Battery Technology and Pack Architecture
- Lead-Acid Fixed Pack
- Lithium Iron Phosphate Fixed Pack
- Lithium Nickel Manganese Cobalt Fixed Pack
- Swappable Lithium Pack
End Use
- Personal Commuting
- Last-Mile Delivery and Logistics Fleets
- Ride-Hailing and Rental Fleets
- Commercial and Institutional Fleets
Price Tier
- Entry Tier (Below US$ 1,000)
- Mid Tier (US$ 1,000–2,000)
- Premium Tier (Above US$ 2,000)
Regions
- North America
- Europe
- Asia Pacific
- Latin America
- Middle East & Africa
Key Questions Answered in the Report
How big is the electric two wheeler market in 2026?
The global electric two wheeler market is valued at US$ 52.0 billion in 2026, covering battery-electric seated road two-wheelers across all five standard regions.
What is the forecast size and CAGR of the electric two wheeler market by 2033?
The market is projected to reach US$ 98.4 billion by 2033, growing at a 9.5% CAGR and adding an absolute opportunity of US$ 46.4 billion.
Which vehicle type leads the electric two wheeler market?
Seated step-through electric scooters lead with 51.8% share in 2026, because the format matches the petrol scooter most urban Asian households already own.
Which segment and region are growing fastest in the electric two wheeler market?
Swappable lithium packs grow fastest at 15.8%, and Latin America is the fastest region at a 14.8% CAGR through 2033.
Which region holds the largest electric two wheeler market share?
Asia Pacific holds 84.5% share in 2026, because China and India account for almost all global volume and most manufacturing capacity.
1. Executive Summary
1.1. Global Electric Two Wheeler Market Snapshot
1.2. Future Projections
1.3. Key Report Takeaways
1.4. Regional Snapshot
2. Market Overview
2.1. Market Definition and Report Scope
2.2. Historical Trends 2020–2025
2.3. Market Dynamics
2.3.1. Drivers
2.3.1.1. Running Cost Per Kilometre Against Petrol Decides Electric Two Wheeler Purchases
2.3.1.2. Delivery and Ride-Hailing Fleet Procurement Converts Payback Into Bulk Electric Two Wheeler Orders
2.3.2. Restraints
2.3.2.1. Purchase Incentive Restructuring Makes Electric Two Wheeler Demand Policy-Sensitive
2.3.2.2. Battery Safety Certification After Fire Incidents Raises the Cost of Building an Electric Two Wheeler
2.3.3. Market Opportunities
2.3.3.1. Battery Swapping Networks Open an Energy-as-a-Service Revenue Pool Beyond Vehicle Sales
2.3.3.2. Exports to Countries With Large Petrol Two-Wheeler Parcs Create a New Electric Two Wheeler Demand Pool
3. Global Electric Two Wheeler Market Outlook, 2020–2033
3.1. Global Electric Two Wheeler Market Outlook, by Vehicle Type, Value (US$ Billion), 2020–2033
3.1.1. Electric Scooters (Seated Step-Through)
3.1.2. Electric Mopeds
3.1.3. Electric Motorcycles
3.1.4. Electric Kick-Start-Class Commuter Two-Wheelers
3.2. Global Electric Two Wheeler Market Outlook, by Battery Capacity and Voltage Class, Value (US$ Billion), 2020–2033
3.2.1. Below 1.5 kWh (48 V)
3.2.2. 1.5–3.0 kWh (60–72 V)
3.2.3. 3.0–5.0 kWh (72–96 V)
3.2.4. Above 5.0 kWh (High Voltage)
3.3. Global Electric Two Wheeler Market Outlook, by Battery Technology and Pack Architecture, Value (US$ Billion), 2020–2033
3.3.1. Lead-Acid Fixed Pack
3.3.2. Lithium Iron Phosphate Fixed Pack
3.3.3. Lithium Nickel Manganese Cobalt Fixed Pack
3.3.4. Swappable Lithium Pack
3.4. Global Electric Two Wheeler Market Outlook, by End Use, Value (US$ Billion), 2020–2033
3.4.1. Personal Commuting
3.4.2. Last-Mile Delivery and Logistics Fleets
3.4.3. Ride-Hailing and Rental Fleets
3.4.4. Commercial and Institutional Fleets
3.5. Global Electric Two Wheeler Market Outlook, by Price Tier, Value (US$ Billion), 2020–2033
3.5.1. Entry Tier (Below US$ 1,000)
3.5.2. Mid Tier (US$ 1,000–2,000)
3.5.3. Premium Tier (Above US$ 2,000)
3.6. Global Electric Two Wheeler Market Outlook, by Region, Value (US$ Billion), 2020–2033
3.6.1. North America
3.6.2. Europe
3.6.3. Asia Pacific
3.6.4. Latin America
3.6.5. Middle East & Africa
4. North America Electric Two Wheeler Market Outlook, 2020–2033
4.1. North America Electric Two Wheeler Market Outlook, by Vehicle Type, Value (US$ Billion), 2020–2033
4.1.1. Electric Scooters (Seated Step-Through)
4.1.2. Electric Mopeds
4.1.3. Electric Motorcycles
4.1.4. Electric Kick-Start-Class Commuter Two-Wheelers
4.2. North America Electric Two Wheeler Market Outlook, by Battery Capacity and Voltage Class, Value (US$ Billion), 2020–2033
4.2.1. Below 1.5 kWh (48 V)
4.2.2. 1.5–3.0 kWh (60–72 V)
4.2.3. 3.0–5.0 kWh (72–96 V)
4.2.4. Above 5.0 kWh (High Voltage)
4.3. North America Electric Two Wheeler Market Outlook, by Battery Technology and Pack Architecture, Value (US$ Billion), 2020–2033
4.3.1. Lead-Acid Fixed Pack
4.3.2. Lithium Iron Phosphate Fixed Pack
4.3.3. Lithium Nickel Manganese Cobalt Fixed Pack
4.3.4. Swappable Lithium Pack
4.4. North America Electric Two Wheeler Market Outlook, by End Use, Value (US$ Billion), 2020–2033
4.4.1. Personal Commuting
4.4.2. Last-Mile Delivery and Logistics Fleets
4.4.3. Ride-Hailing and Rental Fleets
4.4.4. Commercial and Institutional Fleets
4.5. North America Electric Two Wheeler Market Outlook, by Price Tier, Value (US$ Billion), 2020–2033
4.5.1. Entry Tier (Below US$ 1,000)
4.5.2. Mid Tier (US$ 1,000–2,000)
4.5.3. Premium Tier (Above US$ 2,000)
4.6. North America Electric Two Wheeler Market Outlook, by Country, Value (US$ Billion), 2020–2033
4.6.1. United States Electric Two Wheeler Market Outlook, by Vehicle Type, 2020–2033
4.6.2. United States Electric Two Wheeler Market Outlook, by Battery Capacity and Voltage Class, 2020–2033
4.6.3. United States Electric Two Wheeler Market Outlook, by Battery Technology and Pack Architecture, 2020–2033
4.6.4. United States Electric Two Wheeler Market Outlook, by End Use, 2020–2033
4.6.5. United States Electric Two Wheeler Market Outlook, by Price Tier, 2020–2033
4.6.6. Canada Electric Two Wheeler Market Outlook, by Vehicle Type, 2020–2033
4.6.7. Canada Electric Two Wheeler Market Outlook, by Battery Capacity and Voltage Class, 2020–2033
4.6.8. Canada Electric Two Wheeler Market Outlook, by Battery Technology and Pack Architecture, 2020–2033
4.6.9. Canada Electric Two Wheeler Market Outlook, by End Use, 2020–2033
4.6.10. Canada Electric Two Wheeler Market Outlook, by Price Tier, 2020–2033
5. Europe Electric Two Wheeler Market Outlook, 2020–2033
5.1. Europe Electric Two Wheeler Market Outlook, by Vehicle Type, Value (US$ Billion), 2020–2033
5.1.1. Electric Scooters (Seated Step-Through)
5.1.2. Electric Mopeds
5.1.3. Electric Motorcycles
5.1.4. Electric Kick-Start-Class Commuter Two-Wheelers
5.2. Europe Electric Two Wheeler Market Outlook, by Battery Capacity and Voltage Class, Value (US$ Billion), 2020–2033
5.2.1. Below 1.5 kWh (48 V)
5.2.2. 1.5–3.0 kWh (60–72 V)
5.2.3. 3.0–5.0 kWh (72–96 V)
5.2.4. Above 5.0 kWh (High Voltage)
5.3. Europe Electric Two Wheeler Market Outlook, by Battery Technology and Pack Architecture, Value (US$ Billion), 2020–2033
5.3.1. Lead-Acid Fixed Pack
5.3.2. Lithium Iron Phosphate Fixed Pack
5.3.3. Lithium Nickel Manganese Cobalt Fixed Pack
5.3.4. Swappable Lithium Pack
5.4. Europe Electric Two Wheeler Market Outlook, by End Use, Value (US$ Billion), 2020–2033
5.4.1. Personal Commuting
5.4.2. Last-Mile Delivery and Logistics Fleets
5.4.3. Ride-Hailing and Rental Fleets
5.4.4. Commercial and Institutional Fleets
5.5. Europe Electric Two Wheeler Market Outlook, by Price Tier, Value (US$ Billion), 2020–2033
5.5.1. Entry Tier (Below US$ 1,000)
5.5.2. Mid Tier (US$ 1,000–2,000)
5.5.3. Premium Tier (Above US$ 2,000)
5.6. Europe Electric Two Wheeler Market Outlook, by Country, Value (US$ Billion), 2020–2033
5.6.1. Italy Electric Two Wheeler Market Outlook, by Vehicle Type, 2020–2033
5.6.2. Italy Electric Two Wheeler Market Outlook, by Battery Capacity and Voltage Class, 2020–2033
5.6.3. Italy Electric Two Wheeler Market Outlook, by Battery Technology and Pack Architecture, 2020–2033
5.6.4. Italy Electric Two Wheeler Market Outlook, by End Use, 2020–2033
5.6.5. Italy Electric Two Wheeler Market Outlook, by Price Tier, 2020–2033
5.6.6. France Electric Two Wheeler Market Outlook, by Vehicle Type, 2020–2033
5.6.7. France Electric Two Wheeler Market Outlook, by Battery Capacity and Voltage Class, 2020–2033
5.6.8. France Electric Two Wheeler Market Outlook, by Battery Technology and Pack Architecture, 2020–2033
5.6.9. France Electric Two Wheeler Market Outlook, by End Use, 2020–2033
5.6.10. France Electric Two Wheeler Market Outlook, by Price Tier, 2020–2033
5.6.11. Spain Electric Two Wheeler Market Outlook, by Vehicle Type, 2020–2033
5.6.12. Spain Electric Two Wheeler Market Outlook, by Battery Capacity and Voltage Class, 2020–2033
5.6.13. Spain Electric Two Wheeler Market Outlook, by Battery Technology and Pack Architecture, 2020–2033
5.6.14. Spain Electric Two Wheeler Market Outlook, by End Use, 2020–2033
5.6.15. Spain Electric Two Wheeler Market Outlook, by Price Tier, 2020–2033
5.6.16. Germany Electric Two Wheeler Market Outlook, by Vehicle Type, 2020–2033
5.6.17. Germany Electric Two Wheeler Market Outlook, by Battery Capacity and Voltage Class, 2020–2033
5.6.18. Germany Electric Two Wheeler Market Outlook, by Battery Technology and Pack Architecture, 2020–2033
5.6.19. Germany Electric Two Wheeler Market Outlook, by End Use, 2020–2033
5.6.20. Germany Electric Two Wheeler Market Outlook, by Price Tier, 2020–2033
5.6.21. Netherlands Electric Two Wheeler Market Outlook, by Vehicle Type, 2020–2033
5.6.22. Netherlands Electric Two Wheeler Market Outlook, by Battery Capacity and Voltage Class, 2020–2033
5.6.23. Netherlands Electric Two Wheeler Market Outlook, by Battery Technology and Pack Architecture, 2020–2033
5.6.24. Netherlands Electric Two Wheeler Market Outlook, by End Use, 2020–2033
5.6.25. Netherlands Electric Two Wheeler Market Outlook, by Price Tier, 2020–2033
6. Asia Pacific Electric Two Wheeler Market Outlook, 2020–2033
6.1. Asia Pacific Electric Two Wheeler Market Outlook, by Vehicle Type, Value (US$ Billion), 2020–2033
6.1.1. Electric Scooters (Seated Step-Through)
6.1.2. Electric Mopeds
6.1.3. Electric Motorcycles
6.1.4. Electric Kick-Start-Class Commuter Two-Wheelers
6.2. Asia Pacific Electric Two Wheeler Market Outlook, by Battery Capacity and Voltage Class, Value (US$ Billion), 2020–2033
6.2.1. Below 1.5 kWh (48 V)
6.2.2. 1.5–3.0 kWh (60–72 V)
6.2.3. 3.0–5.0 kWh (72–96 V)
6.2.4. Above 5.0 kWh (High Voltage)
6.3. Asia Pacific Electric Two Wheeler Market Outlook, by Battery Technology and Pack Architecture, Value (US$ Billion), 2020–2033
6.3.1. Lead-Acid Fixed Pack
6.3.2. Lithium Iron Phosphate Fixed Pack
6.3.3. Lithium Nickel Manganese Cobalt Fixed Pack
6.3.4. Swappable Lithium Pack
6.4. Asia Pacific Electric Two Wheeler Market Outlook, by End Use, Value (US$ Billion), 2020–2033
6.4.1. Personal Commuting
6.4.2. Last-Mile Delivery and Logistics Fleets
6.4.3. Ride-Hailing and Rental Fleets
6.4.4. Commercial and Institutional Fleets
6.5. Asia Pacific Electric Two Wheeler Market Outlook, by Price Tier, Value (US$ Billion), 2020–2033
6.5.1. Entry Tier (Below US$ 1,000)
6.5.2. Mid Tier (US$ 1,000–2,000)
6.5.3. Premium Tier (Above US$ 2,000)
6.6. Asia Pacific Electric Two Wheeler Market Outlook, by Country, Value (US$ Billion), 2020–2033
6.6.1. China Electric Two Wheeler Market Outlook, by Vehicle Type, 2020–2033
6.6.2. China Electric Two Wheeler Market Outlook, by Battery Capacity and Voltage Class, 2020–2033
6.6.3. China Electric Two Wheeler Market Outlook, by Battery Technology and Pack Architecture, 2020–2033
6.6.4. China Electric Two Wheeler Market Outlook, by End Use, 2020–2033
6.6.5. China Electric Two Wheeler Market Outlook, by Price Tier, 2020–2033
6.6.6. India Electric Two Wheeler Market Outlook, by Vehicle Type, 2020–2033
6.6.7. India Electric Two Wheeler Market Outlook, by Battery Capacity and Voltage Class, 2020–2033
6.6.8. India Electric Two Wheeler Market Outlook, by Battery Technology and Pack Architecture, 2020–2033
6.6.9. India Electric Two Wheeler Market Outlook, by End Use, 2020–2033
6.6.10. India Electric Two Wheeler Market Outlook, by Price Tier, 2020–2033
7. Latin America Electric Two Wheeler Market Outlook, 2020–2033
7.1. Latin America Electric Two Wheeler Market Outlook, by Vehicle Type, Value (US$ Billion), 2020–2033
7.1.1. Electric Scooters (Seated Step-Through)
7.1.2. Electric Mopeds
7.1.3. Electric Motorcycles
7.1.4. Electric Kick-Start-Class Commuter Two-Wheelers
7.2. Latin America Electric Two Wheeler Market Outlook, by Battery Capacity and Voltage Class, Value (US$ Billion), 2020–2033
7.2.1. Below 1.5 kWh (48 V)
7.2.2. 1.5–3.0 kWh (60–72 V)
7.2.3. 3.0–5.0 kWh (72–96 V)
7.2.4. Above 5.0 kWh (High Voltage)
7.3. Latin America Electric Two Wheeler Market Outlook, by Battery Technology and Pack Architecture, Value (US$ Billion), 2020–2033
7.3.1. Lead-Acid Fixed Pack
7.3.2. Lithium Iron Phosphate Fixed Pack
7.3.3. Lithium Nickel Manganese Cobalt Fixed Pack
7.3.4. Swappable Lithium Pack
7.4. Latin America Electric Two Wheeler Market Outlook, by End Use, Value (US$ Billion), 2020–2033
7.4.1. Personal Commuting
7.4.2. Last-Mile Delivery and Logistics Fleets
7.4.3. Ride-Hailing and Rental Fleets
7.4.4. Commercial and Institutional Fleets
7.5. Latin America Electric Two Wheeler Market Outlook, by Price Tier, Value (US$ Billion), 2020–2033
7.5.1. Entry Tier (Below US$ 1,000)
7.5.2. Mid Tier (US$ 1,000–2,000)
7.5.3. Premium Tier (Above US$ 2,000)
7.6. Latin America Electric Two Wheeler Market Outlook, by Country, Value (US$ Billion), 2020–2033
7.6.1. Brazil Electric Two Wheeler Market Outlook, by Vehicle Type, 2020–2033
7.6.2. Brazil Electric Two Wheeler Market Outlook, by Battery Capacity and Voltage Class, 2020–2033
7.6.3. Brazil Electric Two Wheeler Market Outlook, by Battery Technology and Pack Architecture, 2020–2033
7.6.4. Brazil Electric Two Wheeler Market Outlook, by End Use, 2020–2033
7.6.5. Brazil Electric Two Wheeler Market Outlook, by Price Tier, 2020–2033
7.6.6. Colombia Electric Two Wheeler Market Outlook, by Vehicle Type, 2020–2033
7.6.7. Colombia Electric Two Wheeler Market Outlook, by Battery Capacity and Voltage Class, 2020–2033
7.6.8. Colombia Electric Two Wheeler Market Outlook, by Battery Technology and Pack Architecture, 2020–2033
7.6.9. Colombia Electric Two Wheeler Market Outlook, by End Use, 2020–2033
7.6.10. Colombia Electric Two Wheeler Market Outlook, by Price Tier, 2020–2033
7.6.11. Mexico Electric Two Wheeler Market Outlook, by Vehicle Type, 2020–2033
7.6.12. Mexico Electric Two Wheeler Market Outlook, by Battery Capacity and Voltage Class, 2020–2033
7.6.13. Mexico Electric Two Wheeler Market Outlook, by Battery Technology and Pack Architecture, 2020–2033
7.6.14. Mexico Electric Two Wheeler Market Outlook, by End Use, 2020–2033
7.6.15. Mexico Electric Two Wheeler Market Outlook, by Price Tier, 2020–2033
7.6.16. Peru Electric Two Wheeler Market Outlook, by Vehicle Type, 2020–2033
7.6.17. Peru Electric Two Wheeler Market Outlook, by Battery Capacity and Voltage Class, 2020–2033
7.6.18. Peru Electric Two Wheeler Market Outlook, by Battery Technology and Pack Architecture, 2020–2033
7.6.19. Peru Electric Two Wheeler Market Outlook, by End Use, 2020–2033
7.6.20. Peru Electric Two Wheeler Market Outlook, by Price Tier, 2020–2033
8. Middle East & Africa Electric Two Wheeler Market Outlook, 2020–2033
8.1. Middle East & Africa Electric Two Wheeler Market Outlook, by Vehicle Type, Value (US$ Billion), 2020–2033
8.1.1. Electric Scooters (Seated Step-Through)
8.1.2. Electric Mopeds
8.1.3. Electric Motorcycles
8.1.4. Electric Kick-Start-Class Commuter Two-Wheelers
8.2. Middle East & Africa Electric Two Wheeler Market Outlook, by Battery Capacity and Voltage Class, Value (US$ Billion), 2020–2033
8.2.1. Below 1.5 kWh (48 V)
8.2.2. 1.5–3.0 kWh (60–72 V)
8.2.3. 3.0–5.0 kWh (72–96 V)
8.2.4. Above 5.0 kWh (High Voltage)
8.3. Middle East & Africa Electric Two Wheeler Market Outlook, by Battery Technology and Pack Architecture, Value (US$ Billion), 2020–2033
8.3.1. Lead-Acid Fixed Pack
8.3.2. Lithium Iron Phosphate Fixed Pack
8.3.3. Lithium Nickel Manganese Cobalt Fixed Pack
8.3.4. Swappable Lithium Pack
8.4. Middle East & Africa Electric Two Wheeler Market Outlook, by End Use, Value (US$ Billion), 2020–2033
8.4.1. Personal Commuting
8.4.2. Last-Mile Delivery and Logistics Fleets
8.4.3. Ride-Hailing and Rental Fleets
8.4.4. Commercial and Institutional Fleets
8.5. Middle East & Africa Electric Two Wheeler Market Outlook, by Price Tier, Value (US$ Billion), 2020–2033
8.5.1. Entry Tier (Below US$ 1,000)
8.5.2. Mid Tier (US$ 1,000–2,000)
8.5.3. Premium Tier (Above US$ 2,000)
8.6. Middle East & Africa Electric Two Wheeler Market Outlook, by Country, Value (US$ Billion), 2020–2033
8.6.1. Egypt Electric Two Wheeler Market Outlook, by Vehicle Type, 2020–2033
8.6.2. Egypt Electric Two Wheeler Market Outlook, by Battery Capacity and Voltage Class, 2020–2033
8.6.3. Egypt Electric Two Wheeler Market Outlook, by Battery Technology and Pack Architecture, 2020–2033
8.6.4. Egypt Electric Two Wheeler Market Outlook, by End Use, 2020–2033
8.6.5. Egypt Electric Two Wheeler Market Outlook, by Price Tier, 2020–2033
8.6.6. Morocco Electric Two Wheeler Market Outlook, by Vehicle Type, 2020–2033
8.6.7. Morocco Electric Two Wheeler Market Outlook, by Battery Capacity and Voltage Class, 2020–2033
8.6.8. Morocco Electric Two Wheeler Market Outlook, by Battery Technology and Pack Architecture, 2020–2033
8.6.9. Morocco Electric Two Wheeler Market Outlook, by End Use, 2020–2033
8.6.10. Morocco Electric Two Wheeler Market Outlook, by Price Tier, 2020–2033
8.6.11. Nigeria Electric Two Wheeler Market Outlook, by Vehicle Type, 2020–2033
8.6.12. Nigeria Electric Two Wheeler Market Outlook, by Battery Capacity and Voltage Class, 2020–2033
8.6.13. Nigeria Electric Two Wheeler Market Outlook, by Battery Technology and Pack Architecture, 2020–2033
8.6.14. Nigeria Electric Two Wheeler Market Outlook, by End Use, 2020–2033
8.6.15. Nigeria Electric Two Wheeler Market Outlook, by Price Tier, 2020–2033
8.6.16. Kenya Electric Two Wheeler Market Outlook, by Vehicle Type, 2020–2033
8.6.17. Kenya Electric Two Wheeler Market Outlook, by Battery Capacity and Voltage Class, 2020–2033
8.6.18. Kenya Electric Two Wheeler Market Outlook, by Battery Technology and Pack Architecture, 2020–2033
8.6.19. Kenya Electric Two Wheeler Market Outlook, by End Use, 2020–2033
8.6.20. Kenya Electric Two Wheeler Market Outlook, by Price Tier, 2020–2033
8.6.21. Rwanda Electric Two Wheeler Market Outlook, by Vehicle Type, 2020–2033
8.6.22. Rwanda Electric Two Wheeler Market Outlook, by Battery Capacity and Voltage Class, 2020–2033
8.6.23. Rwanda Electric Two Wheeler Market Outlook, by Battery Technology and Pack Architecture, 2020–2033
8.6.24. Rwanda Electric Two Wheeler Market Outlook, by End Use, 2020–2033
8.6.25. Rwanda Electric Two Wheeler Market Outlook, by Price Tier, 2020–2033
8.6.26. United Arab Emirates Electric Two Wheeler Market Outlook, by Vehicle Type, 2020–2033
8.6.27. United Arab Emirates Electric Two Wheeler Market Outlook, by Battery Capacity and Voltage Class, 2020–2033
8.6.28. United Arab Emirates Electric Two Wheeler Market Outlook, by Battery Technology and Pack Architecture, 2020–2033
8.6.29. United Arab Emirates Electric Two Wheeler Market Outlook, by End Use, 2020–2033
8.6.30. United Arab Emirates Electric Two Wheeler Market Outlook, by Price Tier, 2020–2033
9. Competitive Landscape
9.1. Market Concentration and Industry Leaders
9.2. Competitive Differentiation
9.3. Strategic Moves and Market Direction
9.4. Recent Industry Developments
9.5. Company Profiles
9.5.1. Yadea Group Holdings Ltd.
9.5.2. Aima Technology Group Co., Ltd.
9.5.3. Niu Technologies
9.5.4. Luyuan Group Holding (Cayman) Limited
9.5.5. Ola Electric Mobility Limited
9.5.6. TVS Motor Company Limited
9.5.7. Bajaj Auto Limited
9.5.8. Hero MotoCorp Limited
9.5.9. Ather Energy Limited
9.5.10. Honda Motor Co., Ltd.
9.5.11. Yamaha Motor Co., Ltd.
9.5.12. Piaggio & C. SpA
9.5.13. Gogoro Inc.
9.5.14. Zero Motorcycles, Inc.
10. Appendix
10.1. Research Methodology
10.2. Report Assumptions
10.3. Acronyms and Abbreviations
| Vehicle Type | Electric Scooters (Seated Step-Through), Electric Mopeds, Electric Motorcycles, Electric Kick-Start-Class Commuter Two-Wheelers |
| Battery Capacity and Voltage Class | Below 1.5 kWh (48 V), 1.5–3.0 kWh (60–72 V), 3.0–5.0 kWh (72–96 V), Above 5.0 kWh (High Voltage) |
| Battery Technology and Pack Architecture | Lead-Acid Fixed Pack, Lithium Iron Phosphate Fixed Pack, Lithium Nickel Manganese Cobalt Fixed Pack, Swappable Lithium Pack |
| End Use | Personal Commuting, Last-Mile Delivery and Logistics Fleets, Ride-Hailing and Rental Fleets, Commercial and Institutional Fleets |
| Price Tier | Entry Tier (Below US$ 1,000), Mid Tier (US$ 1,000–2,000), Premium Tier (Above US$ 2,000) |
| Regions | North America, Europe, Asia Pacific, Latin America, Middle East & Africa |
Our Research Methodology
Considering the volatility of business today, traditional approaches to strategizing a game plan can be unfruitful if not detrimental. True ambiguity is no way to determine a forecast. A myriad of predetermined factors must be accounted for such as the degree of risk involved, the magnitude of circumstances, as well as conditions or consequences that are not known or unpredictable. To circumvent binary views that cast uncertainty, the application of market research intelligence to strategically posture, move, and enable actionable outcomes is necessary.
View Methodology
Quality Assured
Rigorous Validation Process

Confidentiality Assured
End-to-end Data Security

Custom Research Services
Tailored To Your Objectives
FAQs
The global electric two wheeler market is valued at US$ 52.0 billion in 2026, covering battery-electric seated road two-wheelers across all five standard regions.
The market is projected to reach US$ 98.4 billion by 2033, growing at a 9.5% CAGR and adding an absolute opportunity of US$ 46.4 billion.
Seated step-through electric scooters lead with 51.8% share in 2026, because the format matches the petrol scooter most urban Asian households already own.
Swappable lithium packs grow fastest at 15.8%, and Latin America is the fastest region at a 14.8% CAGR through 2033.
Asia Pacific holds 84.5% share in 2026, because China and India account for almost all global volume and most manufacturing capacity.
Related Reports
Smart Oil Dipstick Market Size, Share, Insights, Competitive Landscape, and Forecast 2026 to 2033
Smart Oil Dipstick Market is projected to rise from US$ 4.03 billion in 2026 to US$ 13.02 billion by 2033 at an 18.2% CAGR. Explore key uses and trends.
Rail Glazing Market Size, Share, Insights, Competitive Landscape, and Forecast 2026 to 2033
Rail Glazing Market is projected to grow from US$ 2.37 billion in 2026 to US$ 3.56 billion by 2033 at a 6.0% CAGR. Explore materials and applications.
Passenger Vehicle ADAS Market Size, Share, Insights, Competitive Landscape, and Forecast 2026 to 2033
Passenger Vehicle ADAS Market is set to grow from US$ 36.7 billion in 2026 to US$ 115.5 billion by 2033 at a 17.8% CAGR. Explore sensors and trends.
Container Fleet Market Size, Share, Insights, Competitive Landscape, and Forecast 2026 to 2033
Explore the container fleet market, projected to reach US$ 26.8 billion by 2033 at a 5.4% CAGR, with container types, ownership and regional insights.
Micro-mobility Charging Infrastructure Market Size, Share, Insights, Competitive Landscape, and Forecast 2026 to 2033
The global micro-mobility charging infrastructure market is valued at US$9.06 billion in 2026, reaching US$34.02 billion by 2033, growing at a 20.8% CAGR
eCTOL Aircraft Market Size, Share, Insights, Competitive Landscape, and Forecast 2026 to 2033
Explore the eCTOL aircraft market, projected to reach US$ 11.14 billion by 2033 at a 10.6% CAGR, with propulsion, application and regional insights.