



Fuel Cell Market
Fuel Cell Market Size, Share, Insights, Competitive Landscape, and Forecast 2026 to 2033
Fuel Cell Market Size and Trend Analysis
How Big Will the Fuel Cell Market Be by 2033?
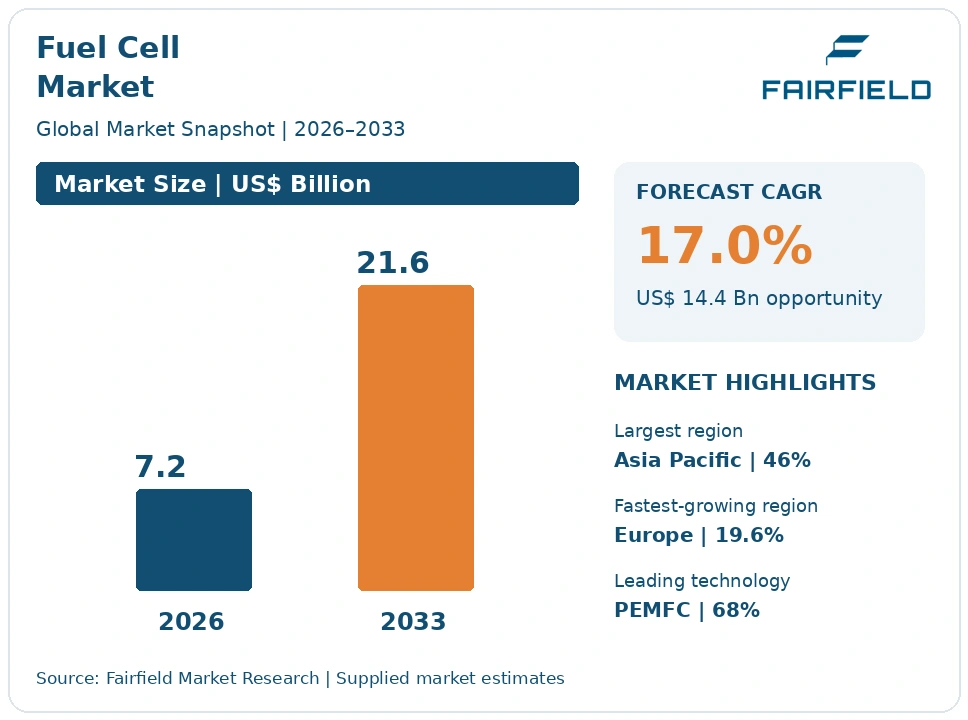
The global Fuel Cell market size is expected to be valued at US$ 7.2 billion in 2026 and projected to reach US$ 21.6 billion by 2033, growing at a CAGR of 17.0% between 2026 and 2033.
The sector grew at roughly 15% a year between 2020 and 2025, but that growth was uneven and included several retrenchments as light passenger vehicle programmes were scaled back. Three factors carry the forecast. Stationary power and combined heat and power deployment continues in Japan, South Korea and increasingly for data centre supply. Material handling fleets keep reordering because the duty cycle genuinely suits fuel cells. Policy support in the European Union and the United States underwrites heavy-duty transport pilots. Direction of travel is narrower but firmer: fewer applications, better unit economics, and growth constrained less by stack technology than by delivered hydrogen cost.
Key Report Takeaways
- By Technology: PEMFC held 68% share in 2026, while SOFC is projected to expand at a 20.4% CAGR through 2033, driven by high electrical efficiency in prime power and data centre installations.
- By Application: Stationary power held 49% share in 2026, while transport is projected to grow at a 19.3% CAGR through 2033, led by buses, material handling and heavy-duty trucks in specific geographies.
- By Power Output: Systems up to 10 kW held 34% share in 2026, while the 100 kW to 1 MW band is projected to post a 19.8% CAGR through 2033, reflecting bus and truck powertrain sizing.
- By Fuel Type: Hydrogen held 69% share in 2026, while methanol is projected to advance at a 21.2% CAGR through 2033, supported by marine auxiliary power and off-grid telecom applications.
- By Geography: Asia Pacific held 46% share in 2026, while Europe is projected to grow at a 19.6% CAGR through 2033, underpinned by binding refuelling infrastructure deployment rules.
Global Fuel Cell Market Trends and Insights
Drivers Impact Analysis
Two forces explain most of the forecast growth in fuel cell stack and system revenue.
| Driver | Impact on CAGR Forecast | Geographic Relevance | Impact Timeline |
| Regulatory mandates for hydrogen refuelling and renewable fuel use | High | Europe, Asia Pacific | Medium term (2–4 years) |
| Duty-cycle economics in material handling and continuous stationary power | High | North America, Asia Pacific, Europe | Long term (≥4 years) |
Hydrogen Refuelling Mandates Underwrite Heavy-Duty Fuel Cell Deployment
Binding infrastructure rules are now the most important external support for fuel cell transport, because the historic barrier was never the stack but the absence of refuelling. Mandated station coverage changes the risk calculation for fleet operators, who can only commit to hydrogen vehicles if they can refuel them reliably along fixed routes. This converts policy into order flow for bus and truck powertrain suppliers.
The mechanism is specific and dated. The Alternative Fuels Infrastructure Regulation, Regulation (EU) 2023/1804, requires hydrogen refuelling stations at defined intervals along core network corridors and in urban nodes by 2030. The recast Renewable Energy Directive adds renewable hydrogen targets for industry and transport, creating demand for hydrogen that needs end uses. Together these build the corridor coverage that makes regional haulage and depot-based bus fleets operationally feasible.
Duty-Cycle Economics Keep Material Handling and Stationary Power Reordering
The commercially durable part of this market is where fuel cells win on operations rather than on emissions accounting. Warehouse forklifts refuel in a few minutes and avoid battery swapping, charging rooms and the voltage sag that slows battery trucks late in a shift. Multi-shift distribution centres therefore reorder fuel cell units as fleets expand, which produces repeat revenue rather than one-off demonstration sales.
Stationary power follows similar logic. Continuous-running prime power and combined heat and power systems spread fixed stack cost across very high annual operating hours, which is the only reliable route to acceptable cost per kilowatt-hour. SOFC and PAFC units supply electricity and usable heat to hospitals, campuses and industrial sites, and newer installations target data centre supply where grid connection queues delay projects. Japan’s long-running residential combined heat and power programme demonstrates the same durability at small scale.
Restraints Impact Analysis
Two cost and engineering constraints limit how fast fuel cell adoption can broaden.
| Restraint | Impact on CAGR Forecast | Geographic Relevance | Impact Timeline |
| Delivered hydrogen cost and limited refuelling availability | High | Global | Long term (≥4 years) |
| Platinum group metal loading and stack durability over service life | Medium | Global | Medium term (2–4 years) |
Delivered Hydrogen Cost Caps Fuel Cell Adoption in Road Transport
Hydrogen cost at the nozzle, not stack performance, is the binding constraint on this market. Fleet operators compare cost per kilometre, and at prevailing retail hydrogen prices in most markets, battery electric trucks and buses are cheaper to run than fuel cell equivalents. This is the single clearest reason light passenger vehicles have lost the argument to batteries, and why adoption now concentrates where batteries struggle.
The cost stack is well understood. Renewable hydrogen production remains expensive per kilogram; compression to 700 bar or liquefaction consumes a significant share of the energy content; road delivery in tube trailers carries little mass per trip; and stations with low utilisation must recover capital over few kilograms dispensed. Fuel purity adds further cost, since ISO 14687 quality limits must be met because carbon monoxide and sulphur traces poison platinum catalysts.
Platinum Loading and Stack Degradation Raise Lifetime Fuel Cell Costs
Catalyst cost and finite stack life limit how far PEMFC prices can fall and how attractive total cost of ownership becomes. Platinum group metals are required on both electrodes, and because supply is concentrated and prices move with mining and investment demand, suppliers cannot engineer away exposure as easily as battery makers substituted cathode chemistries. Replacement stacks are a real mid-life cost that fleet buyers now model explicitly.
Durability is the second cost source. Membranes thin and develop pinholes, catalyst particles agglomerate and lose active surface area, carbon supports corrode during start-stop and high-potential excursions, and bipolar plates suffer contact resistance growth. Automotive duty cycles with frequent load swings degrade stacks faster than steady stationary operation, which is why heavy-duty targets are expressed in tens of thousands of operating hours. Meeting those targets requires conservative operating strategies that reduce peak efficiency.
Market Opportunities
Data Centre Prime Power Creates a High-Value Stationary Fuel Cell Pool
Data centre electricity supply is the most commercially attractive new revenue pool for stationary fuel cells, because buyers value speed of connection above cost per kilowatt-hour. Grid interconnection queues now stretch for years in several major markets, and operators face a direct trade-off between waiting and generating on site. Fuel cell systems can be installed in modular blocks and commissioned relatively quickly.
Capture favours established SOFC and MCFC system suppliers with proven multi-megawatt installations and service organisations, rather than stack newcomers. Demand comes from hyperscale and colocation operators in the United States, South Korea, Japan and Ireland, where power availability constrains expansion. Natural gas operation today with a stated pathway to hydrogen blending matches how these customers manage procurement risk. Combined heat and power configurations add value where waste heat serves adjacent district heating or absorption cooling loads.
Marine and Rail Auxiliary Power Opens a Regulated Niche Revenue Pool
Marine and rail auxiliary power is a narrower but genuinely accessible pool, created by emissions rules in ports and by the difficulty of electrifying lightly used rail lines. Vessels at berth face restrictions on running diesel auxiliary engines, and shore power is not available everywhere. Fuel cell auxiliary units supply hotel load cleanly, and the duty cycle is steady, which suits stack durability.
Capture belongs to system integrators with marine classification approvals and to rail vehicle builders fitting fuel cell power packs to regional trainsets. Demand comes from ferry and inland waterway operators in Norway, the Netherlands and Germany, from port authorities enforcing at-berth rules, and from regional rail operators replacing diesel multiple units on non-electrified routes. Methanol-fuelled systems are attractive here, because liquid fuel handling and bunkering are far simpler onboard than compressed hydrogen storage.
Segment Analysis
By Technology: PEMFC Dominates Volume While SOFC Gains Efficiency Share
PEMFC held 68% of the fuel cell market in 2026, because it suits almost every transport application and the small stationary units deployed in residential combined heat and power. Low operating temperature allows fast start-up and dynamic load following, and the manufacturing base is the largest and most mature. PAFC and MCFC retain established positions in megawatt-scale stationary plants, while alkaline and direct methanol systems serve niche roles.
SOFC is the fastest-growing technology at a 20.4% CAGR to 2033, driven by its higher electrical efficiency and fuel flexibility. Operating at high temperature allows internal reforming of natural gas and biogas, which removes dependence on delivered hydrogen and makes prime power economics work today. Thermal cycling and start-up time remain limitations, so deployment favours continuous operation. The implication is a split market: PEMFC for mobility, SOFC for always-on power.
By Application: Stationary Power Leads While Transport Expands Faster
Stationary power accounted for 49% of fuel cell revenue in 2026, the largest application and the most commercially settled. High annual operating hours justify capital cost, and installations serve prime power, combined heat and power and backup duty at hospitals, campuses, telecom sites and industrial plants. South Korea and Japan supply much of this base through utility-scale plants and residential systems respectively.
Transport is the fastest-growing application at a 19.3% CAGR through 2033, though its composition has changed sharply. Light passenger vehicles have lost ground to batteries, and growth now comes from material handling fleets, city and intercity buses, heavy trucks on fixed corridors, regional trains and marine auxiliary units. Portable power remains small, serving military, telecom and recreational uses. For suppliers, the implication is that transport growth must be pursued selectively, application by application.
By Power Output: Small Systems Lead While Mid-Range Units Grow Fastest
Systems rated up to 10 kW held 34% share in 2026, the largest output band by revenue. This reflects the very large installed count of residential combined heat and power units, telecom backup systems and portable products. Unit prices are low, but volumes are high and the installed base generates service and replacement revenue over long periods.
The 100 kW to 1 MW band grows fastest at a 19.8% CAGR to 2033, because it matches the power requirement of transit buses, heavy trucks, regional trainsets and marine auxiliary systems. Powertrains in this range are increasingly built from modular stacks, allowing one engineering platform to serve several vehicle types. The 10 kW to 100 kW band supports light commercial vehicles and smaller stationary units, while multi-megawatt systems concentrate in utility and data centre projects.
By Fuel Type: Hydrogen Leads While Methanol Grows Fastest
Hydrogen accounted for 69% of fuel supplied to fuel cell systems in 2026, because PEMFC stacks require high-purity hydrogen and dominate shipped capacity. Purity requirements under ISO 14687 are strict, since carbon monoxide, sulphur and ammonia traces poison catalysts and cause irreversible performance loss. Natural gas follows, reformed internally or externally for SOFC, MCFC and PAFC stationary plants.
Methanol is the fastest-growing fuel at a 21.2% CAGR to 2033, from a modest base. Its advantage is handling: a liquid at ambient conditions, it avoids high-pressure storage and complex bunkering, which matters on vessels and at remote sites. Direct methanol and reformed methanol systems serve marine auxiliary power, off-grid telecom and military applications. The implication is that fuel choice increasingly follows logistics practicality rather than stack preference.
Geography Analysis
North America Builds on Material Handling Fleets and Policy Credits
North America held 26% of the fuel cell market in 2026, with the United States accounting for most of it and Canada contributing a significant stack engineering and manufacturing base. Warehouse material handling is the region’s commercial anchor, supported by large distribution networks operating multiple shifts.
Policy shapes the outlook. The Inflation Reduction Act provides a clean hydrogen production credit under Section 45V and an investment tax credit for fuel cell property, improving project economics for both fuel supply and installed systems. Regional hydrogen hub programmes aim to cluster production with industrial offtake.
The main change is stationary prime power for data centres, where grid interconnection delays make on-site generation attractive. Hydrogen refuelling availability outside California remains the principal barrier to road transport adoption.
Which Region Is Growing Fastest in the Fuel Cell Market?
Europe is growing fastest in the fuel cell market at a 19.6% CAGR between 2026 and 2033, from a 21% share in 2026. The reason is regulation that creates both hydrogen supply and the infrastructure to use it, rather than subsidy for vehicles alone.
Germany, the Netherlands, France, Norway and Denmark lead deployment. The Alternative Fuels Infrastructure Regulation sets dated refuelling coverage requirements, the recast Renewable Energy Directive mandates renewable hydrogen use in industry and transport, and the hydrogen and decarbonised gas market package establishes network and market rules for hydrogen transport.
Deployment concentrates in city buses, regional trains replacing diesel units, inland vessels and industrial combined heat and power. The barrier remains delivered hydrogen cost, which is high relative to electricity for comparable battery applications.
Which Region Is Leading the Fuel Cell Market?
Asia Pacific leads the fuel cell market with 46% share in 2026, because it contains the largest installed base of both stationary systems and road vehicles, supported by two decades of sustained industrial policy. Japan, South Korea and China account for the overwhelming majority of regional revenue.
The causes are specific. South Korea has built utility-scale stationary fuel cell plants under a renewable portfolio framework, creating the world’s largest concentration of megawatt-class installations. Japan’s national hydrogen strategy and its long-standing residential combined heat and power programme have placed hundreds of thousands of small units in homes. China has concentrated support on commercial vehicle fleets in designated city clusters.
The opportunity is component localisation, as regional suppliers develop membranes, bipolar plates and catalyst-coated membranes to reduce system cost.
Latin America Remains an Early-Stage Fuel Cell Market
Latin America represented 3% of the fuel cell market in 2026, the smallest regional share. Activity is concentrated in Chile, Brazil and Colombia, mostly around green hydrogen production projects aimed at export rather than around domestic fuel cell deployment.
Barriers are substantial. There is no hydrogen distribution infrastructure for transport, electricity in several markets is already low-carbon and inexpensive, which weakens the decarbonisation case for stationary systems, and capital costs are high relative to project returns. Technical service networks for stack maintenance are largely absent.
The change worth watching is mining. Heavy haul trucks at high-altitude copper and lithium operations in Chile and Peru face duty cycles that challenge batteries, which makes them a credible early application.
Middle East & Africa Links Hydrogen Export Ambitions to Early Deployment
Middle East & Africa held 4% of the market in 2026. Saudi Arabia, the United Arab Emirates, Oman, Egypt and South Africa are the active markets, and policy attention is directed primarily at hydrogen and ammonia production for export.
The barriers are domestic rather than technical. Abundant low-cost natural gas and solar electricity weaken the economic case for fuel cells against conventional generation, local service capability is limited, and most announced projects target shipment abroad rather than internal use. Water availability constrains electrolysis siting in several locations.
The opportunity lies in South Africa, where platinum group metal resources give a direct industrial interest in fuel cell growth, and in off-grid telecom and mining backup power across the region.
Competitive Landscape
The fuel cell industry is moderately concentrated and splits cleanly by technology and application rather than forming one competitive pool. Ballard Power Systems Inc. and PowerCell Sweden AB are visible in mobility stacks, Plug Power Inc. in material handling systems, Bloom Energy Corporation and Doosan Fuel Cell Co., Ltd. in stationary power, and Panasonic Holdings Corporation in residential combined heat and power. Automotive groups including Toyota Motor Corporation, Hyundai Motor Company and Honda Motor Co., Ltd. retain substantial in-house stack capability. Consolidation has been limited, though several participants have narrowed their product range after earlier over-expansion.
Competition now turns on demonstrated durability, total cost of ownership and service capability rather than on peak efficiency claims. Buyers scrutinise guaranteed operating hours, degradation rates, platinum loading per kilowatt and the cost of mid-life stack replacement. In stationary power, availability guarantees and maintenance network depth often decide awards. New entrants are concentrated in SOFC systems, in modular stack platforms sold to vehicle integrators, and in methanol-fuelled systems for marine and off-grid use, where incumbents are weaker.
Strategic activity is directed at reducing precious metal loading, raising manufacturing automation to cut stack assembly cost, qualifying second-generation membranes and coated bipolar plates, and building service organisations that can support fleets rather than individual demonstration units. Several participants have also repositioned away from light passenger vehicles toward commercial and stationary applications.
Strategic direction is convergent: narrow the application focus, prove durability in the field, localise component supply to reduce cost and tariff exposure, and tie commercial plans to hydrogen availability rather than to stack capability alone.
Fuel Cell Industry Leaders
- Ballard Power Systems Inc.
- Bloom Energy Corporation
- Plug Power Inc.
- Doosan Fuel Cell Co., Ltd.
- Panasonic Holdings Corporation
Recent Industry Developments
April 2024: The Alternative Fuels Infrastructure Regulation, Regulation (EU) 2023/1804, became applicable across the European Union, setting dated hydrogen refuelling deployment requirements for core network corridors and urban nodes – removing the refuelling uncertainty that had stalled heavy-duty fleet commitments.
May 2024: Japan enacted its hydrogen society promotion legislation, introducing long-term price support for low-carbon hydrogen supply – reinforcing the country’s position as the most consistent policy environment for stationary and mobility fuel cells.
August 2024: The European Union hydrogen and decarbonised gas market package entered into force, establishing network access and market rules for hydrogen transport – creating the regulatory basis for a delivered hydrogen market that fuel cell operators depend on.
January 2025: The United States Department of the Treasury and the Internal Revenue Service issued final regulations for the clean hydrogen production credit under Section 45V – resolving the eligibility rules that had delayed final investment decisions on hydrogen supply for fuel cell offtakers.
Fuel Cell Market Report Scope
| Metric | Value |
| Study Period (2020–2033) | Historical 2020–2025, base year 2025, forecast 2026–2033 |
| Market Size 2026 | US$ 7.2 Billion |
| Market Size 2033 | US$ 21.6 Billion |
| CAGR 2026–2033 | 17.0% |
| Absolute Dollar Opportunity | US$ 14.4 Billion |
| Largest Market | Asia Pacific (46% share in 2026) |
| Fastest-Growing Market | Europe (19.6% CAGR) |
| Market Concentration | Medium |
| Major Players | Ballard Power Systems Inc., Bloom Energy Corporation, Plug Power Inc., Doosan Fuel Cell Co., Ltd., Panasonic Holdings Corporation |
This study covers fuel cell stacks and complete systems across PEMFC, SOFC, PAFC, MCFC, alkaline and direct methanol technologies, sold into transport, stationary power including combined heat and power, and portable power. It counts the stack and system only. Hydrogen production, electrolysers, storage and refuelling infrastructure are excluded. Base year 2025, forecast period 2026 to 2033, reported in US$ Billion.
Fuel Cell Market Segmentation
Technology
- PEMFC
- SOFC
- PAFC
- MCFC
- AFC
- Direct Methanol
Application
- Transport
- Stationary Power
- Portable Power
Power Output
- Up to 10 kW
- 10 kW to 100 kW
- 100 kW to 1 MW
- Above 1 MW
Fuel Type
- Hydrogen
- Natural Gas
- Methanol
- Other Fuels
Regions
- North America
- Europe
- Asia Pacific
- Latin America
- Middle East & Africa
- Executive Summary
- Global Fuel Cell Market Snapshot
- Future Projections
- Key Report Takeaways
- Regional Snapshot
- Market Overview
- Market Definition and Report Scope
- Historical Trends 2020–2025
- Market Dynamics
- Drivers
- Hydrogen Refuelling Mandates Underwrite Heavy-Duty Fuel Cell Deployment
- Duty-Cycle Economics Keep Material Handling and Stationary Power Reordering
- Restraints
- Delivered Hydrogen Cost Caps Fuel Cell Adoption in Road Transport
- Platinum Loading and Stack Degradation Raise Lifetime Fuel Cell Costs
- Market Opportunities
- Data Centre Prime Power Creates a High-Value Stationary Fuel Cell Pool
- Marine and Rail Auxiliary Power Opens a Regulated Niche Revenue Pool
- Drivers
- Global Fuel Cell Market Outlook, 2020–2033
- Global Fuel Cell Market Outlook, by Technology, Value (US$ Billion), 2020–2033
- PEMFC
- SOFC
- PAFC
- MCFC
- AFC
- Direct Methanol
- Global Fuel Cell Market Outlook, by Application, Value (US$ Billion), 2020–2033
- Transport
- Stationary Power
- Portable Power
- Global Fuel Cell Market Outlook, by Power Output, Value (US$ Billion), 2020–2033
- Up to 10 kW
- 10 kW to 100 kW
- 100 kW to 1 MW
- Above 1 MW
- Global Fuel Cell Market Outlook, by Fuel Type, Value (US$ Billion), 2020–2033
- Hydrogen
- Natural Gas
- Methanol
- Other Fuels
- Global Fuel Cell Market Outlook, by Region, Value (US$ Billion), 2020–2033
- North America
- Europe
- Asia Pacific
- Latin America
- Middle East & Africa
- Global Fuel Cell Market Outlook, by Technology, Value (US$ Billion), 2020–2033
- North America Fuel Cell Market Outlook, 2020–2033
- North America Fuel Cell Market Outlook, by Technology, Value (US$ Billion), 2020–2033
- PEMFC
- SOFC
- PAFC
- MCFC
- AFC
- Direct Methanol
- North America Fuel Cell Market Outlook, by Application, Value (US$ Billion), 2020–2033
- Transport
- Stationary Power
- Portable Power
- North America Fuel Cell Market Outlook, by Power Output, Value (US$ Billion), 2020–2033
- Up to 10 kW
- 10 kW to 100 kW
- 100 kW to 1 MW
- Above 1 MW
- North America Fuel Cell Market Outlook, by Fuel Type, Value (US$ Billion), 2020–2033
- Hydrogen
- Natural Gas
- Methanol
- Other Fuels
- North America Fuel Cell Market Outlook, by Country, Value (US$ Billion), 2020–2033
- United States Fuel Cell Market Outlook, by Technology, 2020–2033
- United States Fuel Cell Market Outlook, by Application, 2020–2033
- United States Fuel Cell Market Outlook, by Power Output, 2020–2033
- United States Fuel Cell Market Outlook, by Fuel Type, 2020–2033
- Canada Fuel Cell Market Outlook, by Technology, 2020–2033
- Canada Fuel Cell Market Outlook, by Application, 2020–2033
- Canada Fuel Cell Market Outlook, by Power Output, 2020–2033
- Canada Fuel Cell Market Outlook, by Fuel Type, 2020–2033
- North America Fuel Cell Market Outlook, by Technology, Value (US$ Billion), 2020–2033
- Europe Fuel Cell Market Outlook, 2020–2033
- Europe Fuel Cell Market Outlook, by Technology, Value (US$ Billion), 2020–2033
- PEMFC
- SOFC
- PAFC
- MCFC
- AFC
- Direct Methanol
- Europe Fuel Cell Market Outlook, by Application, Value (US$ Billion), 2020–2033
- Transport
- Stationary Power
- Portable Power
- Europe Fuel Cell Market Outlook, by Power Output, Value (US$ Billion), 2020–2033
- Up to 10 kW
- 10 kW to 100 kW
- 100 kW to 1 MW
- Above 1 MW
- Europe Fuel Cell Market Outlook, by Fuel Type, Value (US$ Billion), 2020–2033
- Hydrogen
- Natural Gas
- Methanol
- Other Fuels
- Europe Fuel Cell Market Outlook, by Country, Value (US$ Billion), 2020–2033
- Germany Fuel Cell Market Outlook, by Technology, 2020–2033
- Germany Fuel Cell Market Outlook, by Application, 2020–2033
- Germany Fuel Cell Market Outlook, by Power Output, 2020–2033
- Germany Fuel Cell Market Outlook, by Fuel Type, 2020–2033
- Netherlands Fuel Cell Market Outlook, by Technology, 2020–2033
- Netherlands Fuel Cell Market Outlook, by Application, 2020–2033
- Netherlands Fuel Cell Market Outlook, by Power Output, 2020–2033
- Netherlands Fuel Cell Market Outlook, by Fuel Type, 2020–2033
- France Fuel Cell Market Outlook, by Technology, 2020–2033
- France Fuel Cell Market Outlook, by Application, 2020–2033
- France Fuel Cell Market Outlook, by Power Output, 2020–2033
- France Fuel Cell Market Outlook, by Fuel Type, 2020–2033
- Norway Fuel Cell Market Outlook, by Technology, 2020–2033
- Norway Fuel Cell Market Outlook, by Application, 2020–2033
- Norway Fuel Cell Market Outlook, by Power Output, 2020–2033
- Norway Fuel Cell Market Outlook, by Fuel Type, 2020–2033
- Denmark Fuel Cell Market Outlook, by Technology, 2020–2033
- Denmark Fuel Cell Market Outlook, by Application, 2020–2033
- Denmark Fuel Cell Market Outlook, by Power Output, 2020–2033
- Denmark Fuel Cell Market Outlook, by Fuel Type, 2020–2033
- Europe Fuel Cell Market Outlook, by Technology, Value (US$ Billion), 2020–2033
- Asia Pacific Fuel Cell Market Outlook, 2020–2033
- Asia Pacific Fuel Cell Market Outlook, by Technology, Value (US$ Billion), 2020–2033
- PEMFC
- SOFC
- PAFC
- MCFC
- AFC
- Direct Methanol
- Asia Pacific Fuel Cell Market Outlook, by Application, Value (US$ Billion), 2020–2033
- Transport
- Stationary Power
- Portable Power
- Asia Pacific Fuel Cell Market Outlook, by Power Output, Value (US$ Billion), 2020–2033
- Up to 10 kW
- 10 kW to 100 kW
- 100 kW to 1 MW
- Above 1 MW
- Asia Pacific Fuel Cell Market Outlook, by Fuel Type, Value (US$ Billion), 2020–2033
- Hydrogen
- Natural Gas
- Methanol
- Other Fuels
- Asia Pacific Fuel Cell Market Outlook, by Country, Value (US$ Billion), 2020–2033
- Japan Fuel Cell Market Outlook, by Technology, 2020–2033
- Japan Fuel Cell Market Outlook, by Application, 2020–2033
- Japan Fuel Cell Market Outlook, by Power Output, 2020–2033
- Japan Fuel Cell Market Outlook, by Fuel Type, 2020–2033
- South Korea Fuel Cell Market Outlook, by Technology, 2020–2033
- South Korea Fuel Cell Market Outlook, by Application, 2020–2033
- South Korea Fuel Cell Market Outlook, by Power Output, 2020–2033
- South Korea Fuel Cell Market Outlook, by Fuel Type, 2020–2033
- China Fuel Cell Market Outlook, by Technology, 2020–2033
- China Fuel Cell Market Outlook, by Application, 2020–2033
- China Fuel Cell Market Outlook, by Power Output, 2020–2033
- China Fuel Cell Market Outlook, by Fuel Type, 2020–2033
- Asia Pacific Fuel Cell Market Outlook, by Technology, Value (US$ Billion), 2020–2033
- Latin America Fuel Cell Market Outlook, 2020–2033
- Latin America Fuel Cell Market Outlook, by Technology, Value (US$ Billion), 2020–2033
- PEMFC
- SOFC
- PAFC
- MCFC
- AFC
- Direct Methanol
- Latin America Fuel Cell Market Outlook, by Application, Value (US$ Billion), 2020–2033
- Transport
- Stationary Power
- Portable Power
- Latin America Fuel Cell Market Outlook, by Power Output, Value (US$ Billion), 2020–2033
- Up to 10 kW
- 10 kW to 100 kW
- 100 kW to 1 MW
- Above 1 MW
- Latin America Fuel Cell Market Outlook, by Fuel Type, Value (US$ Billion), 2020–2033
- Hydrogen
- Natural Gas
- Methanol
- Other Fuels
- Latin America Fuel Cell Market Outlook, by Country, Value (US$ Billion), 2020–2033
- Chile Fuel Cell Market Outlook, by Technology, 2020–2033
- Chile Fuel Cell Market Outlook, by Application, 2020–2033
- Chile Fuel Cell Market Outlook, by Power Output, 2020–2033
- Chile Fuel Cell Market Outlook, by Fuel Type, 2020–2033
- Brazil Fuel Cell Market Outlook, by Technology, 2020–2033
- Brazil Fuel Cell Market Outlook, by Application, 2020–2033
- Brazil Fuel Cell Market Outlook, by Power Output, 2020–2033
- Brazil Fuel Cell Market Outlook, by Fuel Type, 2020–2033
- Colombia Fuel Cell Market Outlook, by Technology, 2020–2033
- Colombia Fuel Cell Market Outlook, by Application, 2020–2033
- Colombia Fuel Cell Market Outlook, by Power Output, 2020–2033
- Colombia Fuel Cell Market Outlook, by Fuel Type, 2020–2033
- Peru Fuel Cell Market Outlook, by Technology, 2020–2033
- Peru Fuel Cell Market Outlook, by Application, 2020–2033
- Peru Fuel Cell Market Outlook, by Power Output, 2020–2033
- Peru Fuel Cell Market Outlook, by Fuel Type, 2020–2033
- Latin America Fuel Cell Market Outlook, by Technology, Value (US$ Billion), 2020–2033
- Middle East & Africa Fuel Cell Market Outlook, 2020–2033
- Middle East & Africa Fuel Cell Market Outlook, by Technology, Value (US$ Billion), 2020–2033
- PEMFC
- SOFC
- PAFC
- MCFC
- AFC
- Direct Methanol
- Middle East & Africa Fuel Cell Market Outlook, by Application, Value (US$ Billion), 2020–2033
- Transport
- Stationary Power
- Portable Power
- Middle East & Africa Fuel Cell Market Outlook, by Power Output, Value (US$ Billion), 2020–2033
- Up to 10 kW
- 10 kW to 100 kW
- 100 kW to 1 MW
- Above 1 MW
- Middle East & Africa Fuel Cell Market Outlook, by Fuel Type, Value (US$ Billion), 2020–2033
- Hydrogen
- Natural Gas
- Methanol
- Other Fuels
- Middle East & Africa Fuel Cell Market Outlook, by Country, Value (US$ Billion), 2020–2033
- Saudi Arabia Fuel Cell Market Outlook, by Technology, 2020–2033
- Saudi Arabia Fuel Cell Market Outlook, by Application, 2020–2033
- Saudi Arabia Fuel Cell Market Outlook, by Power Output, 2020–2033
- Saudi Arabia Fuel Cell Market Outlook, by Fuel Type, 2020–2033
- United Arab Emirates Fuel Cell Market Outlook, by Technology, 2020–2033
- United Arab Emirates Fuel Cell Market Outlook, by Application, 2020–2033
- United Arab Emirates Fuel Cell Market Outlook, by Power Output, 2020–2033
- United Arab Emirates Fuel Cell Market Outlook, by Fuel Type, 2020–2033
- Oman Fuel Cell Market Outlook, by Technology, 2020–2033
- Oman Fuel Cell Market Outlook, by Application, 2020–2033
- Oman Fuel Cell Market Outlook, by Power Output, 2020–2033
- Oman Fuel Cell Market Outlook, by Fuel Type, 2020–2033
- Egypt Fuel Cell Market Outlook, by Technology, 2020–2033
- Egypt Fuel Cell Market Outlook, by Application, 2020–2033
- Egypt Fuel Cell Market Outlook, by Power Output, 2020–2033
- Egypt Fuel Cell Market Outlook, by Fuel Type, 2020–2033
- South Africa Fuel Cell Market Outlook, by Technology, 2020–2033
- South Africa Fuel Cell Market Outlook, by Application, 2020–2033
- South Africa Fuel Cell Market Outlook, by Power Output, 2020–2033
- South Africa Fuel Cell Market Outlook, by Fuel Type, 2020–2033
- Middle East & Africa Fuel Cell Market Outlook, by Technology, Value (US$ Billion), 2020–2033
- Competitive Landscape
- Market Concentration and Industry Leaders
- Competitive Differentiation
- Strategic Moves and Market Direction
- Recent Industry Developments
- Company Profiles
- Ballard Power Systems Inc.
- Bloom Energy Corporation
- Plug Power Inc.
- Doosan Fuel Cell Co., Ltd.
- Panasonic Holdings Corporation
- Toyota Motor Corporation
- Hyundai Motor Company
- Honda Motor Co., Ltd.
- Cummins Inc.
- Robert Bosch GmbH
- Ceres Power Holdings plc
- FuelCell Energy, Inc.
- PowerCell Sweden AB
- SFC Energy AG
- Appendix
- Research Methodology
- Report Assumptions
- Acronyms and Abbreviations
Technology
- PEMFC
- SOFC
- PAFC
- MCFC
- AFC
- Direct Methanol
Application
- Transport
- Stationary Power
- Portable Power
Power Output
- Up to 10 kW
- 10 kW to 100 kW
- 100 kW to 1 MW
- Above 1 MW
Fuel Type
- Hydrogen
- Natural Gas
- Methanol
- Other Fuels
Regions
- North America
- Europe
- Asia Pacific
- Latin America
- Middle East & Africa
Our Research Methodology
Considering the volatility of business today, traditional approaches to strategizing a game plan can be unfruitful if not detrimental. True ambiguity is no way to determine a forecast. A myriad of predetermined factors must be accounted for such as the degree of risk involved, the magnitude of circumstances, as well as conditions or consequences that are not known or unpredictable. To circumvent binary views that cast uncertainty, the application of market research intelligence to strategically posture, move, and enable actionable outcomes is necessary.
View Methodology
Quality Assured
Rigorous Validation Process

Confidentiality Assured
End-to-end Data Security

Custom Research Services
Tailored To Your Objectives
FAQs
The fuel cell market is valued at US$ 7.2 billion in 2026, covering stacks and complete systems for transport, stationary and portable power applications.
The market is projected to reach US$ 21.6 billion by 2033, growing at a 17.0% CAGR and adding US$ 14.4 billion in absolute opportunity.
PEMFC leads with 68% share in 2026, because low operating temperature and fast start-up suit transport and small combined heat and power systems.
SOFC grows fastest at a 20.4% CAGR, because high electrical efficiency and fuel flexibility make continuous prime power economically viable today.
Asia Pacific holds 46% share in 2026, reflecting sustained policy support and the largest installed base of stationary and vehicle systems.
Related Reports
Offshore Oil and Gas Equipment Market Size, Share, Insights, Competitive Landscape, and Forecast 2026 to 2033
The offshore oil and gas equipment market is projected to grow from US$94.0 billion in 2026 to US$138.0 billion by 2033, at a 5.6% CAGR. Explore trends.
Floating Storage and Regasification Unit Market Size, Share, Insights, Competitive Landscape, and Forecast 2026 to 2033
Floating storage and regasification unit market to grow from US$8.96 Bn in 2026 to US$13.92 Bn by 2033 at 6.5% CAGR. Explore types, mooring and regions.
Floating Solar Market Size, Share, Insights, Competitive Landscape, and Forecast 2026 to 2033
Floating solar market to grow from US$1.60 Bn in 2026 to US$4.02 Bn by 2033 at 14.1% CAGR. Explore capacities, products, locations and regional trends.
Offshore Grid Connection Solutions Market Size, Share, Insights, Competitive Landscape, and Forecast 2026 to 2033
Offshore grid connection solutions market to reach US$ 5.71 billion by 2033 at a 6.7% CAGR. Explore HVDC, subsea cables, applications and regional trends.
Nickel Hydrogen Batteries Market Size, Share, Insights, Competitive Landscape, and Forecast 2026 to 2033
Nickel hydrogen batteries market to reach US$11.85 billion by 2033 at 13.7% CAGR, driven by hybrid vehicles and stationary energy storage.
Landing String Equipment Market Size, Share, Insights, Competitive Landscape, and Forecast 2026 to 2033
Explore the landing string equipment market, reaching US$ 0.80 billion by 2033 at 6.6% CAGR, with component, technology and regional insights.