



Healthcare Reimbursement Market
Healthcare Reimbursement Market Size, Share, Insights, Competitive Landscape, and Forecast 2026 to 2033
Healthcare Reimbursement Market Size and Trend Analysis
What Is Driving Healthcare Reimbursement Market Growth?
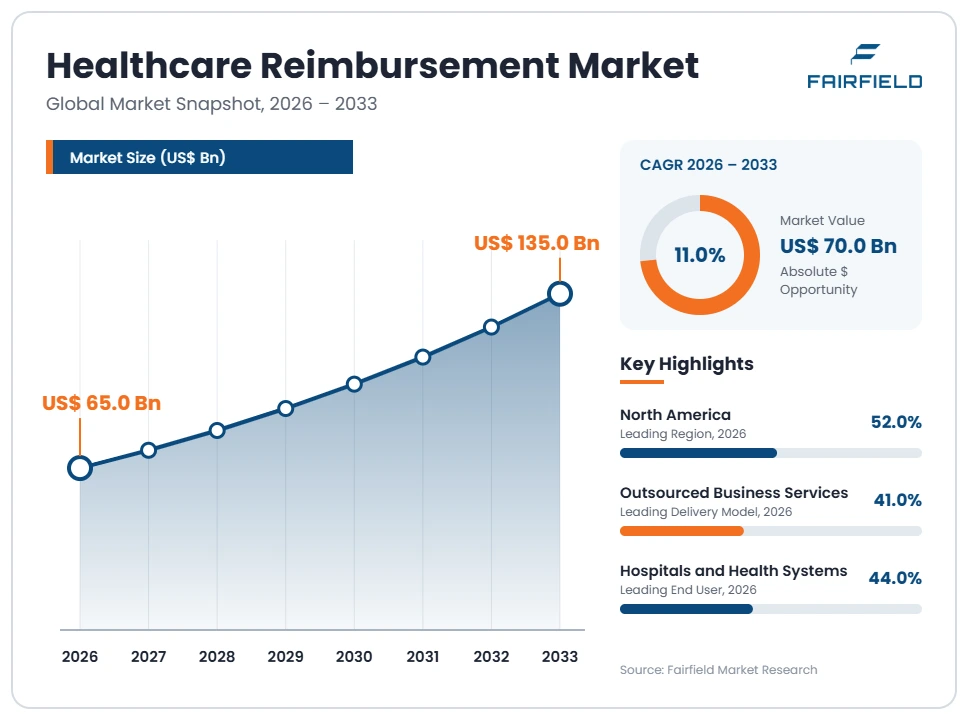
The global Healthcare Reimbursement market size is expected to be valued at US$ 65.0 billion in 2026 and projected to reach US$ 135.0 billion by 2033, growing at a CAGR of 11.0% between 2026 and 2033.
This study measures spending on reimbursement services, software and revenue cycle operations, not the healthcare expenditure that flows through those systems. On that basis the market grew at an estimated 9.8% CAGR from 2020 to 2025. Three factors carry the forecast. First, claim denial rates have risen, so providers spend more on appeals, coding accuracy and payment integrity. Second, electronic prior authorisation mandates are forcing payers and vendors to rebuild workflows on application programming interfaces. Third, persistent staffing shortages in revenue cycle departments push hospitals toward outsourcing and automation. Direction is firmly upward, although budget pressure on providers and slow movement away from fee-for-service keep growth in double digits rather than accelerating further.
Key Report Takeaways
- By Service Type: Claims Processing and Adjudication held 31.0% share in 2026, while Prior Authorization and Utilization Management is projected to expand at a 14.3% CAGR through 2033, driven by federal electronic prior authorisation requirements and decision-turnaround deadlines.
- By Delivery Model: Outsourced Business Services held 41.0% share in 2026, while Cloud-Based Software is projected to expand at a 15.1% CAGR through 2033, as providers replace ageing on-premise billing systems with subscription platforms carrying continuous regulatory updates.
- By Payment Model: Fee-for-Service held 38.0% share in 2026, while Value-Based and Alternative Payment Models are projected to expand at a 15.8% CAGR through 2033, supported by quality-reporting programmes and shared-savings contracting.
- By End User: Hospitals and Health Systems held 44.0% share in 2026, while Physician Practices and Ambulatory Clinics are projected to expand at a 13.5% CAGR through 2033, as care shifts to outpatient settings with thin administrative staffing.
- By Geography: North America held 52.0% share in 2026, while Asia Pacific is projected to expand at a 14.5% CAGR through 2033, on the back of insurance coverage expansion and case-based payment rollouts.
Global Healthcare Reimbursement Market Trends and Insights
Drivers Impact Analysis
Two structural forces account for most incremental spending on reimbursement systems and services to 2033.
| Driver | Impact on CAGR Forecast | Geographic Relevance | Impact Timeline |
| Electronic prior authorisation mandates and decision-turnaround rules | High | North America | Short term ≤2 years |
| Rising denial rates and revenue cycle staffing shortages | High | Global | Medium term 2–4 years |
Electronic Prior Authorization Mandates Force Payer and Provider System Rebuilds
Regulatory deadlines are creating a defined, time-bound spending wave across payers and their vendors. The Centers for Medicare & Medicaid Services Interoperability and Prior Authorization final rule obliges affected payers to publish application programming interfaces for prior authorisation, to report metrics, and to meet shortened decision timeframes. Compliance work touches utilisation management platforms, provider portals, clearinghouse connections and documentation workflows at the same time.
The mechanism is technical integration rather than policy sentiment. Payers must expose authorisation requirements and status through standards-based interfaces, which requires mapping internal rules engines to Health Level Seven International Fast Healthcare Interoperability Resources profiles. Providers must then consume those interfaces inside electronic health record workflows. Neither side can complete this with existing staff, so budget moves to software licences, interface engineering and managed services, with knock-on demand for testing and conformance support.
Climbing Denial Rates and Revenue Cycle Vacancies Push Providers Toward Outsourcing
Denials have become the dominant operational problem in provider finance, and they convert directly into vendor revenue. Hospitals report a rising share of initial claims denied, with a meaningful portion later overturned on appeal. Each denial consumes staff time for review, documentation retrieval and resubmission, so finance leaders buy analytics, automation and outsourced appeal capacity to recover cash that would otherwise be written off.
The cause is a labour and complexity squeeze. Coding, billing and patient access roles carry high vacancy and turnover rates, while documentation requirements, payer-specific edits and medical necessity criteria keep multiplying. Training a new coder to productivity takes months, and ICD-10 code sets are updated annually. Outsourcing partners and automation vendors absorb that complexity at lower unit cost, which is why hospitals increasingly transfer whole revenue cycle functions rather than hiring.
Restraints Impact Analysis
Two restraints limit how quickly reimbursement spending converts into vendor revenue growth.
| Restraint | Impact on CAGR Forecast | Geographic Relevance | Impact Timeline |
| Provider margin pressure and constrained administrative budgets | High | North America, Europe | Medium term 2–4 years |
| Fragmented payer rules and legacy transaction infrastructure | Medium | Global | Long term ≥4 years |
Thin Provider Margins Delay Revenue Cycle Technology Replacement Cycles
Weak operating margins at hospitals slow the purchase of reimbursement technology even where the business case is clear. Many health systems run low single-digit or negative operating margins, so capital committees defer administrative software in favour of clinical equipment and staffing. Replacement cycles for billing systems stretch past a decade, and multi-year contracts lock providers into platforms that cannot support newer workflows.
The specific cost source is implementation, not licensing. Replacing a patient accounting system involves data migration, chargemaster reconfiguration, payer contract reloading, parallel testing and a cash-flow dip during go-live, which can exceed the software fee several times over. Finance leaders also carry the risk of accounts receivable disruption during transition. That combination pushes buyers toward incremental add-on tools rather than full platform replacement, which caps deal sizes.
Payer Rule Fragmentation and Legacy Transaction Formats Slow Automation Gains
Automation delivers less than vendors promise because payer requirements are not uniform. Each payer maintains its own edits, medical necessity policies, authorisation lists and appeal formats, so rules built for one plan rarely transfer to another. National providers must maintain hundreds of rule variants, which keeps manual exception handling in the workflow and limits the straight-through processing rates that justify platform investment.
The underlying cause is infrastructural. Administrative transactions run on HIPAA-mandated standards and X12 formats such as the 837 claim, 835 remittance and 278 authorisation, which are mature, widely deployed and limited in the clinical detail they carry. Attachments and clinical documentation still travel by fax, portal upload or mail in many workflows. Replacing that layer requires coordinated change across every payer and clearinghouse, which no single vendor can force.
Market Opportunities
Payment Integrity Analytics Opens a Recovery-Linked Revenue Pool for Vendors
Payment integrity is becoming a distinct, contingency-priced revenue pool rather than a feature of claims software. Payers and risk-bearing providers pay for pre-payment edits, coding validation, coordination-of-benefits checks and post-payment audit recovery, often on a share-of-savings basis. That pricing model scales with the volume of improper payments identified, so vendor revenue grows faster than the underlying transaction count and is less exposed to administrative budget freezes.
Analytics specialists, clearinghouses and large outsourcing firms with claims data access are best placed to capture it. Demand comes from commercial plans, managed care organisations and government programme administrators facing improper payment scrutiny. Expanded audit activity around diagnosis coding and risk adjustment supports the category, while machine learning applied to historical claim and remittance data improves detection precision. Access to longitudinal claims data, not algorithms alone, is the real entry barrier.
Case-Based Payment Reform in Emerging Health Systems Creates a Greenfield Software Market
Health systems adopting diagnosis-related group and case-based payment for the first time represent a greenfield market for grouper software, coding tools and claims infrastructure. Countries moving from global budgets or itemised billing to case-based payment must build coding capacity, costing databases, grouper logic and audit functions almost from scratch. Procurement is typically national or provincial, so individual contracts are large and multi-year.
Vendors with localisable grouper and costing products, plus implementation and training capacity, can capture this pool. Demand originates from health ministries, national insurance funds and provider associations rather than individual hospitals. The World Health Organization transition from ICD-10 to ICD-11 gives these programmes a natural modernisation trigger, since classification change forces tooling change. Local language support, national coding standards and public procurement experience determine who wins these awards.
Segment Analysis
- By Service Type: Claims Processing Leads While Prior Authorization Services Accelerate
Claims Processing and Adjudication held 31.0% of the reimbursement services and software market in 2026, the largest service type, because every encounter generates a claim and every claim must be submitted, scrubbed, adjudicated and reconciled. Volume makes it the default spend category for payers and clearinghouses alike. Prior Authorization and Utilization Management is the fastest-growing service at a 14.3% CAGR through 2033, pushed by federal electronic authorisation requirements and shortened decision deadlines that obsolete fax and portal workflows. Coding and Clinical Documentation Services remain large and labour-intensive, Denials Management and Appeals is expanding alongside rising denial rates, and Payment Integrity and Audit Services monetises recovery. The implication for buyers is that authorisation workflow, long treated as an administrative afterthought, is now the fastest-moving procurement line in revenue cycle management.
- By Delivery Model: Outsourced Services Dominate as Cloud Platforms Compound Fastest
Outsourced Business Services accounted for 41.0% of market value in 2026, the leading delivery model, because providers facing coding and billing vacancies buy capacity rather than tools. Full-function outsourcing also converts fixed staffing cost into variable cost tied to collections, which suits unstable volumes. Cloud-Based Software is the fastest-growing model at a 15.1% CAGR to 2033, as subscription platforms deliver payer rule updates, annual code set changes and new interface standards without local upgrade projects. On-Premise Software is in slow decline, retained mainly where data residency or integration debt prevents migration, while Hybrid and Managed Services bridge the two. The practical effect is that vendor revenue is shifting from one-time licences toward recurring contracts, which raises retention value and makes switching costs a central competitive variable.
- By Payment Model: Fee-for-Service Still Leads While Alternative Models Grow Quickest
Fee-for-Service accounted for 38.0% of reimbursement activity in 2026 and remains the dominant payment basis worldwide. It is administratively familiar, supported by established coding and claim infrastructure, and it still underpins most commercial and public contracts. Value-Based and Alternative Payment Models are the fastest-growing category at a 15.8% CAGR through 2033, supported by quality reporting under MACRA and its Quality Payment Program and by shared-savings and risk-sharing contracts. Diagnosis-Related Group and Case-Based Payment holds a large institutional share through the Medicare inpatient prospective payment system and comparable European and Asian schemes, while Capitation and Bundled Payments occupy defined niches. The operational consequence is that providers must run several payment logics simultaneously, which raises demand for systems that reconcile all of them in one ledger.
- By End User: Hospitals Anchor Spending While Ambulatory Practices Expand Fastest
Hospitals and Health Systems represented 44.0% of spending in 2026, the largest end user group, because inpatient billing involves the most complex coding, the highest claim values and the largest internal revenue cycle departments. Their scale also makes them the primary buyers of enterprise platforms and full outsourcing contracts. Physician Practices and Ambulatory Clinics are the fastest-growing end user at a 13.5% CAGR to 2033, as procedures migrate to outpatient settings staffed by small administrative teams that depend on vendor automation. Payers and Insurers buy adjudication, payment integrity and authorisation technology, Diagnostic Laboratories and Imaging Centres manage high claim volumes at low unit values, and Long-Term and Post-Acute Care Providers face their own documentation rules. Vendors are accordingly repackaging enterprise capability into smaller, faster-deploying products.
Geography Analysis
- Which Region Is Leading the Healthcare Reimbursement Market?
North America leads the Healthcare Reimbursement market with 52.0% revenue share in 2026, growing at a 9.8% CAGR to 2033. The United States supplies almost all of that value, because it combines a multi-payer insurance structure, the Medicare inpatient prospective payment system, detailed coding requirements and extensive administrative regulation. Each additional payer in a provider’s mix multiplies the rules that must be managed, which is why administrative spending per encounter is the highest in the world here. Canada contributes a much smaller amount through provincial billing and activity-based funding initiatives. Federal rules including the No Surprises Act and the prior authorisation requirements set by the Centers for Medicare & Medicaid Services keep generating compliance work. The region’s defining change is the move of entire revenue cycle functions to external operators.
- Europe Standardises Case-Based Payment Across National Health Systems
Europe held 21.0% of the market in 2026, growing at an estimated 10.5% CAGR through 2033. Germany, France, the United Kingdom, the Netherlands and the Nordic countries drive demand. Most national systems reimburse hospitals through diagnosis-related group or activity-based schemes, which require grouper software, cost accounting, coding audit and central data submission. Germany’s case-based hospital system and England’s national payment scheme are the largest single workloads. Because payment flows mainly through public funds, procurement is centralised, contract cycles are long and price competition is intense. The General Data Protection Regulation shapes where claim data may be processed, which limits offshore delivery models. Hospital reform programmes that tie funding to service specialisation are the main change expanding demand for costing and coding tools.
- Which Region Is Growing Fastest in the Healthcare Reimbursement Market?
Asia Pacific is growing fastest in the Healthcare Reimbursement market, at a 14.5% CAGR between 2026 and 2033, from an 18.0% share in 2026. China, India, Japan, South Korea, Australia and Indonesia account for most activity. Growth comes from two sources: insurance coverage expansion through national schemes, and the shift from itemised billing to case-based payment, which obliges hospitals to code accurately and submit structured claims. India’s publicly funded hospitalisation scheme processes very large claim volumes and has built digital pre-authorisation and audit workflows around them. Japan and Australia operate mature case-mix systems that require continuous classification maintenance. The region is also a major delivery base for offshore coding and billing operations, which concentrates both demand and supply in the same geography.
- Latin America Builds Claims Infrastructure Around Mixed Public and Private Payers
Latin America represented 5.0% of global revenue in 2026 and is projected to advance at an 11.5% CAGR through 2033. Brazil, Mexico, Chile and Colombia lead, each combining a public system with a sizeable private insurance sector. Brazil’s supplementary health segment generates substantial commercial claim volume and has adopted standardised electronic exchange between providers and operators, which creates demand for billing and audit tools. Barriers are significant: provider fragmentation leaves many clinics without usable billing systems, payment delays strain working capital, currency volatility complicates multi-year software contracts, and coding capacity is uneven. The clearest opportunity is cloud billing and denial management priced for small and mid-sized clinics, sold locally in Portuguese and Spanish with support for national transaction standards.
- Middle East & Africa Advances Through Mandatory Insurance and E-Claim Platforms
Middle East & Africa accounted for 4.0% of the market in 2026 and is forecast to grow at an 11.0% CAGR to 2033. The United Arab Emirates, Saudi Arabia and South Africa dominate current spending. Mandatory health insurance in Gulf states has created structured claim ecosystems, with central e-claim exchanges, standardised coding requirements and regulated adjudication timelines that providers must meet. Saudi Arabia’s health sector transformation separates purchasing from provision, which directly increases reimbursement workload. Barriers remain considerable: coding workforce depth is limited, many African systems still run on out-of-pocket payment with little claims activity, and infrastructure gaps slow electronic submission. Expansion of national health insurance schemes in Egypt, Nigeria, Kenya and Ghana is the change most likely to widen the addressable base.
Competitive Landscape
The Healthcare Reimbursement market is moderately concentrated. A small group of large platforms and outsourcing firms handles a substantial share of claim volume and enterprise contracts, including Optum, Inc., R1 RCM Inc., Waystar Holding Corp., Cotiviti, Inc. and Ensemble Health Partners, while hundreds of regional billing companies, coding firms and niche software vendors serve smaller providers. Concentration is highest in clearinghouse connectivity and payment integrity, where network reach and claims data scale create advantage, and lowest in physician billing services, where local relationships still win work. Private equity ownership and sustained consolidation have steadily reduced the number of mid-sized independent vendors.
Competition rests on measurable financial outcomes rather than feature lists. Buyers evaluate clean claim rates, days in accounts receivable, denial overturn rates, cost to collect and cash acceleration during transition. Payer connectivity breadth matters because every missing payer connection reverts to manual work. Electronic health record integration depth is a second gate, since vendors that work natively inside the clinical record capture documentation at the source. New entrants are largely automation specialists applying language models to coding, documentation review and appeal letter drafting, often sold as a layer on top of incumbent systems rather than as a replacement.
Strategic activity centres on assembling end-to-end coverage. Vendors have pursued acquisitions that add payment integrity, prior authorisation or patient financial engagement capability, signed partnerships with electronic health record suppliers, and expanded offshore delivery centres to control labour cost. Each move addresses a gap: acquisitions buy workflow adjacency, partnerships secure distribution, and offshore capacity protects margin as contracts price on outcomes.
Strategic direction is converging on automation with accountability. Vendors are investing in autonomous coding, denial prediction and standards-based interfaces, while accepting more risk-based pricing tied to collections performance.
Recent Industry Developments
- January 2022: The No Surprises Act took effect in the United States, barring balance billing in defined out-of-network situations and establishing an independent dispute resolution process – it created an entirely new arbitration and documentation workload for payers and providers.
- January 2022: The World Health Organization brought ICD-11 into effect for member state reporting – it set a multi-year classification migration that will require grouper, coding and analytics tooling to be rebuilt.
- January 2024: The Centers for Medicare & Medicaid Services finalised the Interoperability and Prior Authorization rule, requiring affected payers to build prior authorisation application programming interfaces and report authorisation metrics – it converted electronic prior authorisation from an option into a compliance deadline.
- January 2026: Shortened prior authorisation decision timeframes under that rule began applying to affected payers, with expedited requests due within 72 hours and standard requests within seven calendar days – it forces utilisation management automation rather than added staffing.
- October 2025: The United States federal fiscal year 2026 inpatient prospective payment system update took effect, as diagnosis-related group weights and payment rates are revised each October 1 – it keeps annual coding, contract modelling and reconciliation work on a fixed cycle.
Companies Covered in the Report
- Optum, Inc.
- R1 RCM Inc.
- Waystar Holding Corp.
- Cotiviti, Inc.
- Ensemble Health Partners
- Conifer Health Solutions, LLC
- Availity, LLC
- Experian Health
- Veradigm Inc.
- athenahealth, Inc.
- Oracle Corporation
- Cognizant Technology Solutions Corporation
- AGS Health
- Omega Healthcare Management Services
- Infinx Inc.
Healthcare Reimbursement Market Report Scope
| Metric | Value |
| Study Period | 2020–2033 |
| Market Size 2026 | US$ 65.0 Billion |
| Market Size 2033 | US$ 135.0 Billion |
| CAGR 2026–2033 | 11.0% |
| Absolute Dollar Opportunity | US$ 70.0 Billion |
| Largest Market | North America (52.0% share, 2026) |
| Fastest-Growing Market | Asia Pacific (14.5% CAGR) |
| Market Concentration | Medium |
| Major Players | Optum, Inc., R1 RCM Inc., Waystar Holding Corp., Cotiviti, Inc., Ensemble Health Partners |
Healthcare Reimbursement Market Segmentation
Service Type
- Claims Processing and Adjudication
- Coding and Clinical Documentation Services
- Prior Authorization and Utilization Management
- Denials Management and Appeals
- Payment Integrity and Audit Services
Delivery Model
- Outsourced Business Services
- Cloud-Based Software
- On-Premise Software
- Hybrid and Managed Services
Payment Model
- Fee-for-Service
- Diagnosis-Related Group and Case-Based Payment
- Capitation
- Bundled Payments
- Value-Based and Alternative Payment Models
End User
- Hospitals and Health Systems
- Physician Practices and Ambulatory Clinics
- Diagnostic Laboratories and Imaging Centres
- Payers and Insurers
- Long-Term and Post-Acute Care Providers
Regions
- North America
- Europe
- Asia Pacific
- Latin America
- Middle East & Africa
- Executive Summary
- Global Healthcare Reimbursement Market Snapshot
- Future Projections
- Key Report Takeaways
- Regional Snapshot
- Market Overview
- Market Definition and Report Scope
- Historical Trends 2020–2025
- Market Dynamics
- Drivers
- Electronic Prior Authorization Mandates Force Payer and Provider System Rebuilds
- Climbing Denial Rates and Revenue Cycle Vacancies Push Providers Toward Outsourcing
- Restraints
- Thin Provider Margins Delay Revenue Cycle Technology Replacement Cycles
- Payer Rule Fragmentation and Legacy Transaction Formats Slow Automation Gains
- Market Opportunities
- Payment Integrity Analytics Opens a Recovery-Linked Revenue Pool for Vendors
- Case-Based Payment Reform in Emerging Health Systems Creates a Greenfield Software Market
- Drivers
- Global Healthcare Reimbursement Market Outlook, 2020–2033
- Global Healthcare Reimbursement Market Outlook, by Service Type, Value (US$ Billion), 2020–2033
- Claims Processing and Adjudication
- Coding and Clinical Documentation Services
- Prior Authorization and Utilization Management
- Denials Management and Appeals
- Payment Integrity and Audit Services
- Global Healthcare Reimbursement Market Outlook, by Delivery Model, Value (US$ Billion), 2020–2033
- Outsourced Business Services
- Cloud-Based Software
- On-Premise Software
- Hybrid and Managed Services
- Global Healthcare Reimbursement Market Outlook, by Payment Model, Value (US$ Billion), 2020–2033
- Fee-for-Service
- Diagnosis-Related Group and Case-Based Payment
- Capitation
- Bundled Payments
- Value-Based and Alternative Payment Models
- Global Healthcare Reimbursement Market Outlook, by End User, Value (US$ Billion), 2020–2033
- Hospitals and Health Systems
- Physician Practices and Ambulatory Clinics
- Diagnostic Laboratories and Imaging Centres
- Payers and Insurers
- Long-Term and Post-Acute Care Providers
- Global Healthcare Reimbursement Market Outlook, by Region, Value (US$ Billion), 2020–2033
- North America
- Europe
- Asia Pacific
- Latin America
- Middle East & Africa
- Global Healthcare Reimbursement Market Outlook, by Service Type, Value (US$ Billion), 2020–2033
- North America Healthcare Reimbursement Market Outlook, 2020–2033
- North America Healthcare Reimbursement Market Outlook, by Service Type, Value (US$ Billion), 2020–2033
- Claims Processing and Adjudication
- Coding and Clinical Documentation Services
- Prior Authorization and Utilization Management
- Denials Management and Appeals
- Payment Integrity and Audit Services
- North America Healthcare Reimbursement Market Outlook, by Delivery Model, Value (US$ Billion), 2020–2033
- Outsourced Business Services
- Cloud-Based Software
- On-Premise Software
- Hybrid and Managed Services
- North America Healthcare Reimbursement Market Outlook, by Payment Model, Value (US$ Billion), 2020–2033
- Fee-for-Service
- Diagnosis-Related Group and Case-Based Payment
- Capitation
- Bundled Payments
- Value-Based and Alternative Payment Models
- North America Healthcare Reimbursement Market Outlook, by End User, Value (US$ Billion), 2020–2033
- Hospitals and Health Systems
- Physician Practices and Ambulatory Clinics
- Diagnostic Laboratories and Imaging Centres
- Payers and Insurers
- Long-Term and Post-Acute Care Providers
- North America Healthcare Reimbursement Market Outlook, by Country, Value (US$ Billion), 2020–2033
- United States Healthcare Reimbursement Market Outlook, by Service Type, 2020–2033
- United States Healthcare Reimbursement Market Outlook, by Delivery Model, 2020–2033
- United States Healthcare Reimbursement Market Outlook, by Payment Model, 2020–2033
- United States Healthcare Reimbursement Market Outlook, by End User, 2020–2033
- Canada Healthcare Reimbursement Market Outlook, by Service Type, 2020–2033
- Canada Healthcare Reimbursement Market Outlook, by Delivery Model, 2020–2033
- Canada Healthcare Reimbursement Market Outlook, by Payment Model, 2020–2033
- Canada Healthcare Reimbursement Market Outlook, by End User, 2020–2033
- North America Healthcare Reimbursement Market Outlook, by Service Type, Value (US$ Billion), 2020–2033
- Europe Healthcare Reimbursement Market Outlook, 2020–2033
- Europe Healthcare Reimbursement Market Outlook, by Service Type, Value (US$ Billion), 2020–2033
- Claims Processing and Adjudication
- Coding and Clinical Documentation Services
- Prior Authorization and Utilization Management
- Denials Management and Appeals
- Payment Integrity and Audit Services
- Europe Healthcare Reimbursement Market Outlook, by Delivery Model, Value (US$ Billion), 2020–2033
- Outsourced Business Services
- Cloud-Based Software
- On-Premise Software
- Hybrid and Managed Services
- Europe Healthcare Reimbursement Market Outlook, by Payment Model, Value (US$ Billion), 2020–2033
- Fee-for-Service
- Diagnosis-Related Group and Case-Based Payment
- Capitation
- Bundled Payments
- Value-Based and Alternative Payment Models
- Europe Healthcare Reimbursement Market Outlook, by End User, Value (US$ Billion), 2020–2033
- Hospitals and Health Systems
- Physician Practices and Ambulatory Clinics
- Diagnostic Laboratories and Imaging Centres
- Payers and Insurers
- Long-Term and Post-Acute Care Providers
- Europe Healthcare Reimbursement Market Outlook, by Country, Value (US$ Billion), 2020–2033
- Germany Healthcare Reimbursement Market Outlook, by Service Type, 2020–2033
- Germany Healthcare Reimbursement Market Outlook, by Delivery Model, 2020–2033
- Germany Healthcare Reimbursement Market Outlook, by Payment Model, 2020–2033
- Germany Healthcare Reimbursement Market Outlook, by End User, 2020–2033
- France Healthcare Reimbursement Market Outlook, by Service Type, 2020–2033
- France Healthcare Reimbursement Market Outlook, by Delivery Model, 2020–2033
- France Healthcare Reimbursement Market Outlook, by Payment Model, 2020–2033
- France Healthcare Reimbursement Market Outlook, by End User, 2020–2033
- United Kingdom Healthcare Reimbursement Market Outlook, by Service Type, 2020–2033
- United Kingdom Healthcare Reimbursement Market Outlook, by Delivery Model, 2020–2033
- United Kingdom Healthcare Reimbursement Market Outlook, by Payment Model, 2020–2033
- United Kingdom Healthcare Reimbursement Market Outlook, by End User, 2020–2033
- Netherlands Healthcare Reimbursement Market Outlook, by Service Type, 2020–2033
- Netherlands Healthcare Reimbursement Market Outlook, by Delivery Model, 2020–2033
- Netherlands Healthcare Reimbursement Market Outlook, by Payment Model, 2020–2033
- Netherlands Healthcare Reimbursement Market Outlook, by End User, 2020–2033
- Nordic countries Healthcare Reimbursement Market Outlook, by Service Type, 2020–2033
- Nordic countries Healthcare Reimbursement Market Outlook, by Delivery Model, 2020–2033
- Nordic countries Healthcare Reimbursement Market Outlook, by Payment Model, 2020–2033
- Nordic countries Healthcare Reimbursement Market Outlook, by End User, 2020–2033
- Europe Healthcare Reimbursement Market Outlook, by Service Type, Value (US$ Billion), 2020–2033
- Asia Pacific Healthcare Reimbursement Market Outlook, 2020–2033
- Asia Pacific Healthcare Reimbursement Market Outlook, by Service Type, Value (US$ Billion), 2020–2033
- Claims Processing and Adjudication
- Coding and Clinical Documentation Services
- Prior Authorization and Utilization Management
- Denials Management and Appeals
- Payment Integrity and Audit Services
- Asia Pacific Healthcare Reimbursement Market Outlook, by Delivery Model, Value (US$ Billion), 2020–2033
- Outsourced Business Services
- Cloud-Based Software
- On-Premise Software
- Hybrid and Managed Services
- Asia Pacific Healthcare Reimbursement Market Outlook, by Payment Model, Value (US$ Billion), 2020–2033
- Fee-for-Service
- Diagnosis-Related Group and Case-Based Payment
- Capitation
- Bundled Payments
- Value-Based and Alternative Payment Models
- Asia Pacific Healthcare Reimbursement Market Outlook, by End User, Value (US$ Billion), 2020–2033
- Hospitals and Health Systems
- Physician Practices and Ambulatory Clinics
- Diagnostic Laboratories and Imaging Centres
- Payers and Insurers
- Long-Term and Post-Acute Care Providers
- Asia Pacific Healthcare Reimbursement Market Outlook, by Country, Value (US$ Billion), 2020–2033
- China Healthcare Reimbursement Market Outlook, by Service Type, 2020–2033
- China Healthcare Reimbursement Market Outlook, by Delivery Model, 2020–2033
- China Healthcare Reimbursement Market Outlook, by Payment Model, 2020–2033
- China Healthcare Reimbursement Market Outlook, by End User, 2020–2033
- India Healthcare Reimbursement Market Outlook, by Service Type, 2020–2033
- India Healthcare Reimbursement Market Outlook, by Delivery Model, 2020–2033
- India Healthcare Reimbursement Market Outlook, by Payment Model, 2020–2033
- India Healthcare Reimbursement Market Outlook, by End User, 2020–2033
- Japan Healthcare Reimbursement Market Outlook, by Service Type, 2020–2033
- Japan Healthcare Reimbursement Market Outlook, by Delivery Model, 2020–2033
- Japan Healthcare Reimbursement Market Outlook, by Payment Model, 2020–2033
- Japan Healthcare Reimbursement Market Outlook, by End User, 2020–2033
- South Korea Healthcare Reimbursement Market Outlook, by Service Type, 2020–2033
- South Korea Healthcare Reimbursement Market Outlook, by Delivery Model, 2020–2033
- South Korea Healthcare Reimbursement Market Outlook, by Payment Model, 2020–2033
- South Korea Healthcare Reimbursement Market Outlook, by End User, 2020–2033
- Australia Healthcare Reimbursement Market Outlook, by Service Type, 2020–2033
- Australia Healthcare Reimbursement Market Outlook, by Delivery Model, 2020–2033
- Australia Healthcare Reimbursement Market Outlook, by Payment Model, 2020–2033
- Australia Healthcare Reimbursement Market Outlook, by End User, 2020–2033
- Indonesia Healthcare Reimbursement Market Outlook, by Service Type, 2020–2033
- Indonesia Healthcare Reimbursement Market Outlook, by Delivery Model, 2020–2033
- Indonesia Healthcare Reimbursement Market Outlook, by Payment Model, 2020–2033
- Indonesia Healthcare Reimbursement Market Outlook, by End User, 2020–2033
- Asia Pacific Healthcare Reimbursement Market Outlook, by Service Type, Value (US$ Billion), 2020–2033
- Latin America Healthcare Reimbursement Market Outlook, 2020–2033
- Latin America Healthcare Reimbursement Market Outlook, by Service Type, Value (US$ Billion), 2020–2033
- Claims Processing and Adjudication
- Coding and Clinical Documentation Services
- Prior Authorization and Utilization Management
- Denials Management and Appeals
- Payment Integrity and Audit Services
- Latin America Healthcare Reimbursement Market Outlook, by Delivery Model, Value (US$ Billion), 2020–2033
- Outsourced Business Services
- Cloud-Based Software
- On-Premise Software
- Hybrid and Managed Services
- Latin America Healthcare Reimbursement Market Outlook, by Payment Model, Value (US$ Billion), 2020–2033
- Fee-for-Service
- Diagnosis-Related Group and Case-Based Payment
- Capitation
- Bundled Payments
- Value-Based and Alternative Payment Models
- Latin America Healthcare Reimbursement Market Outlook, by End User, Value (US$ Billion), 2020–2033
- Hospitals and Health Systems
- Physician Practices and Ambulatory Clinics
- Diagnostic Laboratories and Imaging Centres
- Payers and Insurers
- Long-Term and Post-Acute Care Providers
- Latin America Healthcare Reimbursement Market Outlook, by Country, Value (US$ Billion), 2020–2033
- Brazil Healthcare Reimbursement Market Outlook, by Service Type, 2020–2033
- Brazil Healthcare Reimbursement Market Outlook, by Delivery Model, 2020–2033
- Brazil Healthcare Reimbursement Market Outlook, by Payment Model, 2020–2033
- Brazil Healthcare Reimbursement Market Outlook, by End User, 2020–2033
- Mexico Healthcare Reimbursement Market Outlook, by Service Type, 2020–2033
- Mexico Healthcare Reimbursement Market Outlook, by Delivery Model, 2020–2033
- Mexico Healthcare Reimbursement Market Outlook, by Payment Model, 2020–2033
- Mexico Healthcare Reimbursement Market Outlook, by End User, 2020–2033
- Chile Healthcare Reimbursement Market Outlook, by Service Type, 2020–2033
- Chile Healthcare Reimbursement Market Outlook, by Delivery Model, 2020–2033
- Chile Healthcare Reimbursement Market Outlook, by Payment Model, 2020–2033
- Chile Healthcare Reimbursement Market Outlook, by End User, 2020–2033
- Colombia Healthcare Reimbursement Market Outlook, by Service Type, 2020–2033
- Colombia Healthcare Reimbursement Market Outlook, by Delivery Model, 2020–2033
- Colombia Healthcare Reimbursement Market Outlook, by Payment Model, 2020–2033
- Colombia Healthcare Reimbursement Market Outlook, by End User, 2020–2033
- Latin America Healthcare Reimbursement Market Outlook, by Service Type, Value (US$ Billion), 2020–2033
- Middle East & Africa Healthcare Reimbursement Market Outlook, 2020–2033
- Middle East & Africa Healthcare Reimbursement Market Outlook, by Service Type, Value (US$ Billion), 2020–2033
- Claims Processing and Adjudication
- Coding and Clinical Documentation Services
- Prior Authorization and Utilization Management
- Denials Management and Appeals
- Payment Integrity and Audit Services
- Middle East & Africa Healthcare Reimbursement Market Outlook, by Delivery Model, Value (US$ Billion), 2020–2033
- Outsourced Business Services
- Cloud-Based Software
- On-Premise Software
- Hybrid and Managed Services
- Middle East & Africa Healthcare Reimbursement Market Outlook, by Payment Model, Value (US$ Billion), 2020–2033
- Fee-for-Service
- Diagnosis-Related Group and Case-Based Payment
- Capitation
- Bundled Payments
- Value-Based and Alternative Payment Models
- Middle East & Africa Healthcare Reimbursement Market Outlook, by End User, Value (US$ Billion), 2020–2033
- Hospitals and Health Systems
- Physician Practices and Ambulatory Clinics
- Diagnostic Laboratories and Imaging Centres
- Payers and Insurers
- Long-Term and Post-Acute Care Providers
- Middle East & Africa Healthcare Reimbursement Market Outlook, by Country, Value (US$ Billion), 2020–2033
- United Arab Emirates Healthcare Reimbursement Market Outlook, by Service Type, 2020–2033
- United Arab Emirates Healthcare Reimbursement Market Outlook, by Delivery Model, 2020–2033
- United Arab Emirates Healthcare Reimbursement Market Outlook, by Payment Model, 2020–2033
- United Arab Emirates Healthcare Reimbursement Market Outlook, by End User, 2020–2033
- Saudi Arabia Healthcare Reimbursement Market Outlook, by Service Type, 2020–2033
- Saudi Arabia Healthcare Reimbursement Market Outlook, by Delivery Model, 2020–2033
- Saudi Arabia Healthcare Reimbursement Market Outlook, by Payment Model, 2020–2033
- Saudi Arabia Healthcare Reimbursement Market Outlook, by End User, 2020–2033
- South Africa Healthcare Reimbursement Market Outlook, by Service Type, 2020–2033
- South Africa Healthcare Reimbursement Market Outlook, by Delivery Model, 2020–2033
- South Africa Healthcare Reimbursement Market Outlook, by Payment Model, 2020–2033
- South Africa Healthcare Reimbursement Market Outlook, by End User, 2020–2033
- Egypt Healthcare Reimbursement Market Outlook, by Service Type, 2020–2033
- Egypt Healthcare Reimbursement Market Outlook, by Delivery Model, 2020–2033
- Egypt Healthcare Reimbursement Market Outlook, by Payment Model, 2020–2033
- Egypt Healthcare Reimbursement Market Outlook, by End User, 2020–2033
- Nigeria Healthcare Reimbursement Market Outlook, by Service Type, 2020–2033
- Nigeria Healthcare Reimbursement Market Outlook, by Delivery Model, 2020–2033
- Nigeria Healthcare Reimbursement Market Outlook, by Payment Model, 2020–2033
- Nigeria Healthcare Reimbursement Market Outlook, by End User, 2020–2033
- Kenya Healthcare Reimbursement Market Outlook, by Service Type, 2020–2033
- Kenya Healthcare Reimbursement Market Outlook, by Delivery Model, 2020–2033
- Kenya Healthcare Reimbursement Market Outlook, by Payment Model, 2020–2033
- Kenya Healthcare Reimbursement Market Outlook, by End User, 2020–2033
- Ghana Healthcare Reimbursement Market Outlook, by Service Type, 2020–2033
- Ghana Healthcare Reimbursement Market Outlook, by Delivery Model, 2020–2033
- Ghana Healthcare Reimbursement Market Outlook, by Payment Model, 2020–2033
- Ghana Healthcare Reimbursement Market Outlook, by End User, 2020–2033
- Middle East & Africa Healthcare Reimbursement Market Outlook, by Service Type, Value (US$ Billion), 2020–2033
- Competitive Landscape
- Market Concentration and Industry Leaders
- Competitive Differentiation
- Strategic Moves and Market Direction
- Recent Industry Developments
- Company Profiles
- Optum, Inc.
- R1 RCM Inc.
- Waystar Holding Corp.
- Cotiviti, Inc.
- Ensemble Health Partners
- Conifer Health Solutions, LLC
- Availity, LLC
- Experian Health
- Veradigm Inc.
- athenahealth, Inc.
- Oracle Corporation
- Cognizant Technology Solutions Corporation
- AGS Health
- Omega Healthcare Management Services
- Infinx Inc.
- Appendix
- Research Methodology
- Report Assumptions
- Acronyms and Abbreviations
Service Type
- Claims Processing and Adjudication
- Coding and Clinical Documentation Services
- Prior Authorization and Utilization Management
- Denials Management and Appeals
- Payment Integrity and Audit Services
Delivery Model
- Outsourced Business Services
- Cloud-Based Software
- On-Premise Software
- Hybrid and Managed Services
Payment Model
- Fee-for-Service
- Diagnosis-Related Group and Case-Based Payment
- Capitation
- Bundled Payments
- Value-Based and Alternative Payment Models
End User
- Hospitals and Health Systems
- Physician Practices and Ambulatory Clinics
- Diagnostic Laboratories and Imaging Centres
- Payers and Insurers
- Long-Term and Post-Acute Care Providers
Regions
- North America
- Europe
- Asia Pacific
- Latin America
- Middle East & Africa
Our Research Methodology
Considering the volatility of business today, traditional approaches to strategizing a game plan can be unfruitful if not detrimental. True ambiguity is no way to determine a forecast. A myriad of predetermined factors must be accounted for such as the degree of risk involved, the magnitude of circumstances, as well as conditions or consequences that are not known or unpredictable. To circumvent binary views that cast uncertainty, the application of market research intelligence to strategically posture, move, and enable actionable outcomes is necessary.
View Methodology
Quality Assured
Rigorous Validation Process

Confidentiality Assured
End-to-end Data Security

Custom Research Services
Tailored To Your Objectives
FAQs
The market is valued at US$ 65.0 billion in 2026, measuring reimbursement services, software and revenue cycle operations rather than the healthcare expenditure flowing through them.
The market is projected to reach US$ 135.0 billion by 2033 at an 11.0% CAGR, adding US$ 70.0 billion in absolute dollar opportunity.
Claims Processing and Adjudication leads with 31.0% share in 2026, since every patient encounter generates a claim that must be submitted, adjudicated and reconciled.
Asia Pacific is growing fastest at a 14.5% CAGR to 2033, driven by insurance coverage expansion and the rollout of case-based hospital payment systems.
North America holds 52.0% share in 2026, reflecting multi-payer complexity, detailed coding requirements and the heaviest administrative regulation of any health system.
Related Reports
Varicose Vein Market Size, Share, Insights, Competitive Landscape, and Forecast 2026 to 2033
Explore the varicose vein market outlook for 2026–2033, covering treatments, products, end users, regional trends, and leading companies.
AI in Healthcare Market Size, Share, Insights, Competitive Landscape, and Forecast 2026 to 2033
Explore the AI in healthcare market outlook for 2026–2033, covering components, applications, end users, regional trends, and key companies.
Medical Case Management Market Size, Share, Insights, Competitive Landscape, and Forecast 2026 to 2033
The global medical case management market is valued at US$5.98 billion in 2026, reaching US$9.26 billion by 2033, growing at a 6.4% CAGR
Drug Discovery Informatics Market Size, Share, Insights, Competitive Landscape, and Forecast 2026 to 2033
Drug discovery informatics market is forecast to grow from US$ 3.7 billion in 2026 to US$ 6.9 billion by 2033 at 9.3% CAGR, driven by AI and cloud adoption.
Medical Device Security Market Size, Share, Insights, Competitive Landscape, and Forecast 2026 to 2033
The global medical device security market is valued at US$6.8 billion in 2026, reaching US$12.0 billion by 2033, growing at an 8.4% CAGR
Healthcare IT Integration Market Size, Share, Insights, Competitive Landscape, and Forecast 2026 to 2033
The global healthcare IT integration market is valued at US$4.9 billion in 2026, reaching US$10.6 billion by 2033, growing at an 11.7% CAGR