Industrial Air Compressors Market: Strategic Analysis 2026-2033
Executive Summary & Key Highlights
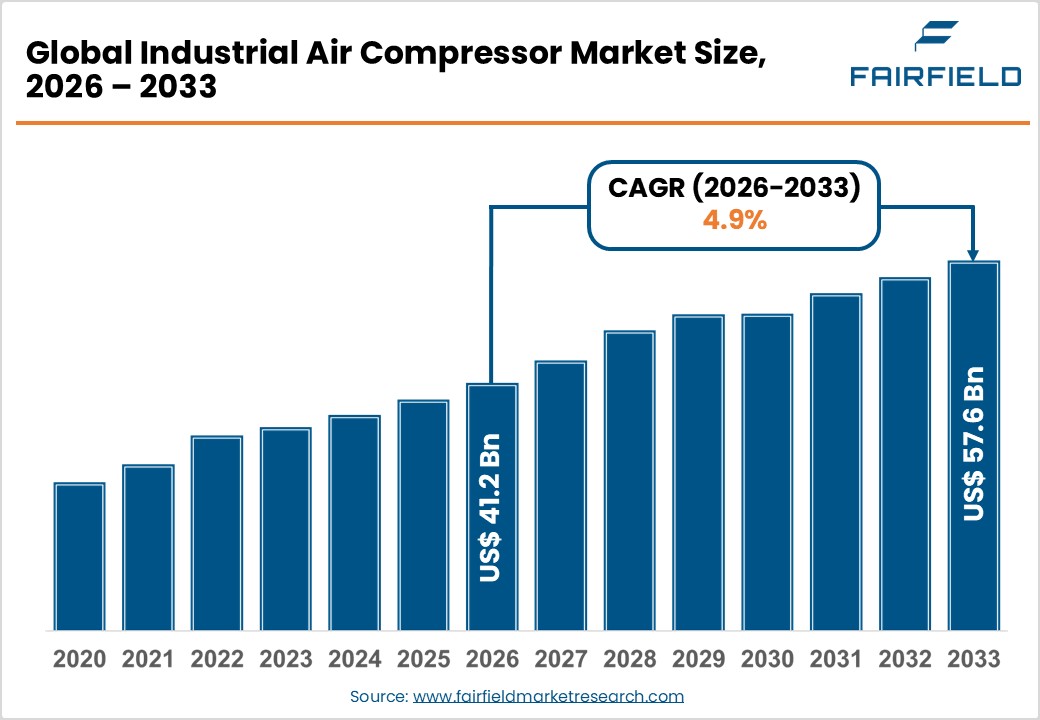
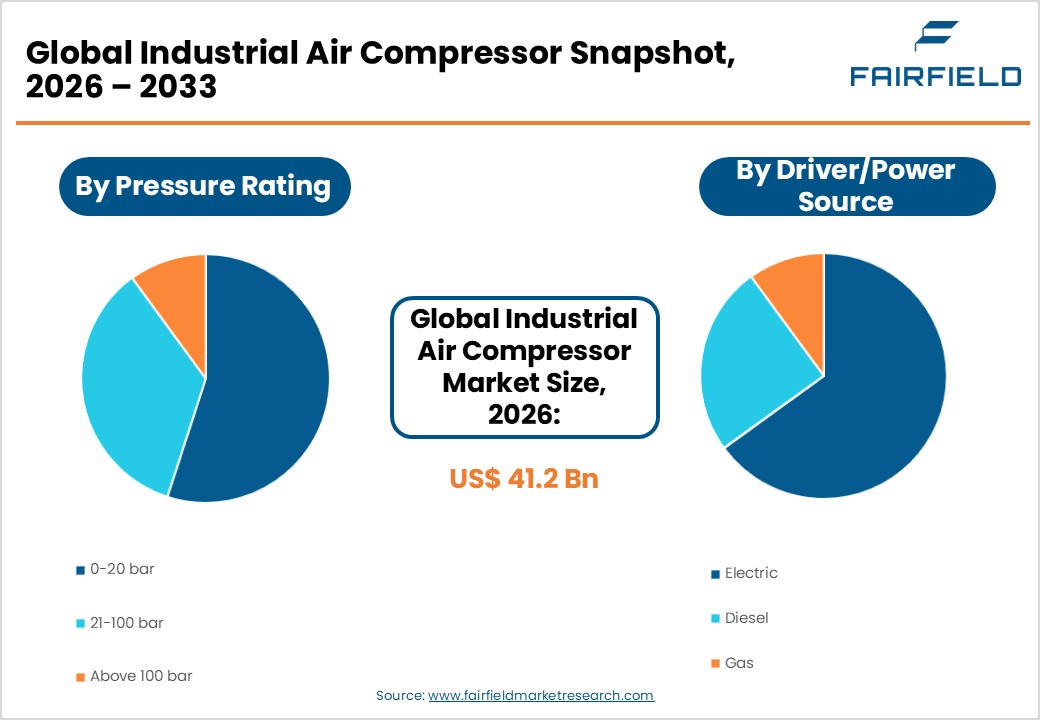
- The global Industrial Air Compressors market size is likely to be valued at US$41.2 billion in 2026 and is expected to reach US$57.6 billion by 2033, growing at a CAGR of 4.90% during the forecast period from 2026 to 2033.
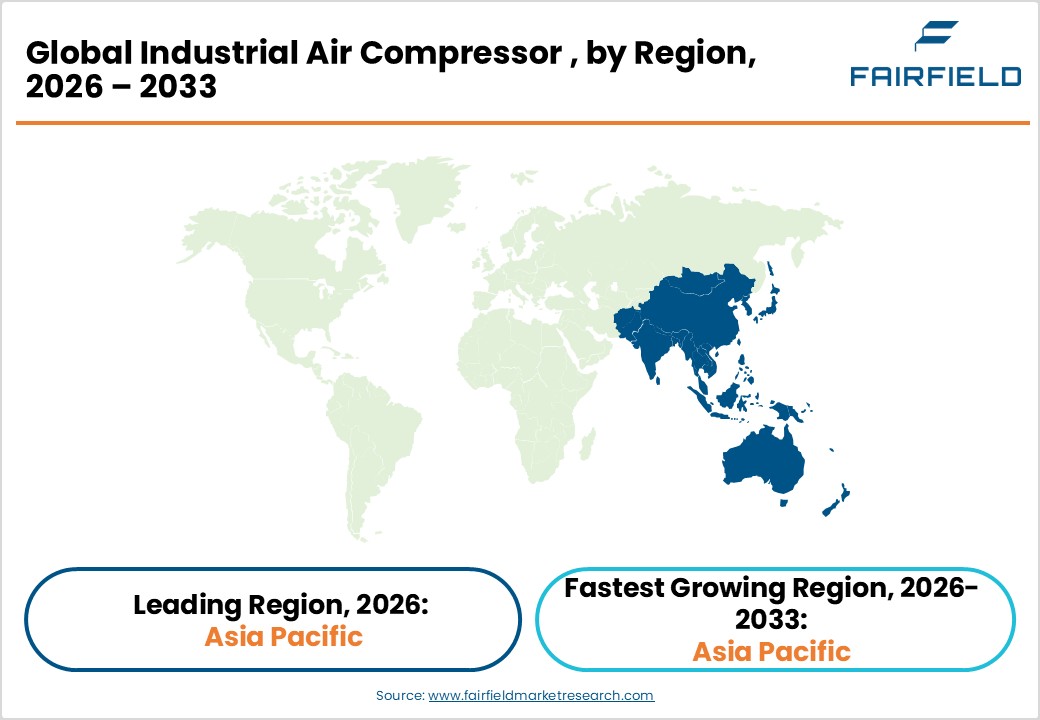
- North America leads the industrial air compressors market, driven by the United States' advanced manufacturing base, significant energy infrastructure investments, and strong regulatory incentives targeting energy-efficient compressed air systems under the DOE's industrial efficiency programs.
- Asia Pacific is the fastest-growing region, with India and ASEAN nations emerging as high-growth hotspots, supported by large-scale government-backed manufacturing investment programs such as India's PLI scheme and rapid industrial infrastructure expansion across Vietnam, Thailand, and Indonesia.
- Rotary Screw compressors within the Positive Displacement category dominate the market with approximately 62% revenue share, favored for energy efficiency, continuous-duty reliability, and wide applicability across automotive, food processing, and general manufacturing industries globally.
- The Oil-Free lubrication segment is the fastest growing category, driven by surging demand from pharmaceutical, semiconductor, and food & beverage industries mandating ISO 8573-1 Class 0 contamination-free air quality standards for their critical production environments.
- Integration of IIoT and predictive maintenance technologies into compressed air management presents a high-growth opportunity, enabling vendors to reduce end-user unplanned downtime by up to 30-40% and transition to high-margin managed service and compressed-air-as-a-service (CAaaS) business models.
Market Dynamics: Drivers, Restraints, and Opportunities Analysis
Market Growth Drivers
- Expanding Manufacturing and Industrial Infrastructure
Global manufacturing activity continues to expand at an accelerating pace, directly driving demand for industrial air compressors across assembly, painting, pneumatic tooling, and material handling operations. According to the International Monetary Fund (IMF), global industrial output growth is projected at approximately 3.3% annually through the late 2020s, propelled by reshoring initiatives in the United States, expansion of automotive manufacturing corridors in India and Southeast Asia, and infrastructure-led growth programs in China. Industrial compressors are integral to nearly every manufacturing sub-sector, from food & beverage processing where oil-free compressors ensure product safety to heavy engineering plants reliant on high-pressure compressed air for CNC machining and robotics. This expanding manufacturing base is creating substantial and sustained demand for a broad range of industrial air compressor technologies.
- Surge in Energy and Process Industries Investment
The oil & gas, petrochemical, and power generation sectors remain among the largest end-users of industrial air compressors, leveraging high-pressure and centrifugal compressor systems for pipeline operations, refinery processes, and turbine instrumentation air supply. The U.S. Energy Information Administration (EIA) estimates that global energy investment surpassed US$ 2.8 trillion in 2023, with upstream oil & gas alone accounting for over US$ 570 billion. Simultaneously, the global transition toward cleaner energy is spurring investment in hydrogen production facilities and liquefied natural gas (LNG) terminals, both of which require advanced compression technology. The International Energy Agency (IEA) has noted that hydrogen compression equipment demand could grow significantly as clean hydrogen projects reach commercial scale by 2030, creating a long-term structural demand driver for the industrial air compressors market.
Market Restraints
- High Initial Capital Expenditure and Total Cost of Ownership
Industrial air compressors, particularly large centrifugal and rotary screw systems, entail significant upfront procurement and installation costs, posing a barrier for small and medium-sized enterprises (SMEs). Beyond the purchase price, operational costs primarily electricity consumption can account for up to 70-80% of the total lifecycle cost of a compressor system, according to assessments by the U.S. Department of Energy (DOE). This elevated cost burden constrains replacement cycles and limits adoption among cost-sensitive buyers in emerging markets. Additionally, compressed air systems are prone to energy losses due to leaks, inadequate system sizing, and poor maintenance practices, further eroding return on investment and discouraging investment in premium, energy-efficient models.
- Stringent Environmental Regulations and Compliance Pressures
Increasingly stringent environmental regulations targeting industrial emissions and energy consumption create compliance complexity for compressor manufacturers and end-users alike. In the European Union, the Ecodesign Regulation mandates minimum energy performance standards for compressors, requiring costly product redesigns. The F-Gas Regulation further impacts compressor-adjacent cooling systems. Similarly, U.S. Environmental Protection Agency (EPA) guidelines on air quality and emissions from diesel-driven compressors restrict usage in urban and environmentally sensitive areas. These regulatory pressures necessitate continuous product investment and may slow adoption rates in regions where compliance infrastructure remains underdeveloped, particularly across parts of Latin America and Sub-Saharan Africa.
Market Opportunities
- Growing Oil-Free Compressor Demand from Pharma, Food, and Electronics Sectors
The accelerating shift toward oil-free compressed air systems presents a high-value opportunity for market participants. Industries including pharmaceuticals, food & beverage, semiconductor fabrication, and medical devices mandate ISO 8573-1 Class 0 air quality a zero contamination tolerance that only oil-free compressors can reliably meet. The World Health Organization (WHO) and U.S. Food and Drug Administration (FDA) guidelines for pharmaceutical manufacturing increasingly require validated air purity, directly propelling oil-free compressor uptake. The global pharmaceutical manufacturing market, valued at over US$ 500 billion, is expanding production capacity in India, China, and Ireland, all emerging as significant compressor demand centers. Companies such as Atlas Copco AB and Ingersoll Rand Inc. have launched dedicated oil-free product lines, signaling robust commercial opportunity in this high-margin segment with strong recurring service revenue potential.
- Smart and IoT-Enabled Compressor Systems for Industry 4.0
The integration of Industrial Internet of Things (IIoT) technologies into compressed air management is creating compelling growth opportunities for manufacturers offering smart, connected compressor solutions. Predictive maintenance platforms enabled by real-time sensor data can reduce unplanned downtime by up to 30-40%, according to industry estimates cited by the International Federation of Robotics (IFR). Demand for compressors with embedded sensors, remote diagnostics, variable speed drive (VSD) capabilities, and energy monitoring dashboards is rising sharply. Kaeser Kompressoren SE and Atlas Copco AB have already deployed cloud-connected compressor management systems. This segment is expected to attract significant R&D investment, enabling vendors to differentiate through software-enabled services and long-term managed service contracts.
Segmentation Analysis: Category-Wise Strategic Assessment
- Compressor Type Analysis
Positive Displacement compressors dominate the industrial air compressors market, accounting for approximately 62% of total market revenue. Within this category, Rotary Screw compressors hold the commanding position, favored for their continuous-duty capability, compact footprint, energy efficiency, and lower maintenance burden compared to reciprocating alternatives. According to the Compressed Air and Gas Institute (CAGI), rotary screw compressors are preferred across food processing, automotive assembly, and general manufacturing due to their ability to deliver consistent airflow at variable pressures. The proliferation of Variable Speed Drive (VSD)-equipped rotary screw models has further reinforced segment leadership by enabling energy savings of 20-30% versus fixed-speed equivalents, making them the default specification in greenfield industrial projects worldwide.
- Lubrication Analysis
The Oil-Flooded segment leads the lubrication category, holding approximately 65% market share. Oil-flooded compressors benefit from lower initial capital costs, higher operational reliability in demanding environments, and effective heat dissipation through the lubricant-enabling sustained performance in continuous-duty industrial applications. These attributes have entrenched their adoption across heavy industries including mining, construction, and general manufacturing. However, the Oil-Free segment is gaining market share rapidly, particularly in pharmaceutical, semiconductor, and food-grade applications where air purity is non-negotiable. According to the European Compressed Air Society (PNEUROP), oil-free installations have grown at a disproportionately higher rate within cleanroom and sensitive process environments, signaling a meaningful structural shift in demand patterns over the forecast period.
- Pressure Rating Analysis
The 21-100 bar pressure rating segment holds the leading position in the industrial air compressors market, representing approximately 55% of total demand. This range encompasses the most common industrial operating requirements-covering pneumatic conveying, instrumentation air supply, process air for refineries, and industrial automation. The prevalence of rotary screw and reciprocating compressors within this range, combined with their versatility across multiple industries, underpins segment dominance. The Above 100 bar segment, though smaller in volume, commands premium pricing and is growing steadily, driven by demand from oil & gas well drilling, PET bottle manufacturing, and specialized military and aerospace applications, where Bauer AG and Ingersoll Rand Inc. maintain dedicated product offerings.
- Driver/Power Source Analysis
Electric-driven compressors dominate the power source category, accounting for approximately 72% of market share. Electric compressors offer superior energy efficiency, lower emissions, reduced operational noise levels, and compatibility with VSD technologies compared to diesel or gas alternatives. The global push toward decarbonization and industrial electrification under frameworks such as the European Green Deal and the U.S. Inflation Reduction Act (IRA) is accelerating the transition toward electric compressors. While diesel-driven compressors retain strong demand in remote construction, mining, and military applications where grid access is limited, the long-term trajectory clearly favors electric-driven systems. Siemens AG and General Electric Company have positioned electric motor and drive technologies as core enablers of efficient compressed air systems.
- Power Rating Analysis
The ≤100 kW power rating segment commands the largest market share at approximately 58%, driven by widespread adoption across light manufacturing, automotive workshops, food processing, and SME-scale industrial operations. Compressors in this power class offer lower capital outlay, ease of installation, and compatibility with standard facility power infrastructure. The broad end-user base ranging from small fabrication shops to large distributed manufacturing facilities utilizing multiple decentralized units supports segment dominance. The 101-500 kW segment is the fastest-growing, driven by mid-to-large scale industrial plant expansions in India, Vietnam, and Mexico, where brownfield capacity additions require mid-range compressor solutions capable of servicing multiple production lines simultaneously.
Regional Market Assessment: Strategic Geography Analysis
- North America Industrial Air Compressors Trends
North America holds a leading position in the global industrial air compressors market, underpinned by its advanced manufacturing base, significant energy sector activities, and a mature regulatory environment that prioritizes energy efficiency. The U.S. is the regional anchor, with the U.S. Department of Energy (DOE) identifying compressed air systems as accounting for approximately 10% of all industrial electricity consumption a statistic that has prompted concerted policy focus on system optimization and efficiency upgrades through the DOE's Advanced Manufacturing Office.
The U.S. Inflation Reduction Act (IRA) of 2022 has catalyzed new investments in semiconductor, battery, and clean energy manufacturing facilities, all significant compressed air consumers. Canada's growing LNG and hydrogen export ambitions further support demand for specialized high-pressure compressor systems. The region's well-developed aftermarket and service infrastructure supports equipment lifecycle extension, while compressor OEMs continue investing in IIoT-enabled diagnostics platforms tailored to North American industrial maintenance standards.
- Europe Industrial Air Compressors Trends
Europe represents a mature but innovation-driven market for industrial air compressors, with Germany, France, and the United Kingdom as the dominant national markets. Germany, as Europe's largest industrial economy, maintains significant compressor demand through its automotive, mechanical engineering, and chemical sectors. The Verband Deutscher Maschinen- und Anlagenbau (VDMA), Germany's machinery association, has consistently highlighted compressed air efficiency as a priority in industrial sustainability roadmaps, driving fleet modernization programs across its membership base.
The European Union's Ecodesign Regulation and the European Green Deal are reshaping procurement criteria, with mandatory minimum energy efficiency standards now applying to compressors above 0.37 kW. This regulatory trajectory is accelerating replacements of older, inefficient equipment with modern variable-speed models. Spain and France are emerging growth pockets, driven by aerospace manufacturing and pharmaceutical investments respectively. Kaeser Kompressoren SE, headquartered in Germany, remains a regional market leader leveraging strong engineering heritage.
- Asia Pacific Industrial Air Compressors Trends
Asia Pacific is the fastest-growing regional market for industrial air compressors, propelled by China's manufacturing dominance, India's industrial policy ambitions, and ASEAN's expanding export-oriented production ecosystem. China remains the world's largest single market, supported by its manufacturing base spanning electronics, automotive, chemicals, and construction. The country's "Made in China 2025" and subsequent modernization strategies continue to drive demand for advanced, energy-efficient compressor systems across thousands of industrial facilities.
India is emerging as a high-growth market, with the government's Production-Linked Incentive (PLI) scheme attracting over US$ 26 billion in pledged manufacturing investments across 14 key sectors as of 2025, each representing significant compressed air demand. Japan drives demand in high-precision electronics and robotics manufacturing, where oil-free compressors are integral. Elgi Equipments Limited, headquartered in India, has been expanding aggressively across global markets, leveraging cost-competitive manufacturing advantages. ASEAN nations including Vietnam, Thailand, and Indonesia are witnessing rapid factory construction, adding substantial mid-range compressor demand to the regional growth outlook.
Competitive Landscape: Market Structure and Strategic Positioning
The global industrial air compressors market is moderately consolidated, with a handful of multinational players led by Atlas Copco AB, Ingersoll Rand Inc., Kaeser Kompressoren SE, and Gardner Denver Holdings, Inc. collectively commanding a substantial share of the premium and mid-range segments. These leaders differentiate through comprehensive product portfolios, robust global service networks, and increasing software integration via IIoT-enabled monitoring platforms. Regional players such as Elgi Equipments Limited and Doosan Bobcat Inc. compete aggressively on price-performance metrics. Key strategic trends include targeted acquisitions to expand technology portfolios, accelerated investment in oil-free product lines, and the launch of compressed-air-as-a-service (CAaaS) subscription models, enabling industrial customers to reduce capital expenditure while securing long-term vendor relationships.
Key Players
- Atlas Copco AB
- Ingersoll Rand Inc.
- Hitachi, Ltd.
- Kaeser Kompressoren SE
- Gardner Denver Holdings, Inc.
- Bauer AG
- Danfoss A/S
- Doosan Bobcat Inc.
- General Electric Company
- Dover Corporation
- Mitsubishi Heavy Industries, Ltd.
- IDEX Corporation
- Siemens AG
- Ebara Corporation
- Elgi Equipments Limited
- Sullair LLC (a Hitachi Group Company)
- CompAir (Gardner Denver)
- Aerzen Maschinenfabrik GmbH
- BOGE Kompressoren GmbH & Co. KG
- Mann+Hummel GmbH (filtration systems for compressors)
Key Industry Developments
- February 2025: Kaeser Kompressoren SE announced the expansion of its manufacturing facility in Coburg, Germany, committing approximately €50 million to increase production capacity for VSD-enabled rotary screw compressors to meet growing European and export market demand.
- November 2024: Ingersoll Rand Inc. acquired Air Dimensions Incorporated, a U.S.-based specialist in oil-free diaphragm pumps and compressors, strengthening its presence in the laboratory and analytical instrumentation compressed air segment.
- March 2024: Atlas Copco AB launched its next-generation ZR/ZT 37–90 VSD+ oil-free rotary screw compressors, claiming up to 15% energy savings versus prior-generation models, with a primary focus on pharmaceutical and food & beverage customers globally.
Global Industrial Air Compressors Market Segmentation
By Compressor Type
- Positive Displacement
- Rotary Screw
- Reciprocating (Piston)
- Scroll
- Dynamic
- Centrifugal
- Axial
By Lubrication
- Oil-Flooded
- Oil-Free
By Pressure Rating
- 0-20 bar
- 21-100 bar
- Above 100 bar
By Driver/Power Source
- Electric
- Diesel
- Gas
By Power Rating
- 1 ≤100 kW
- 101-500 kW
- >500 kW
By End-use Industry
- Manufacturing
- General Manufacturing
- Metal & Mining
- Electronics & Semiconductors
- Oil and Gas
- Upstream
- Midstream (Pipeline/LNG)
- Downstream (Refining)
- Power Generation
- Chemical and Petrochemical
- Food and Beverage
- Pharmaceutical
- Construction
- Others (Healthcare, Textiles)
By Region
- North America
- Europe
- Asia Pacific
- Latin America
- Middle East & Africa
- Executive Summary
- Global Industrial Air Compressors Snapshot
- Future Projections
- Key Market Trends
- Regional Snapshot, by Value, 2026
- Analyst Recommendations
- Market Overview
- Market Definitions and Segmentations
- Market Dynamics
- Drivers
- Restraints
- Market Opportunities
- Value Chain Analysis
- COVID-19 Impact Analysis
- Porter's Five Forces Analysis
- Impact of Russia-Ukraine Conflict
- PESTLE Analysis
- Regulatory Analysis
- Price Trend Analysis
- Current Prices and Future Projections, 2025-2033
- Price Impact Factors
- Global Industrial Air Compressors Outlook, 2020 - 2033
- Global Industrial Air Compressors Outlook, by Pressure Rating, Value (US$ Bn), 2020-2033
- 0-20 bar
- 21-100 bar
- Above 100 bar
- Global Industrial Air Compressors Outlook, by Driver/Power Source, Value (US$ Bn), 2020-2033
- Electric
- Diesel
- Gas
- Global Industrial Air Compressors Outlook, by Compressor Type, Value (US$ Bn), 2020-2033
- Positive Displacement
- Dynamic
- Global Industrial Air Compressors Outlook, by Lubrication, Value (US$ Bn), 2020-2033
- Oil-Flooded
- Oil-Free
- Global Industrial Air Compressors Outlook, by Power Rating, Value (US$ Bn), 2020-2033
- 1 ≤100 kW
- 101-500 kW
- >500 kW
- Global Industrial Air Compressors Outlook, by Region, Value (US$ Bn), 2020-2033
- North America
- Europe
- Asia Pacific
- Latin America
- Middle East & Africa
- Global Industrial Air Compressors Outlook, by Pressure Rating, Value (US$ Bn), 2020-2033
- North America Industrial Air Compressors Outlook, 2020 - 2033
- North America Industrial Air Compressors Outlook, by Pressure Rating, Value (US$ Bn), 2020-2033
- 0-20 bar
- 21-100 bar
- Above 100 bar
- North America Industrial Air Compressors Outlook, by Driver/Power Source, Value (US$ Bn), 2020-2033
- Electric
- Diesel
- Gas
- North America Industrial Air Compressors Outlook, by Compressor Type, Value (US$ Bn), 2020-2033
- Positive Displacement
- Dynamic
- North America Industrial Air Compressors Outlook, by Lubrication, Value (US$ Bn), 2020-2033
- Oil-Flooded
- Oil-Free
- North America Industrial Air Compressors Outlook, by Power Rating, Value (US$ Bn), 2020-2033
- 1 ≤100 kW
- 101-500 kW
- >500 kW
- North America Industrial Air Compressors Outlook, by Country, Value (US$ Bn), 2020-2033
- U.S. Industrial Air Compressors Outlook, by Pressure Rating, 2020-2033
- U.S. Industrial Air Compressors Outlook, by Driver/Power Source, 2020-2033
- U.S. Industrial Air Compressors Outlook, by Compressor Type, 2020-2033
- U.S. Industrial Air Compressors Outlook, by Lubrication, 2020-2033
- U.S. Industrial Air Compressors Outlook, by Power Rating, 2020-2033
- Canada Industrial Air Compressors Outlook, by Pressure Rating, 2020-2033
- Canada Industrial Air Compressors Outlook, by Driver/Power Source, 2020-2033
- Canada Industrial Air Compressors Outlook, by Compressor Type, 2020-2033
- Canada Industrial Air Compressors Outlook, by Lubrication, 2020-2033
- Canada Industrial Air Compressors Outlook, by Power Rating, 2020-2033
- BPS Analysis/Market Attractiveness Analysis
- North America Industrial Air Compressors Outlook, by Pressure Rating, Value (US$ Bn), 2020-2033
- Europe Industrial Air Compressors Outlook, 2020 - 2033
- Europe Industrial Air Compressors Outlook, by Pressure Rating, Value (US$ Bn), 2020-2033
- 0-20 bar
- 21-100 bar
- Above 100 bar
- Europe Industrial Air Compressors Outlook, by Driver/Power Source, Value (US$ Bn), 2020-2033
- Electric
- Diesel
- Gas
- Europe Industrial Air Compressors Outlook, by Compressor Type, Value (US$ Bn), 2020-2033
- Positive Displacement
- Dynamic
- Europe Industrial Air Compressors Outlook, by Lubrication, Value (US$ Bn), 2020-2033
- Oil-Flooded
- Oil-Free
- Europe Industrial Air Compressors Outlook, by Power Rating, Value (US$ Bn), 2020-2033
- 1 ≤100 kW
- 101-500 kW
- >500 kW
- Europe Industrial Air Compressors Outlook, by Country, Value (US$ Bn), 2020-2033
- Germany Industrial Air Compressors Outlook, by Pressure Rating, 2020-2033
- Germany Industrial Air Compressors Outlook, by Driver/Power Source, 2020-2033
- Germany Industrial Air Compressors Outlook, by Compressor Type, 2020-2033
- Germany Industrial Air Compressors Outlook, by Lubrication, 2020-2033
- Germany Industrial Air Compressors Outlook, by Power Rating, 2020-2033
- Italy Industrial Air Compressors Outlook, by Pressure Rating, 2020-2033
- Italy Industrial Air Compressors Outlook, by Driver/Power Source, 2020-2033
- Italy Industrial Air Compressors Outlook, by Compressor Type, 2020-2033
- Italy Industrial Air Compressors Outlook, by Lubrication, 2020-2033
- Italy Industrial Air Compressors Outlook, by Power Rating, 2020-2033
- France Industrial Air Compressors Outlook, by Pressure Rating, 2020-2033
- France Industrial Air Compressors Outlook, by Driver/Power Source, 2020-2033
- France Industrial Air Compressors Outlook, by Compressor Type, 2020-2033
- France Industrial Air Compressors Outlook, by Lubrication, 2020-2033
- France Industrial Air Compressors Outlook, by Power Rating, 2020-2033
- U.K. Industrial Air Compressors Outlook, by Pressure Rating, 2020-2033
- U.K. Industrial Air Compressors Outlook, by Driver/Power Source, 2020-2033
- U.K. Industrial Air Compressors Outlook, by Compressor Type, 2020-2033
- U.K. Industrial Air Compressors Outlook, by Lubrication, 2020-2033
- U.K. Industrial Air Compressors Outlook, by Power Rating, 2020-2033
- Spain Industrial Air Compressors Outlook, by Pressure Rating, 2020-2033
- Spain Industrial Air Compressors Outlook, by Driver/Power Source, 2020-2033
- Spain Industrial Air Compressors Outlook, by Compressor Type, 2020-2033
- Spain Industrial Air Compressors Outlook, by Lubrication, 2020-2033
- Spain Industrial Air Compressors Outlook, by Power Rating, 2020-2033
- Russia Industrial Air Compressors Outlook, by Pressure Rating, 2020-2033
- Russia Industrial Air Compressors Outlook, by Driver/Power Source, 2020-2033
- Russia Industrial Air Compressors Outlook, by Compressor Type, 2020-2033
- Russia Industrial Air Compressors Outlook, by Lubrication, 2020-2033
- Russia Industrial Air Compressors Outlook, by Power Rating, 2020-2033
- Rest of Europe Industrial Air Compressors Outlook, by Pressure Rating, 2020-2033
- Rest of Europe Industrial Air Compressors Outlook, by Driver/Power Source, 2020-2033
- Rest of Europe Industrial Air Compressors Outlook, by Compressor Type, 2020-2033
- Rest of Europe Industrial Air Compressors Outlook, by Lubrication, 2020-2033
- Rest of Europe Industrial Air Compressors Outlook, by Power Rating, 2020-2033
- BPS Analysis/Market Attractiveness Analysis
- Europe Industrial Air Compressors Outlook, by Pressure Rating, Value (US$ Bn), 2020-2033
- Asia Pacific Industrial Air Compressors Outlook, 2020 - 2033
- Asia Pacific Industrial Air Compressors Outlook, by Pressure Rating, Value (US$ Bn), 2020-2033
- 0-20 bar
- 21-100 bar
- Above 100 bar
- Asia Pacific Industrial Air Compressors Outlook, by Driver/Power Source, Value (US$ Bn), 2020-2033
- Electric
- Diesel
- Gas
- Asia Pacific Industrial Air Compressors Outlook, by Compressor Type, Value (US$ Bn), 2020-2033
- Positive Displacement
- Dynamic
- Asia Pacific Industrial Air Compressors Outlook, by Lubrication, Value (US$ Bn), 2020-2033
- Oil-Flooded
- Oil-Free
- Asia Pacific Industrial Air Compressors Outlook, by Power Rating, Value (US$ Bn), 2020-2033
- 1 ≤100 kW
- 101-500 kW
- >500 kW
- Asia Pacific Industrial Air Compressors Outlook, by Country, Value (US$ Bn), 2020-2033
- China Industrial Air Compressors Outlook, by Pressure Rating, 2020-2033
- China Industrial Air Compressors Outlook, by Driver/Power Source, 2020-2033
- China Industrial Air Compressors Outlook, by Compressor Type, 2020-2033
- China Industrial Air Compressors Outlook, by Lubrication, 2020-2033
- China Industrial Air Compressors Outlook, by Power Rating, 2020-2033
- Japan Industrial Air Compressors Outlook, by Pressure Rating, 2020-2033
- Japan Industrial Air Compressors Outlook, by Driver/Power Source, 2020-2033
- Japan Industrial Air Compressors Outlook, by Compressor Type, 2020-2033
- Japan Industrial Air Compressors Outlook, by Lubrication, 2020-2033
- Japan Industrial Air Compressors Outlook, by Power Rating, 2020-2033
- South Korea Industrial Air Compressors Outlook, by Pressure Rating, 2020-2033
- South Korea Industrial Air Compressors Outlook, by Driver/Power Source, 2020-2033
- South Korea Industrial Air Compressors Outlook, by Compressor Type, 2020-2033
- South Korea Industrial Air Compressors Outlook, by Lubrication, 2020-2033
- South Korea Industrial Air Compressors Outlook, by Power Rating, 2020-2033
- India Industrial Air Compressors Outlook, by Pressure Rating, 2020-2033
- India Industrial Air Compressors Outlook, by Driver/Power Source, 2020-2033
- India Industrial Air Compressors Outlook, by Compressor Type, 2020-2033
- India Industrial Air Compressors Outlook, by Lubrication, 2020-2033
- India Industrial Air Compressors Outlook, by Power Rating, 2020-2033
- Southeast Asia Industrial Air Compressors Outlook, by Pressure Rating, 2020-2033
- Southeast Asia Industrial Air Compressors Outlook, by Driver/Power Source, 2020-2033
- Southeast Asia Industrial Air Compressors Outlook, by Compressor Type, 2020-2033
- Southeast Asia Industrial Air Compressors Outlook, by Lubrication, 2020-2033
- Southeast Asia Industrial Air Compressors Outlook, by Power Rating, 2020-2033
- Rest of SAO Industrial Air Compressors Outlook, by Pressure Rating, 2020-2033
- Rest of SAO Industrial Air Compressors Outlook, by Driver/Power Source, 2020-2033
- Rest of SAO Industrial Air Compressors Outlook, by Compressor Type, 2020-2033
- Rest of SAO Industrial Air Compressors Outlook, by Lubrication, 2020-2033
- Rest of SAO Industrial Air Compressors Outlook, by Power Rating, 2020-2033
- BPS Analysis/Market Attractiveness Analysis
- Asia Pacific Industrial Air Compressors Outlook, by Pressure Rating, Value (US$ Bn), 2020-2033
- Latin America Industrial Air Compressors Outlook, 2020 - 2033
- Latin America Industrial Air Compressors Outlook, by Pressure Rating, Value (US$ Bn), 2020-2033
- 0-20 bar
- 21-100 bar
- Above 100 bar
- Latin America Industrial Air Compressors Outlook, by Driver/Power Source, Value (US$ Bn), 2020-2033
- Electric
- Diesel
- Gas
- Latin America Industrial Air Compressors Outlook, by Compressor Type, Value (US$ Bn), 2020-2033
- Positive Displacement
- Dynamic
- Latin America Industrial Air Compressors Outlook, by Lubrication, Value (US$ Bn), 2020-2033
- Oil-Flooded
- Oil-Free
- Latin America Industrial Air Compressors Outlook, by Power Rating, Value (US$ Bn), 2020-2033
- 1 ≤100 kW
- 101-500 kW
- >500 kW
- Latin America Industrial Air Compressors Outlook, by Country, Value (US$ Bn), 2020-2033
- Brazil Industrial Air Compressors Outlook, by Pressure Rating, 2020-2033
- Brazil Industrial Air Compressors Outlook, by Driver/Power Source, 2020-2033
- Brazil Industrial Air Compressors Outlook, by Compressor Type, 2020-2033
- Brazil Industrial Air Compressors Outlook, by Lubrication, 2020-2033
- Brazil Industrial Air Compressors Outlook, by Power Rating, 2020-2033
- Mexico Industrial Air Compressors Outlook, by Pressure Rating, 2020-2033
- Mexico Industrial Air Compressors Outlook, by Driver/Power Source, 2020-2033
- Mexico Industrial Air Compressors Outlook, by Compressor Type, 2020-2033
- Mexico Industrial Air Compressors Outlook, by Lubrication, 2020-2033
- Mexico Industrial Air Compressors Outlook, by Power Rating, 2020-2033
- Argentina Industrial Air Compressors Outlook, by Pressure Rating, 2020-2033
- Argentina Industrial Air Compressors Outlook, by Driver/Power Source, 2020-2033
- Argentina Industrial Air Compressors Outlook, by Compressor Type, 2020-2033
- Argentina Industrial Air Compressors Outlook, by Lubrication, 2020-2033
- Argentina Industrial Air Compressors Outlook, by Power Rating, 2020-2033
- Rest of LATAM Industrial Air Compressors Outlook, by Pressure Rating, 2020-2033
- Rest of LATAM Industrial Air Compressors Outlook, by Driver/Power Source, 2020-2033
- Rest of LATAM Industrial Air Compressors Outlook, by Compressor Type, 2020-2033
- Rest of LATAM Industrial Air Compressors Outlook, by Lubrication, 2020-2033
- Rest of LATAM Industrial Air Compressors Outlook, by Power Rating, 2020-2033
- BPS Analysis/Market Attractiveness Analysis
- Latin America Industrial Air Compressors Outlook, by Pressure Rating, Value (US$ Bn), 2020-2033
- Middle East & Africa Industrial Air Compressors Outlook, 2020 - 2033
- Middle East & Africa Industrial Air Compressors Outlook, by Pressure Rating, Value (US$ Bn), 2020-2033
- 0-20 bar
- 21-100 bar
- Above 100 bar
- Middle East & Africa Industrial Air Compressors Outlook, by Driver/Power Source, Value (US$ Bn), 2020-2033
- Electric
- Diesel
- Gas
- Middle East & Africa Industrial Air Compressors Outlook, by Compressor Type, Value (US$ Bn), 2020-2033
- Positive Displacement
- Dynamic
- Middle East & Africa Industrial Air Compressors Outlook, by Lubrication, Value (US$ Bn), 2020-2033
- Oil-Flooded
- Oil-Free
- Middle East & Africa Industrial Air Compressors Outlook, by Power Rating, Value (US$ Bn), 2020-2033
- 1 ≤100 kW
- 101-500 kW
- >500 kW
- Middle East & Africa Industrial Air Compressors Outlook, by Country, Value (US$ Bn), 2020-2033
- GCC Industrial Air Compressors Outlook, by Pressure Rating, 2020-2033
- GCC Industrial Air Compressors Outlook, by Driver/Power Source, 2020-2033
- GCC Industrial Air Compressors Outlook, by Compressor Type, 2020-2033
- GCC Industrial Air Compressors Outlook, by Lubrication, 2020-2033
- GCC Industrial Air Compressors Outlook, by Power Rating, 2020-2033
- South Africa Industrial Air Compressors Outlook, by Pressure Rating, 2020-2033
- South Africa Industrial Air Compressors Outlook, by Driver/Power Source, 2020-2033
- South Africa Industrial Air Compressors Outlook, by Compressor Type, 2020-2033
- South Africa Industrial Air Compressors Outlook, by Lubrication, 2020-2033
- South Africa Industrial Air Compressors Outlook, by Power Rating, 2020-2033
- Egypt Industrial Air Compressors Outlook, by Pressure Rating, 2020-2033
- Egypt Industrial Air Compressors Outlook, by Driver/Power Source, 2020-2033
- Egypt Industrial Air Compressors Outlook, by Compressor Type, 2020-2033
- Egypt Industrial Air Compressors Outlook, by Lubrication, 2020-2033
- Egypt Industrial Air Compressors Outlook, by Power Rating, 2020-2033
- Nigeria Industrial Air Compressors Outlook, by Pressure Rating, 2020-2033
- Nigeria Industrial Air Compressors Outlook, by Driver/Power Source, 2020-2033
- Nigeria Industrial Air Compressors Outlook, by Compressor Type, 2020-2033
- Nigeria Industrial Air Compressors Outlook, by Lubrication, 2020-2033
- Nigeria Industrial Air Compressors Outlook, by Power Rating, 2020-2033
- Rest of Middle East Industrial Air Compressors Outlook, by Pressure Rating, 2020-2033
- Rest of Middle East Industrial Air Compressors Outlook, by Driver/Power Source, 2020-2033
- Rest of Middle East Industrial Air Compressors Outlook, by Compressor Type, 2020-2033
- Rest of Middle East Industrial Air Compressors Outlook, by Lubrication, 2020-2033
- Rest of Middle East Industrial Air Compressors Outlook, by Power Rating, 2020-2033
- BPS Analysis/Market Attractiveness Analysis
- Middle East & Africa Industrial Air Compressors Outlook, by Pressure Rating, Value (US$ Bn), 2020-2033
- Competitive Landscape
- Company Vs Segment Heatmap
- Company Market Share Analysis, 2025
- Competitive Dashboard
- Company Profiles
- Atlas Copco AB
- Company Overview
- Product Portfolio
- Financial Overview
- Business Strategies and Developments
- Ingersoll Rand Inc.
- Hitachi, Ltd.
- Kaeser Kompressoren SE
- Gardner Denver Holdings, Inc.
- Bauer AG
- Danfoss A/S
- Doosan Bobcat Inc.
- General Electric Company
- Dover Corporation
- Mitsubishi Heavy Industries, Ltd.
- IDEX Corporation
- Siemens AG
- Ebara Corporation
- Elgi Equipments Limited
- Atlas Copco AB
- Appendix
- Research Methodology
- Report Assumptions
- Acronyms and Abbreviations
|
BASE YEAR |
HISTORICAL DATA |
FORECAST PERIOD |
UNITS |
|||
|
2025 |
|
2020 - 2025 |
2026 - 2033 |
Value: US$ Billion |
||
|
REPORT FEATURES |
DETAILS |
|
By Pressure Rating Coverage |
|
|
By Driver/Power Source Coverage |
|
|
Geographical Coverage |
|
|
Leading Companies |
|
|
Report Highlights |
Key Market Indicators, Macro-micro economic impact analysis, Technological Roadmap, Key Trends, Driver, Restraints, and Future Opportunities & Revenue Pockets, Porter’s 5 Forces Analysis, Historical Trend (2019-2024), Market Estimates and Forecast, Market Dynamics, Industry Trends, Competition Landscape, Category, Region, Country-wise Trends & Analysis, COVID-19 Impact Analysis (Demand and Supply Chain) |