



Optical I/O for AI Chips Market
Optical I/O for AI Chips Market Size, Share, Insights, Competitive Landscape, and Forecast 2026 to 2033
Optical I/O for AI Chips Market Size and Trend Analysis
What Is Driving Optical I/O Demand for AI Accelerators?
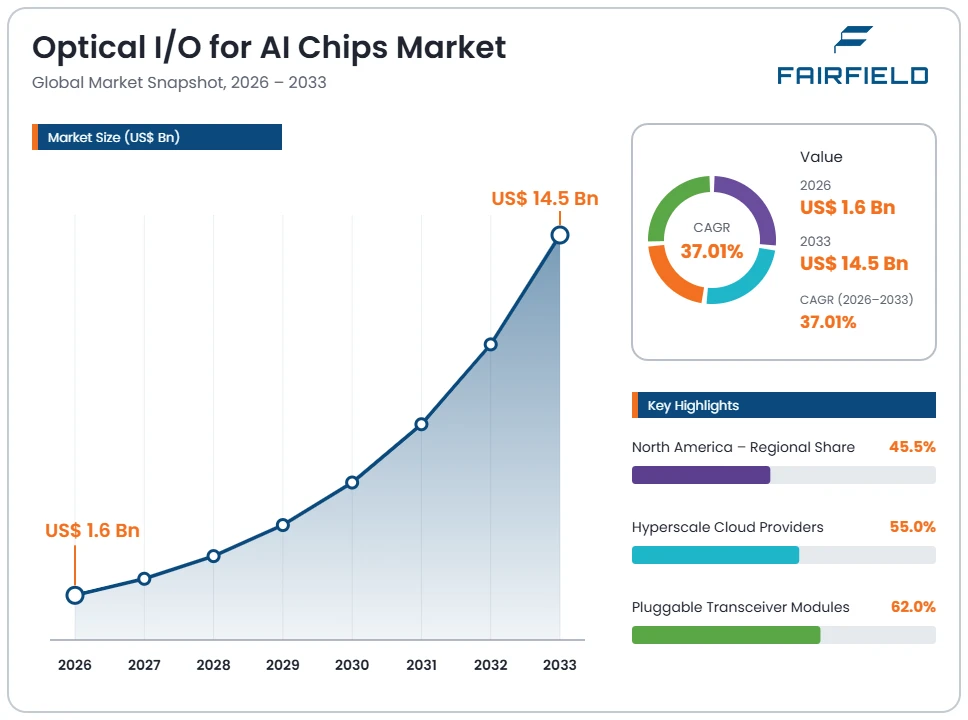
The global Optical I/O for AI Chips market size is expected to be valued at US$ 1.6 billion in 2026 and projected to reach US$ 14.5 billion by 2033, growing at a CAGR of 37.01% between 2026 and 2033.
Between 2020 and 2025 this category expanded at an estimated 34.0% CAGR, tracking the build-out of large accelerator clusters. Three forces sustain the forecast. Electrical reach is running out: at 224 Gb/s per lane, copper carries signals only a short distance, so optics must move toward the package. Data centre power budgets are capped, which rewards interconnect measured in picojoules per bit. Cluster sizes keep rising, and every added accelerator multiplies the optical ports in the fabric. The direction of travel is clear, but the pace depends on solving thermal, laser reliability and serviceability problems rather than on demand.
Key Report Takeaways
- By Technology: Pluggable Optical Transceiver Modules held 62.0% share in 2026, while Co-Packaged Optics is projected to expand at a 52.0% CAGR through 2033, as switch and accelerator vendors integrate optical engines onto the same substrate.
- By Data Rate: 800 Gb/s held 44.0% share in 2026, while 1.6 Tb/s is projected to expand at a 49.0% CAGR through 2033, following the IEEE 802.3 work defining the next Ethernet rate and matching 224 Gb/s electrical lanes.
- By Application: AI Training Scale-Out Fabric held 47.0% share in 2026, while Scale-Up Accelerator Interconnect is projected to expand at a 48.5% CAGR through 2033, as coherent memory domains outgrow copper backplane reach.
- By End User: Hyperscale Cloud Providers held 55.0% share in 2026, while Colocation and Neocloud Operators are projected to expand at a 44.0% CAGR through 2033, reflecting the rapid build of dedicated accelerator hosting capacity.
- By Region: North America held 45.5% share in 2026, while Asia Pacific is projected to expand at a 40.5% CAGR through 2033, supported by optical module manufacturing in China and packaging capacity in Taiwan.
Global Optical I/O for AI Chips Market Trends and Insights
Drivers Impact Analysis
Two physical limits, not commercial preference, are pushing optical interconnect toward the accelerator package.
| Driver | Impact on CAGR Forecast | Geographic Relevance | Impact Timeline |
| Collapsing copper reach at 224 Gb/s per lane signalling rates | High | North America, Asia Pacific | Medium term (2–4 years) |
| Data centre power ceilings rewarding lower energy per transmitted bit | High | Global | Long term (≥4 years) |
Shrinking Copper Reach at 224 Gb/s Forces Optics Toward the Accelerator Package
Electrical signalling limits are the primary demand driver. Each doubling of lane rate roughly halves the distance copper can carry a signal at acceptable error rates. At the 224 Gb/s per-lane rates defined in Optical Internetworking Forum common electrical interface work, usable reach over a printed circuit board and connector shrinks to a few tens of centimetres. That no longer spans a chassis, so the conversion point must move closer to the die.
The mechanism is a chain of engineering consequences. Longer electrical channels require stronger equalisation and retiming, which consumes power and adds latency. Shortening the electrical path by placing an optical engine beside or on the package removes those retimers entirely. Standards work including IEEE 802.3 Ethernet rate projects and chiplet interfaces defined under the Universal Chiplet Interconnect Express specification is converging on exactly this partitioning.
Facility Power Ceilings Make Energy Per Bit a Procurement Criterion
Power constraints are the second driver, and they now shape purchasing directly. Accelerator halls are limited by available grid capacity, substation lead times and cooling, so every watt spent moving data is a watt unavailable for computation. Interconnect can absorb a meaningful share of system power once a cluster scales to tens of thousands of accelerators, which makes energy per bit a line item in procurement rather than a specification footnote.
The causal mechanism lies in the retiming and drive electronics. A front-panel pluggable module must drive a long host channel, so it carries a digital signal processor and strong drivers. Integrating the optical engine next to the switch or accelerator die eliminates that host channel and much of its circuitry. Operators facing multi-year interconnection queues treat the resulting savings as additional deployable compute.
Restraints Impact Analysis
Two engineering realities explain why co-packaged optics has advanced more slowly than its performance case suggests.
| Restraint | Impact on CAGR Forecast | Geographic Relevance | Impact Timeline |
| Laser reliability, thermal budget and assembly yield in co-packaged modules | High | Global | Long term (≥4 years) |
| Field serviceability and repair economics favouring replaceable pluggable modules | High | North America, Asia Pacific | Medium term (2–4 years) |
Thermal Limits and Assembly Yield Hold Back Co-Packaged Optics Deployment
Physics and manufacturing yield are the binding constraints. Semiconductor lasers degrade faster as junction temperature rises, and placing them beside an accelerator dissipating many hundreds of watts is exactly the wrong thermal environment. Wavelength drift in the same conditions complicates dense wavelength multiplexing. These effects limit how much optical capacity can realistically sit on the package today.
The cost source is compounded yield across an unusually expensive assembly. A co-packaged module combines a large logic die, several photonic integrated circuits, electronic driver chips, fibre attachment and often a separate laser subsystem on one organic or silicon substrate. A single defect discovered after assembly scraps every component, including the most valuable die in the system. Known-good-die testing of photonics before assembly remains difficult, and sub-micron fibre alignment adds further equipment cost and takt time to each unit.
Repair Economics in Live Clusters Keep Pluggable Modules Entrenched
Serviceability restrains adoption as strongly as physics does. Front-panel modules fail at predictable rates, and a technician can swap one in minutes without opening the chassis. If an optical engine is soldered to the package, a single failed channel can require replacing a complete switch or accelerator board. In a cluster where a stalled job wastes thousands of accelerator-hours, that risk profile is unattractive.
The underlying cause is an operational model built entirely around field-replaceable units. Spare inventory, multi-vendor sourcing enabled by the OSFP and QSFP-DD multi-source agreements, technician repair workflows and depot logistics all assume modules can be exchanged independently and quickly. Co-packaged designs break that model, so operators demand either demonstrated failure rates far below current pluggable modules, detachable optical connectors at the package edge, or redundant channels that allow graceful degradation in service.
Market Opportunities
External Laser Sources Emerge as a Separately Sourced Component Category
Moving the laser off the package creates a distinct component market. Remote or external laser sources supply continuous-wave light to passive modulators through fibre, keeping the temperature-sensitive component away from the accelerator and in a serviceable location. That architecture turns the laser into its own product line, with separate suppliers, qualification programmes, redundancy schemes and spare inventory.
Laser and photonic component specialists can capture this pool, along with system vendors that standardise the light supply across a chassis. Hyperscale operators and accelerator designers create the demand, because they need a reliability story before soldering optics onto expensive packages. Multi-wavelength and comb laser sources, higher output power per device, and shared laser modules serving many optical engines all support the approach, and the Optical Internetworking Forum co-packaged optics work addresses the interfaces involved.
Optical Scale-Up Fabrics Open a New Interconnect Pool Inside the Rack
Scale-up interconnect is the second emerging pool, and it is distinct from the scale-out networking most optics serves today. Coherent accelerator domains that share memory have historically used copper backplanes and cabled electrical links, which limits a domain to one or two racks. Optical links extend that domain across many racks, creating demand for very high-bandwidth, low-latency optical connections that never touch an Ethernet switch.
Accelerator vendors, system integrators and optical circuit switch suppliers are positioned to capture it, often through proprietary rather than standardised interfaces. Large model training and high-memory inference workloads generate the requirement, since both benefit from larger coherent domains. Supporting developments include chiplet-level interfaces described in the Universal Chiplet Interconnect Express specification, low-radix optical circuit switching, and accelerator roadmaps that already assume rack-scale memory pooling.
Segment Analysis
- By Technology: Pluggable Modules Still Dominate While Co-Packaged Optics Scales Fastest
Pluggable Optical Transceiver Modules held 62.0% of 2026 revenue. They dominate because they are proven, field-replaceable, multi-sourced under the OSFP and QSFP-DD multi-source agreements, and supported by mature high-volume manufacturing. Every deployed accelerator fabric today relies on them, and incumbency is reinforced by established repair and sparing practices.
Co-Packaged Optics is the fastest-growing technology at a 52.0% CAGR to 2033, from a very small base. Growth follows switch silicon that integrates optical engines on the same substrate, removing the host electrical channel and its retimers.
Near-Package Optical Engines and External Laser Sources and Fibre Attach complete the category, with near-package designs acting as a pragmatic middle path. The implication is that pluggables will retain most revenue throughout the forecast, while integration captures the incremental growth.
- By Data Rate: 800 Gb/s Carries Current Volume as 1.6 Tb/s Ramps Quickest
800 Gb/s ports accounted for 44.0% of 2026 revenue. This rate leads because it matches the current generation of accelerator and switch silicon, is widely standardised, and is supported by multiple qualified suppliers. Large clusters deployed through 2025 and 2026 standardised on it, creating a substantial installed base and sustained replacement demand.
1.6 Tb/s is the fastest-growing rate at a 49.0% CAGR. It aligns with 224 Gb/s electrical lanes and with the IEEE 802.3 project defining the next Ethernet rate, so it becomes the default for new fabric designs.
400 Gb/s and Below is in managed decline, while 3.2 Tb/s and Above remains pre-volume until late in the forecast period. For suppliers, the implication is a punishing cadence: each rate transition demands new optics, new electrical interfaces and fresh qualification.
- By Application: Training Fabrics Lead While Scale-Up Interconnect Grows Quickest
AI Training Scale-Out Fabric held 47.0% share in 2026. Training clusters lead because they contain the largest number of accelerators per deployment, use multiple network planes per node, and generate collective communication patterns that saturate every available link. The resulting port count per accelerator is higher than in any other application.
Scale-Up Accelerator Interconnect is the fastest-growing application at a 48.5% CAGR to 2033. Coherent memory domains are expanding beyond what copper backplanes can span, which forces optical links into a role previously reserved for electrical connections.
AI Inference Infrastructure and Data Centre Switching and Optical Circuit Switching account for the balance, with inference rising as large models move into production serving. The business implication is that suppliers must design for two different problems: maximum radix in scale-out, and minimum latency in scale-up.
- By End User: Hyperscalers Set the Specification While Neocloud Operators Expand Fastest
Hyperscale Cloud Providers held 55.0% of 2026 revenue. They lead because they buy the largest accelerator fleets, design custom silicon and network architectures, and qualify optical suppliers directly rather than through system vendors. Their internal roadmaps effectively determine which interconnect approach reaches volume.
Colocation and Neocloud Operators are the fastest-growing end user at a 44.0% CAGR. Specialist accelerator hosting businesses have scaled rapidly, and because they build new facilities rather than retrofit, they adopt current-generation optics immediately.
AI Semiconductor and System OEMs and Enterprise and Research HPC complete the segment, with national laboratories and sovereign computing programmes contributing steady but lumpy demand. The implication for suppliers is a concentrated customer base where losing one qualification cycle can remove a generation of revenue.
Geography Analysis
- Which Region Is Leading the Optical I/O for AI Chips Market?
North America leads with 45.5% of the optical interconnect market for artificial intelligence silicon in 2026. The United States is home to the accelerator and networking silicon designers, the largest cloud operators, and most of the venture capital funding silicon photonics startups. Demand is concentrated in a small number of very large cluster programmes.
Three factors reinforce the position. Architectural decisions are made locally, so optical suppliers must qualify with customers headquartered in the region. Facility build-out in Virginia, Texas and the Pacific Northwest continues at scale. Export controls administered by the Bureau of Industry and Security also shape global flows, restricting advanced computing shipments to China and redirecting system demand toward domestic and allied deployments. Grid interconnection delays are now the main practical constraint.
- Europe Contributes Photonics Research Depth Rather Than Deployment Volume
Europe holds 9.0% of the 2026 market, a share that understates its technical contribution. The Netherlands, Germany, France, the United Kingdom and Belgium host significant integrated photonics research, foundry capability and precision assembly equipment supply. Several key tools and processes used in photonic integration worldwide originate in the region.
Deployment demand is smaller and differently shaped. Sovereign computing initiatives and the EuroHPC programme fund national accelerator systems, while energy costs and planning rules constrain commercial data centre expansion in several countries. Regional buyers emphasise energy efficiency, which favours integrated optics on total cost of ownership grounds. The clearest opportunity is in components and equipment rather than finished systems, where specialist suppliers hold strong positions regardless of where deployment occurs.
- Which Region Is Growing Fastest in the Optical I/O for AI Chips Market?
Asia Pacific is the fastest-growing geography at a 40.5% CAGR between 2026 and 2033, from 40.0% share in 2026. China, Taiwan, Japan, South Korea and Singapore drive both supply and demand. Optical module manufacturing is heavily concentrated in China, while advanced packaging and silicon photonics process capacity sits largely in Taiwan, making the region central to every supply chain.
Demand is rising alongside supply. Domestic cloud operators are building large accelerator clusters, and sovereign programmes in Japan, South Korea and Singapore fund national systems. Export controls restricting advanced computing hardware to China have accelerated domestic accelerator and interconnect development there. Concentration is also the main risk, since packaging and laser supply bottlenecks in a few facilities can constrain global output.
- Latin America Demand Depends on New Hyperscale Facility Investment
Latin America represents 2.0% of 2026 revenue, the smallest regional share. Brazil, Mexico and Chile account for most activity, driven by hyperscale and colocation facilities built to serve regional cloud demand rather than by local accelerator design. Chile in particular has attracted investment thanks to cool climate conditions and renewable generation.
Barriers are infrastructural and economic. Grid capacity, transmission reliability and network latency to major interconnection points constrain large cluster siting, while equipment import duties and currency exposure raise effective costs. Technical workforce depth in advanced optical networking is limited outside a few cities. The main opportunity is renewable power availability, which is becoming a genuine siting advantage as operators elsewhere face multi-year interconnection queues and rising energy prices.
- Middle East & Africa Builds Accelerator Capacity Through Sovereign Investment
Middle East & Africa accounts for 3.5% of the 2026 market, a share rising faster than its size suggests. Saudi Arabia and the United Arab Emirates are funding very large national computing programmes with abundant low-cost energy and explicit ambitions to become regional artificial intelligence hosting hubs. Israel contributes networking and photonics engineering capability rather than deployment volume.
Constraints are real but narrowing. Extreme ambient temperatures raise cooling costs and complicate optical component thermal management, skilled operations staffing depends partly on expatriate recruitment, and access to leading accelerators is subject to export licensing conditions. The defining opportunity is energy: where power is cheap and available immediately, operators can justify building capacity that would face years of grid delay elsewhere, and new facilities adopt current-generation optics from day one.
Competitive Landscape
The optical interconnect market for artificial intelligence silicon is moderately concentrated, with concentration rising as it moves closer to the package. Pluggable module supply is competitive, with several high-volume manufacturers and a well-established multi-source culture. Co-packaged and near-package optics is far narrower, because it requires silicon photonics process access, advanced packaging capability, switch or accelerator silicon ownership and fibre attach expertise in one organisation. That combination exists in very few companies, so the integrated segment is dominated by large semiconductor firms and a small group of specialist startups. Vertical integration is the defining structural trend, with networking silicon vendors absorbing optical capability and foundries adding photonics process offerings.
Competition rests on measurable engineering attributes. Buyers compare energy per bit, bandwidth density at the package edge, bit error rate and link margin, laser reliability data expressed as failure rate over temperature, assembly yield and resulting cost per gigabit, fibre connector insertion loss and repeatability, and compliance with IEEE 802.3 and Optical Internetworking Forum interface specifications. Qualification cycles are long and exacting, which favours incumbents with field data. New approaches come from startups applying microring modulators, external laser architectures and optical compute interconnect to the scale-up problem, several working directly with accelerator designers rather than through network equipment vendors.
Strategic activity has concentrated on securing supply and capability. Semiconductor companies have acquired photonics specialists, laser suppliers have expanded capacity for continuous-wave devices, and foundries and packaging houses have added silicon photonics and fibre attach lines. Several accelerator designers have invested directly in optical startups to protect roadmap access, and standards collaboration has intensified around co-packaged optics interfaces.
Strategic direction is converging on three themes: proving reliability rather than peak performance, preserving serviceability through detachable optical connectors and external lasers, and aligning optical roadmaps tightly with accelerator generations instead of with networking refresh cycles.
Recent Industry Developments
- December 2017: The IEEE approved 802.3bs, the 400 Gb/s Ethernet standard – it established the rate ladder and electrical interface conventions that subsequent 800 Gb/s and 1.6 Tb/s work for accelerator fabrics has built upon.
- March 2022: The Universal Chiplet Interconnect Express 1.0 specification was released by its promoter consortium – it gave the industry an open die-to-die interface, making optical engines viable as chiplets inside a package rather than as proprietary attachments.
- October 2022: The Bureau of Industry and Security issued its interim final rule restricting exports of advanced computing items and semiconductor manufacturing equipment to China – it split accelerator supply chains and redirected high-bandwidth interconnect demand toward domestic and allied deployments.
- October 2023: The Bureau of Industry and Security updated the advanced computing controls to address performance-density workarounds and expand licensing requirements – it accelerated independent accelerator and interconnect development inside China.
- December 2024: The Bureau of Industry and Security issued further controls covering high-bandwidth memory and additional semiconductor manufacturing equipment – it extended restrictions from logic into the memory and packaging layers that co-packaged optics assemblies depend on.
Companies Covered in the Report
- Broadcom Inc.
- Marvell Technology, Inc.
- Coherent Corp.
- Lumentum Holdings Inc.
- Ayar Labs, Inc.
- Intel Corporation
- NVIDIA Corporation
- Cisco Systems, Inc.
- Innolight Technology Corporation
- Eoptolink Technology Inc., Ltd.
- Accelink Technologies Co., Ltd.
- Ranovus Inc.
- Celestial AI, Inc.
- Taiwan Semiconductor Manufacturing Company Limited
Optical I/O for AI Chips Market Report Scope
| Metric | Value |
| Study Period | 2020–2033 |
| Market Size 2026 | US$ 1.6 Billion |
| Market Size 2033 | US$ 14.5 Billion |
| CAGR 2026–2033 | 37.01% |
| Absolute Dollar Opportunity | US$ 12.9 Billion |
| Largest Market | North America (45.5% share in 2026) |
| Fastest-Growing Market | Asia Pacific (40.5% CAGR 2026–2033) |
| Market Concentration | Medium |
| Major Players | Broadcom Inc., Marvell Technology, Inc., Coherent Corp., Lumentum Holdings Inc., Ayar Labs, Inc. |
Optical I/O for AI Chips Market Segmentation
Technology
- Pluggable Optical Transceiver Modules
- Co-Packaged Optics
- Near-Package Optical Engines
- External Laser Sources and Fibre Attach
Data Rate
- 400 Gb/s and Below
- 800 Gb/s
- 1.6 Tb/s
- 3.2 Tb/s and Above
Application
- AI Training Scale-Out Fabric
- AI Inference Infrastructure
- Scale-Up Accelerator Interconnect
- Data Centre Switching and Optical Circuit Switching
End User
- Hyperscale Cloud Providers
- AI Semiconductor and System OEMs
- Colocation and Neocloud Operators
- Enterprise and Research HPC
Regions
- North America
- Europe
- Asia Pacific
- Latin America
- Middle East & Africa
- Executive Summary
- Global Optical I/O for AI Chips Market Snapshot
- Market Size and Trend Analysis 2020–2033
- Historical Growth 2020–2025
- Base Year 2025
- Forecast Outlook 2026–2033
- Key Report Takeaways
- Market Overview
- Market Definition and Report Scope
- Market Dynamics
- Drivers
- Shrinking Copper Reach at 224 Gb/s Forces Optics Toward the Accelerator Package
- Facility Power Ceilings Make Energy Per Bit a Procurement Criterion
- Restraints
- Thermal Limits and Assembly Yield Hold Back Co-Packaged Optics Deployment
- Repair Economics in Live Clusters Keep Pluggable Modules Entrenched
- Market Opportunities
- External Laser Sources Emerge as a Separately Sourced Component Category
- Optical Scale-Up Fabrics Open a New Interconnect Pool Inside the Rack
- Drivers
- Segment Analysis
- By Technology: Pluggable Modules Still Dominate While Co-Packaged Optics Scales Fastest
- By Data Rate: 800 Gb/s Carries Current Volume as 1.6 Tb/s Ramps Quickest
- By Application: Training Fabrics Lead While Scale-Up Interconnect Grows Quickest
- By End User: Hyperscalers Set the Specification While Neocloud Operators Expand Fastest
- Global Optical I/O for AI Chips Market Outlook, 2020–2033
- Global Optical I/O for AI Chips Market Outlook, by Technology, Value (US$ Billion), 2020–2033
- Pluggable Optical Transceiver Modules
- Co-Packaged Optics
- Near-Package Optical Engines
- External Laser Sources and Fibre Attach
- Global Optical I/O for AI Chips Market Outlook, by Data Rate, Value (US$ Billion), 2020–2033
- 400 Gb/s and Below
- 800 Gb/s
- 1.6 Tb/s
- 3.2 Tb/s and Above
- Global Optical I/O for AI Chips Market Outlook, by Application, Value (US$ Billion), 2020–2033
- AI Training Scale-Out Fabric
- AI Inference Infrastructure
- Scale-Up Accelerator Interconnect
- Data Centre Switching and Optical Circuit Switching
- Global Optical I/O for AI Chips Market Outlook, by End User, Value (US$ Billion), 2020–2033
- Hyperscale Cloud Providers
- AI Semiconductor and System OEMs
- Colocation and Neocloud Operators
- Enterprise and Research HPC
- Global Optical I/O for AI Chips Market Outlook, by Region, Value (US$ Billion), 2020–2033
- North America
- Europe
- Asia Pacific
- Latin America
- Middle East & Africa
- Global Optical I/O for AI Chips Market Outlook, by Technology, Value (US$ Billion), 2020–2033
- North America Optical I/O for AI Chips Market Outlook, 2020–2033
- Regional Market Leadership
- North America Optical I/O for AI Chips Market Outlook, by Technology, Value (US$ Billion), 2020–2033
- Pluggable Optical Transceiver Modules
- Co-Packaged Optics
- Near-Package Optical Engines
- External Laser Sources and Fibre Attach
- North America Optical I/O for AI Chips Market Outlook, by Data Rate, Value (US$ Billion), 2020–2033
- 400 Gb/s and Below
- 800 Gb/s
- 1.6 Tb/s
- 3.2 Tb/s and Above
- North America Optical I/O for AI Chips Market Outlook, by Application, Value (US$ Billion), 2020–2033
- AI Training Scale-Out Fabric
- AI Inference Infrastructure
- Scale-Up Accelerator Interconnect
- Data Centre Switching and Optical Circuit Switching
- North America Optical I/O for AI Chips Market Outlook, by End User, Value (US$ Billion), 2020–2033
- Hyperscale Cloud Providers
- AI Semiconductor and System OEMs
- Colocation and Neocloud Operators
- Enterprise and Research HPC
- North America Optical I/O for AI Chips Market Outlook, by Country, Value (US$ Billion), 2020–2033
- United States Optical I/O for AI Chips Market Outlook, by Technology, 2020–2033
- United States Optical I/O for AI Chips Market Outlook, by Data Rate, 2020–2033
- United States Optical I/O for AI Chips Market Outlook, by Application, 2020–2033
- United States Optical I/O for AI Chips Market Outlook, by End User, 2020–2033
- Europe Optical I/O for AI Chips Market Outlook, 2020–2033
- Europe Contributes Photonics Research Depth Rather Than Deployment Volume
- Europe Optical I/O for AI Chips Market Outlook, by Technology, Value (US$ Billion), 2020–2033
- Pluggable Optical Transceiver Modules
- Co-Packaged Optics
- Near-Package Optical Engines
- External Laser Sources and Fibre Attach
- Europe Optical I/O for AI Chips Market Outlook, by Data Rate, Value (US$ Billion), 2020–2033
- 400 Gb/s and Below
- 800 Gb/s
- 1.6 Tb/s
- 3.2 Tb/s and Above
- Europe Optical I/O for AI Chips Market Outlook, by Application, Value (US$ Billion), 2020–2033
- AI Training Scale-Out Fabric
- AI Inference Infrastructure
- Scale-Up Accelerator Interconnect
- Data Centre Switching and Optical Circuit Switching
- Europe Optical I/O for AI Chips Market Outlook, by End User, Value (US$ Billion), 2020–2033
- Hyperscale Cloud Providers
- AI Semiconductor and System OEMs
- Colocation and Neocloud Operators
- Enterprise and Research HPC
- Europe Optical I/O for AI Chips Market Outlook, by Country, Value (US$ Billion), 2020–2033
- Netherlands Optical I/O for AI Chips Market Outlook, by Technology, 2020–2033
- Netherlands Optical I/O for AI Chips Market Outlook, by Data Rate, 2020–2033
- Netherlands Optical I/O for AI Chips Market Outlook, by Application, 2020–2033
- Netherlands Optical I/O for AI Chips Market Outlook, by End User, 2020–2033
- Germany Optical I/O for AI Chips Market Outlook, by Technology, 2020–2033
- Germany Optical I/O for AI Chips Market Outlook, by Data Rate, 2020–2033
- Germany Optical I/O for AI Chips Market Outlook, by Application, 2020–2033
- Germany Optical I/O for AI Chips Market Outlook, by End User, 2020–2033
- France Optical I/O for AI Chips Market Outlook, by Technology, 2020–2033
- France Optical I/O for AI Chips Market Outlook, by Data Rate, 2020–2033
- France Optical I/O for AI Chips Market Outlook, by Application, 2020–2033
- France Optical I/O for AI Chips Market Outlook, by End User, 2020–2033
- United Kingdom Optical I/O for AI Chips Market Outlook, by Technology, 2020–2033
- United Kingdom Optical I/O for AI Chips Market Outlook, by Data Rate, 2020–2033
- United Kingdom Optical I/O for AI Chips Market Outlook, by Application, 2020–2033
- United Kingdom Optical I/O for AI Chips Market Outlook, by End User, 2020–2033
- Belgium Optical I/O for AI Chips Market Outlook, by Technology, 2020–2033
- Belgium Optical I/O for AI Chips Market Outlook, by Data Rate, 2020–2033
- Belgium Optical I/O for AI Chips Market Outlook, by Application, 2020–2033
- Belgium Optical I/O for AI Chips Market Outlook, by End User, 2020–2033
- Asia Pacific Optical I/O for AI Chips Market Outlook, 2020–2033
- Regional Growth Outlook
- Asia Pacific Optical I/O for AI Chips Market Outlook, by Technology, Value (US$ Billion), 2020–2033
- Pluggable Optical Transceiver Modules
- Co-Packaged Optics
- Near-Package Optical Engines
- External Laser Sources and Fibre Attach
- Asia Pacific Optical I/O for AI Chips Market Outlook, by Data Rate, Value (US$ Billion), 2020–2033
- 400 Gb/s and Below
- 800 Gb/s
- 1.6 Tb/s
- 3.2 Tb/s and Above
- Asia Pacific Optical I/O for AI Chips Market Outlook, by Application, Value (US$ Billion), 2020–2033
- AI Training Scale-Out Fabric
- AI Inference Infrastructure
- Scale-Up Accelerator Interconnect
- Data Centre Switching and Optical Circuit Switching
- Asia Pacific Optical I/O for AI Chips Market Outlook, by End User, Value (US$ Billion), 2020–2033
- Hyperscale Cloud Providers
- AI Semiconductor and System OEMs
- Colocation and Neocloud Operators
- Enterprise and Research HPC
- Asia Pacific Optical I/O for AI Chips Market Outlook, by Country, Value (US$ Billion), 2020–2033
- China Optical I/O for AI Chips Market Outlook, by Technology, 2020–2033
- China Optical I/O for AI Chips Market Outlook, by Data Rate, 2020–2033
- China Optical I/O for AI Chips Market Outlook, by Application, 2020–2033
- China Optical I/O for AI Chips Market Outlook, by End User, 2020–2033
- Taiwan Optical I/O for AI Chips Market Outlook, by Technology, 2020–2033
- Taiwan Optical I/O for AI Chips Market Outlook, by Data Rate, 2020–2033
- Taiwan Optical I/O for AI Chips Market Outlook, by Application, 2020–2033
- Taiwan Optical I/O for AI Chips Market Outlook, by End User, 2020–2033
- Japan Optical I/O for AI Chips Market Outlook, by Technology, 2020–2033
- Japan Optical I/O for AI Chips Market Outlook, by Data Rate, 2020–2033
- Japan Optical I/O for AI Chips Market Outlook, by Application, 2020–2033
- Japan Optical I/O for AI Chips Market Outlook, by End User, 2020–2033
- South Korea Optical I/O for AI Chips Market Outlook, by Technology, 2020–2033
- South Korea Optical I/O for AI Chips Market Outlook, by Data Rate, 2020–2033
- South Korea Optical I/O for AI Chips Market Outlook, by Application, 2020–2033
- South Korea Optical I/O for AI Chips Market Outlook, by End User, 2020–2033
- Singapore Optical I/O for AI Chips Market Outlook, by Technology, 2020–2033
- Singapore Optical I/O for AI Chips Market Outlook, by Data Rate, 2020–2033
- Singapore Optical I/O for AI Chips Market Outlook, by Application, 2020–2033
- Singapore Optical I/O for AI Chips Market Outlook, by End User, 2020–2033
- Latin America Optical I/O for AI Chips Market Outlook, 2020–2033
- Latin America Demand Depends on New Hyperscale Facility Investment
- Latin America Optical I/O for AI Chips Market Outlook, by Technology, Value (US$ Billion), 2020–2033
- Pluggable Optical Transceiver Modules
- Co-Packaged Optics
- Near-Package Optical Engines
- External Laser Sources and Fibre Attach
- Latin America Optical I/O for AI Chips Market Outlook, by Data Rate, Value (US$ Billion), 2020–2033
- 400 Gb/s and Below
- 800 Gb/s
- 1.6 Tb/s
- 3.2 Tb/s and Above
- Latin America Optical I/O for AI Chips Market Outlook, by Application, Value (US$ Billion), 2020–2033
- AI Training Scale-Out Fabric
- AI Inference Infrastructure
- Scale-Up Accelerator Interconnect
- Data Centre Switching and Optical Circuit Switching
- Latin America Optical I/O for AI Chips Market Outlook, by End User, Value (US$ Billion), 2020–2033
- Hyperscale Cloud Providers
- AI Semiconductor and System OEMs
- Colocation and Neocloud Operators
- Enterprise and Research HPC
- Latin America Optical I/O for AI Chips Market Outlook, by Country, Value (US$ Billion), 2020–2033
- Brazil Optical I/O for AI Chips Market Outlook, by Technology, 2020–2033
- Brazil Optical I/O for AI Chips Market Outlook, by Data Rate, 2020–2033
- Brazil Optical I/O for AI Chips Market Outlook, by Application, 2020–2033
- Brazil Optical I/O for AI Chips Market Outlook, by End User, 2020–2033
- Mexico Optical I/O for AI Chips Market Outlook, by Technology, 2020–2033
- Mexico Optical I/O for AI Chips Market Outlook, by Data Rate, 2020–2033
- Mexico Optical I/O for AI Chips Market Outlook, by Application, 2020–2033
- Mexico Optical I/O for AI Chips Market Outlook, by End User, 2020–2033
- Chile Optical I/O for AI Chips Market Outlook, by Technology, 2020–2033
- Chile Optical I/O for AI Chips Market Outlook, by Data Rate, 2020–2033
- Chile Optical I/O for AI Chips Market Outlook, by Application, 2020–2033
- Chile Optical I/O for AI Chips Market Outlook, by End User, 2020–2033
- Middle East & Africa Optical I/O for AI Chips Market Outlook, 2020–2033
- Middle East & Africa Builds Accelerator Capacity Through Sovereign Investment
- Middle East & Africa Optical I/O for AI Chips Market Outlook, by Technology, Value (US$ Billion), 2020–2033
- Pluggable Optical Transceiver Modules
- Co-Packaged Optics
- Near-Package Optical Engines
- External Laser Sources and Fibre Attach
- Middle East & Africa Optical I/O for AI Chips Market Outlook, by Data Rate, Value (US$ Billion), 2020–2033
- 400 Gb/s and Below
- 800 Gb/s
- 1.6 Tb/s
- 3.2 Tb/s and Above
- Middle East & Africa Optical I/O for AI Chips Market Outlook, by Application, Value (US$ Billion), 2020–2033
- AI Training Scale-Out Fabric
- AI Inference Infrastructure
- Scale-Up Accelerator Interconnect
- Data Centre Switching and Optical Circuit Switching
- Middle East & Africa Optical I/O for AI Chips Market Outlook, by End User, Value (US$ Billion), 2020–2033
- Hyperscale Cloud Providers
- AI Semiconductor and System OEMs
- Colocation and Neocloud Operators
- Enterprise and Research HPC
- Middle East & Africa Optical I/O for AI Chips Market Outlook, by Country, Value (US$ Billion), 2020–2033
- Saudi Arabia Optical I/O for AI Chips Market Outlook, by Technology, 2020–2033
- Saudi Arabia Optical I/O for AI Chips Market Outlook, by Data Rate, 2020–2033
- Saudi Arabia Optical I/O for AI Chips Market Outlook, by Application, 2020–2033
- Saudi Arabia Optical I/O for AI Chips Market Outlook, by End User, 2020–2033
- United Arab Emirates Optical I/O for AI Chips Market Outlook, by Technology, 2020–2033
- United Arab Emirates Optical I/O for AI Chips Market Outlook, by Data Rate, 2020–2033
- United Arab Emirates Optical I/O for AI Chips Market Outlook, by Application, 2020–2033
- United Arab Emirates Optical I/O for AI Chips Market Outlook, by End User, 2020–2033
- Israel Optical I/O for AI Chips Market Outlook, by Technology, 2020–2033
- Israel Optical I/O for AI Chips Market Outlook, by Data Rate, 2020–2033
- Israel Optical I/O for AI Chips Market Outlook, by Application, 2020–2033
- Israel Optical I/O for AI Chips Market Outlook, by End User, 2020–2033
- Competitive Landscape
- Market Concentration and Supplier Participation
- Competitive Factors and Strategic Direction
- Recent Industry Developments
- IEEE 802.3bs Ethernet Standard December 2017
- Universal Chiplet Interconnect Express 1.0 Specification March 2022
- BIS Advanced Computing Export Controls October 2022
- BIS Advanced Computing Control Update October 2023
- BIS Memory and Semiconductor Equipment Controls December 2024
- Company Profiles
- Broadcom Inc.
- Marvell Technology, Inc.
- Coherent Corp.
- Lumentum Holdings Inc.
- Ayar Labs, Inc.
- Intel Corporation
- NVIDIA Corporation
- Cisco Systems, Inc.
- Innolight Technology Corporation
- Eoptolink Technology Inc., Ltd.
- Accelink Technologies Co., Ltd.
- Ranovus Inc.
- Celestial AI, Inc.
- Taiwan Semiconductor Manufacturing Company Limited
- Appendix
- Research Methodology
- Report Assumptions
- Acronyms and Abbreviations
Technology
- Pluggable Optical Transceiver Modules
- Co-Packaged Optics
- Near-Package Optical Engines
- External Laser Sources and Fibre Attach
Data Rate
- 400 Gb/s and Below
- 800 Gb/s
- 1.6 Tb/s
- 3.2 Tb/s and Above
Application
- AI Training Scale-Out Fabric
- AI Inference Infrastructure
- Scale-Up Accelerator Interconnect
- Data Centre Switching and Optical Circuit Switching
End User
- Hyperscale Cloud Providers
- AI Semiconductor and System OEMs
- Colocation and Neocloud Operators
- Enterprise and Research HPC
Regions
- North America
- Europe
- Asia Pacific
- Latin America
- Middle East & Africa
Our Research Methodology
Considering the volatility of business today, traditional approaches to strategizing a game plan can be unfruitful if not detrimental. True ambiguity is no way to determine a forecast. A myriad of predetermined factors must be accounted for such as the degree of risk involved, the magnitude of circumstances, as well as conditions or consequences that are not known or unpredictable. To circumvent binary views that cast uncertainty, the application of market research intelligence to strategically posture, move, and enable actionable outcomes is necessary.
View Methodology
Quality Assured
Rigorous Validation Process

Confidentiality Assured
End-to-end Data Security

Custom Research Services
Tailored To Your Objectives
FAQs
The market is valued at US$ 1.6 billion in 2026, covering co-packaged optics, near-package engines, external lasers and accelerator-fabric pluggable modules.
Revenue is forecast to reach US$ 14.5 billion by 2033 at a 37.01% CAGR, an absolute dollar opportunity of US$ 12.9 billion over the period.
Pluggable Optical Transceiver Modules lead with 62.0% share in 2026, because they are proven, multi-sourced and replaceable without opening a chassis.
Asia Pacific expands fastest at a 40.5% CAGR, supported by optical module manufacturing, advanced packaging capacity and rapidly growing domestic accelerator deployment.
Concentration is medium, as pluggable supply stays competitive while co-packaged optics narrows to firms combining photonics, packaging and switch silicon.
Related Reports
Secure Flash Drive Market Size, Share, Insights, Competitive Landscape, and Forecast 2026 to 2033
The global secure flash drive market is valued at US$0.8 billion in 2026, reaching US$1.1 billion by 2033, growing at a 4.7% CAGR
Foldable Drones Market Size, Share, Insights, Competitive Landscape, and Forecast 2026 to 2033
The global foldable drones market is valued at US$3.76 billion in 2026 and is projected to reach US$7.57 billion by 2033, growing at a 10.5% CAGR.
BEV On-Board Charger Market Size, Share, Insights, Competitive Landscape, and Forecast 2026 to 2033
The global BEV On-Board Charger market is valued at US$ 6.8 Bn in 2026 and is projected to reach US$ 17.6 Bn by 2033, growing at a CAGR of 14.6%
Seismic Services Market Size, Share, Insights, Competitive Landscape, and Forecast 2026 to 2033
The global seismic services market is valued at US$ 10.2 billion in 2026 and is projected to reach US$ 14.9 billion by 2033, growing at a CAGR of 5.56%
Intelligent Power Module for AWHP Market Size, Share, Insights, Competitive Landscape, and Forecast 2026 to 2033
Intelligent Power Module for AWHP market is projected to grow from US$0.89 billion in 2026 to US$2.34 billion by 2033, at a CAGR of 14.8%.
LTE & 5G NR-based CBRS Networks Market Size, Share, Insights, Competitive Landscape, and Forecast 2026 to 2033
The LTE & 5G NR-based CBRS Networks market in 2026, valued at US$ 3.4 billion and projected to reach US$ 13.2 billion by 2033, growing at a 21.4% CAGR.