Global Ready-mix Concrete Market
Executive Summary & Key Highlights
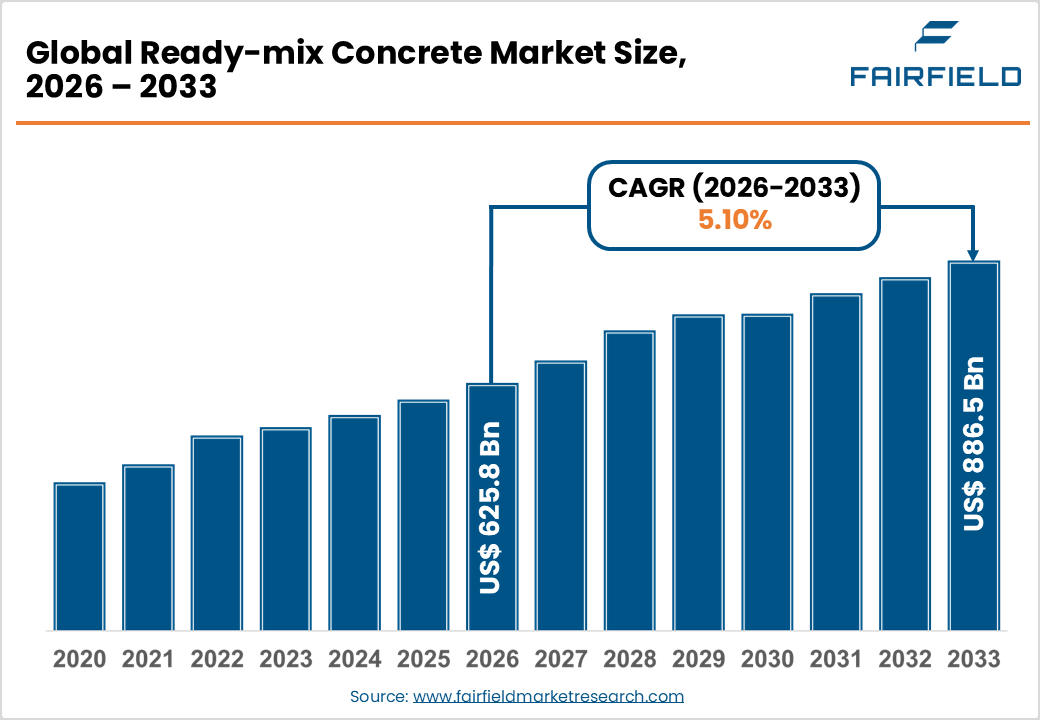
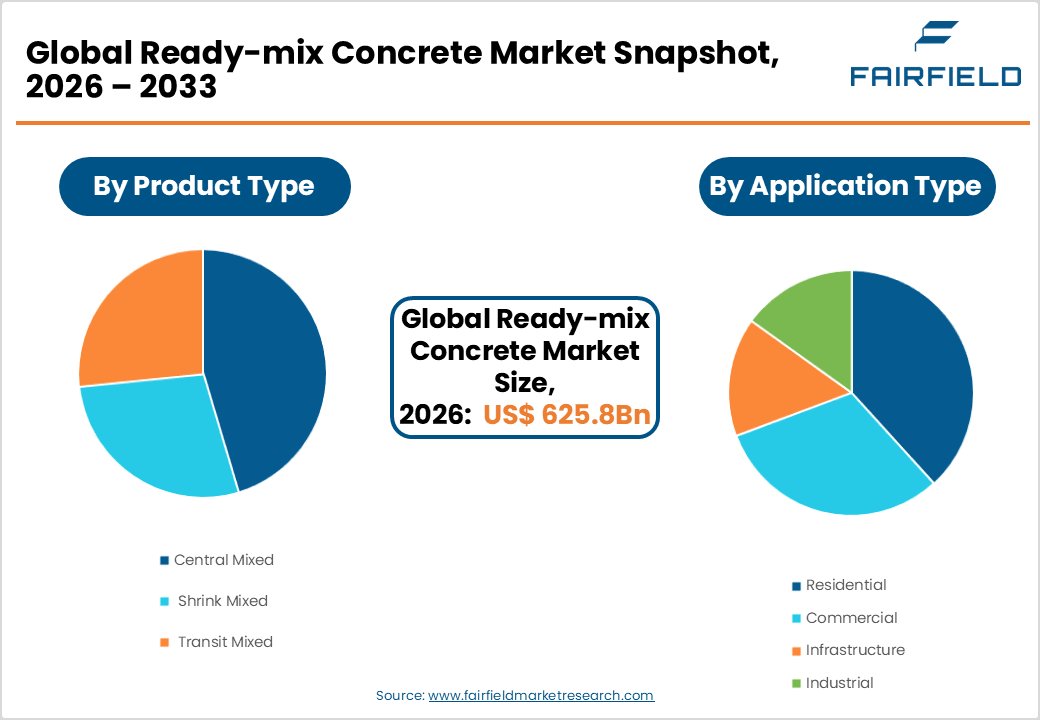
- The global ready-mix concrete market size is likely to be valued at USD 625.8 billion in 2026 and is expected to reach USD 886.5 billion by 2033, growing at a CAGR of 5.10% during the forecast period from 2026 to 2033.
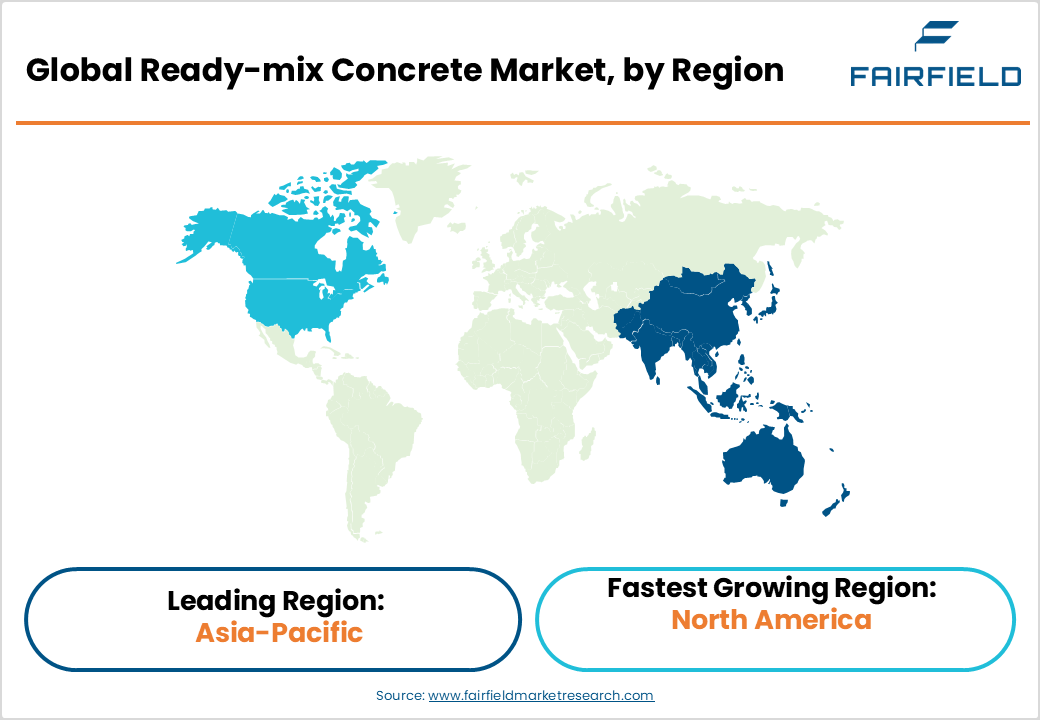
- Asia Pacific leads the global ready-mix concrete market with approximately 37% revenue share, driven by China's Belt and Road Initiative, India's National Infrastructure Pipeline, and rapid ASEAN urbanization-led construction activity.
- North America is the fastest-growing ready-mix concrete market, propelled by Trillions of U.S. Infrastructure Investment and Jobs Act (IIJA), a residential construction boom, and expanding plant and fleet capacities of major regional producers.
- Transit Mixed concrete dominates the product segment with approximately 65% market share, owing to its operational flexibility, long-haul delivery compatibility, and widespread adoption supported by established transit mixer logistics infrastructure globally.
- Infrastructure is the fastest growing application segment, driven by massive government-funded highway, bridge, airport, and rail programs across Asia Pacific and North America, generating sustained multi-year high-volume ready-mix concrete demand pipelines.
- Green and sustainable concrete formulations represent the defining market opportunity, as global environmental regulations and LEED / BREEAM building standards accelerate demand for low-carbon, SCM-based ready-mix concrete solutions from producers worldwide.
Market Dynamics: Drivers, Restraints, and Opportunities Analysis
Market Growth Drivers
- Surging Global Infrastructure Investment
Global infrastructure spending is at historically elevated levels. According to the Global Infrastructure Hub (GI Hub), the world requires approximately US$ 97 trillion in infrastructure investment between 2016 and 2040 to sustainably meet growing demand. Governments are responding with unprecedented stimulus the U.S. Infrastructure Investment and Jobs Act (IIJA) allocated US$ 1.2 trillion, including US$ 550 billion in new spending, toward roads, bridges, water systems, and transit. Similarly, India's National Infrastructure Pipeline (NIP) targets approximately US$ 1.4 trillion in infrastructure investment by 2025. Ready-mix concrete, as the foundational material for roads, bridges, dams, and airports, directly and persistently benefits from these large-scale public programs, creating sustained multi-year demand throughout the forecast period.
- Rapid Urbanization and Residential Construction Boom
The United Nations projects that approximately 68% of the world's population will reside in urban areas by 2050. This global urbanization wave is generating an unprecedented surge in residential and commercial construction, particularly across Asia Pacific, Sub-Saharan Africa, and Latin America. The World Bank estimates that developing countries need to invest in infrastructure, including housing, to accommodate urban population growth. China and India alone account for a disproportionately large share of new construction globally. Ready-mix concrete's inherent advantages such as consistent batch quality, faster construction timelines, and reduced on-site labor requirements compared to site-mixed alternatives to make it the preferred construction material for high-volume residential and commercial development projects.
Market Restraints
- Volatility in Raw Material Costs
Ready-mix concrete production is critically dependent on cement, aggregates, water, and chemical admixtures. Volatile prices for cement and aggregates are driven by energy cost fluctuations, supply chain disruptions, and transport expenses which significantly erode producer margins. According to the U.S. Bureau of Labor Statistics (BLS), construction materials prices surged sharply during 2021-2023, directly impacting contractor and ready-mix producer cost structures. This raw material price instability complicates forward contract pricing and limits competitive positioning, particularly for small and medium-sized regional producers who lack the procurement scale advantages of larger multinational operators.
- Environmental Regulations and Carbon Emission Constraints
Cement production, the core constituent of ready-mix concrete is responsible for approximately 8% of global CO2 emissions, according to the International Energy Agency (IEA). Tightening environmental regulations in the European Union, the U.S., and other major jurisdictions are increasing compliance costs for concrete producers. The EU's Carbon Border Adjustment Mechanism (CBAM), which entered its transitional phase in 2023, alongside national net-zero construction mandates, is pressuring producers to adopt low-carbon formulations. Transitioning to supplementary cementitious materials (SCMs) and carbon-neutral concrete demands substantial capital investment, creating a financial burden particularly for smaller operators that may temper the pace of market expansion in highly regulated geographies.
Market Opportunities
- Green and Sustainable Concrete Innovation
Growing regulatory mandates and corporate sustainability commitments are generating strong demand for eco-friendly ready-mix concrete formulations. The European Green Deal and the U.S. Environmental Protection Agency's (EPA) clean construction guidelines are accelerating adoption of supplementary cementitious materials (SCMs) including fly ash, slag, and silica fume which can reduce Portland cement content, significantly lowering the carbon footprint of concrete. Companies integrating carbon-capture technologies, recycled aggregate, and low-carbon binders can differentiate their offerings and command premium pricing. HOLCIM has committed to scaling its ECOPact low-carbon concrete brand globally. Alignment with green building rating standards such as LEED (Leadership in Energy and Environmental Design) and BREEAM further drives demand for sustainable ready-mix concrete across commercial and infrastructure construction segments.
- North America's Infrastructure-Led Construction Expansion
North America, the fastest growing regional market, presents a compelling multi-year growth opportunity for ready-mix concrete producers. The U.S. Infrastructure Investment and Jobs Act (IIJA) allocates new funding for roads, bridges, water systems, broadband, and public transit creating an extended construction demand pipeline well into the 2030s. The U.S. Army Corps of Engineers has also earmarked significant investment in flood control and water infrastructure. Canada's Investing in Canada Plan has committed approximately C$ 180 billion in long-term infrastructure development. A parallel residential housing boom, large-scale data center construction programs, and manufacturing reshoring are further supporting concrete demand. Ready-mix concrete producers that expand plant networks, fleet capacity, and digital dispatch technology across the U.S. and Canada are well-positioned to capture this sustained regional opportunity.
Segmentation Analysis: Category-Wise Strategic Assessment
- Product Analysis
Transit Mixed concrete dominates the product segment, accounting for approximately 65% of the global ready-mix concrete market. In this method, dry materials are loaded into the truck drum at the batching plant and water is added either at the plant or en route, with mixing occurring entirely during transit to the construction site. Transit mixing is widely favored for its operational flexibility, ability to cover extended haul distances without risking premature hydration, and capacity to fine-tune water-cement ratios at the point of delivery. The widespread global availability of transit mixer trucks and well-established logistics infrastructure support the segment's dominant position. According to the National Ready Mixed Concrete Association (NRMCA) in the U.S., transit mixed concrete accounts for the overwhelming majority of all ready-mix concrete deliveries in North American markets.
- Application Analysis
Infrastructure represents the leading application segment, accounting for approximately 40% of the global ready-mix concrete market. Large-scale government-funded projects encompassing highways, expressways, bridges, tunnels, dams, airports, and rail networks demand substantial volumes of high-performance, precisely engineered concrete mix designs, making ready-mix concrete the preferred material of choice. Asia Pacific's massive programs, including China's Belt and Road Initiative (BRI) and India's National Infrastructure Pipeline (NIP), are among the primary global demand generators. In North America, the U.S. IIJA is sustaining a multi-year infrastructure construction boom. The stringent compressive strength, durability, and consistency requirements of infrastructure-grade applications align precisely with the quality assurance capabilities of commercial ready-mix concrete producers.
Regional Market Assessment: Strategic Geography Analysis
- North America Ready-mix Concrete Market Trends
North America is the fastest growing regional market for ready-mix concrete, underpinned by extraordinary levels of government-backed infrastructure investment and robust residential and commercial construction activity. The U.S. Infrastructure Investment and Jobs Act (IIJA), signed in 2021, allocates US$ 1.2 trillion toward roads, bridges, water systems, broadband, and transit infrastructure, generating an extended multi-year construction pipeline with direct, sustained benefits for ready-mix concrete producers across the United States.
The U.S. also benefits from a well-organized industry structure, with the National Ready Mixed Concrete Association (NRMCA) actively advancing quality standards, sustainability certifications, and industry innovation. A post-pandemic residential housing boom, rapid expansion of data center construction, and manufacturing facility reshoring are providing additional concrete demand impetus. Market participants including U.S. Concrete, Inc., R.W. Sidley, Inc., and Barney & Dickenson, Inc. are expanding fleet and plant capacities to capture this infrastructure-driven regional growth opportunity.
- Europe Ready-mix Concrete Market Trends
Europe represents a mature yet steadily growing ready-mix concrete market, driven by infrastructure renewal programs, green building mandates, and large-scale urban regeneration projects. The European Union's cohesion funds and the EU Green Deal are channeling substantial investment into sustainable construction, transport infrastructure upgrades, and energy-efficient building retrofits. Germany, France, the U.K., and Spain are the region's primary markets, supported by well-developed construction industries and comprehensive building material standards under EN 206 the European Standard for Concrete.
Germany maintains a regional leadership position through its advanced construction technology sector and sustained government investment in transport infrastructure and housing. The U.K.'s major infrastructure programs, including HS2 (High Speed 2) rail and urban regeneration initiatives under the Levelling Up agenda, are generating consistent concrete demand. Spain and France are investing substantially in renewable energy infrastructure and social housing programs aligned with EU environmental directives, supporting demand for sustainable ready-mix concrete formulations from producers including Vicat S.A., Buzzi SpA, and Heidelberg Materials AG.
- Asia Pacific Ready-mix Concrete Market Trends
Asia Pacific is the leading regional market for ready-mix concrete, accounting for approximately 37% of global market revenue, driven by the world's most intensive urbanization dynamics and infrastructure investment programs. China remains the dominant sub-regional market, consistently accounting for the majority of global cement and concrete consumption. China's Belt and Road Initiative (BRI) and continued government investment in smart city infrastructure, high-speed rail networks, and affordable housing programs sustain enormous annual concrete demand volumes.
India is rapidly emerging as a high-growth market, with the government's National Infrastructure Pipeline (NIP) targeting investments of approximately US$ 1.4 trillion across infrastructure sectors by 2025. Japan's urban renewal programs and disaster-resilience infrastructure investments further support regional consumption. ASEAN nations particularly Indonesia, Vietnam, and the Philippines are experiencing construction booms driven by foreign direct investment inflows, manufacturing capacity expansion, and accelerating urbanization. UltraTech Cement Ltd. and China National Building Material Group Corporation are among the dominant regional participants sustaining supply chain strength.
Competitive Landscape: Market Structure and Strategic Positioning
The global ready-mix concrete market is moderately fragmented, comprising a blend of large multinational building materials corporations and numerous regional and local producers. Leading players, including HOLCIM, CEMEX, S.A.B. de C.V., Heidelberg Materials AG, and UltraTech Cement Ltd., leverage scale advantages, vertically integrated supply chains, and diversified geographic footprints to sustain market leadership. Key competitive strategies include fleet and plant capacity expansion, digital batching and dispatch optimization, low-carbon product differentiation, and acquisition of regional concrete producers. Smaller operators compete on proximity, localized service responsiveness, and customer relationships. Growing industry-wide investment in automated batching technology and telematics-enabled transit mixer fleet management is enhancing operational efficiency across the competitive landscape.
Key Players
- ACC Limited
- Vicat S.A.
- HOLCIM
- Buzzi SpA
- W. Sidley, Inc.
- Barney & Dickenson, Inc.
- Dillon Bros Ready Mix Concrete
- Livingston's Concrete Service, Inc.
- Heidelberg Materials AG
- CEMEX, S.A.B. de C.V.
- S. Concrete, Inc.
- UltraTech Cement Ltd.
- China National Building Material Group Corporation
- Others
Key Industry Developments
- March, 2025: HOLCIM launched its expanded ECOPact green concrete range across North American markets, offering low-carbon ready-mix formulations with up to 30% reduced CO2 footprint, targeting LEED-certified commercial and infrastructure construction projects.
- October, 2024: CEMEX, S.A.B. de C.V. commissioned a new ready-mix concrete plant in Texas, USA, strengthening production capacity to serve growing infrastructure and residential demand driven by IIJA infrastructure spending programs.
- June, 2023: Heidelberg Materials AG completed the acquisition of Mungindi Concrete in Australia, expanding its ready-mix concrete plant network in the Asia Pacific region as part of its broader geographic diversification strategy.
Global Ready-mix Concrete Market Segmentation
By Product
- Central Mixed
- Shrink Mixed
- Transit Mixed
By Application
- Commercial
- Residential
- Infrastructure
- Industrial
By Region
- North America
- Europe
- Asia Pacific
- Latin America
- Middle East & Africa
- Executive Summary
- Global Ready-mix Concrete Market Snapshot
- Future Projections
- Key Market Trends
- Regional Snapshot, by Value, 2026
- Analyst Recommendations
- Market Overview
- Market Definitions and Segmentations
- Market Dynamics
- Drivers
- Restraints
- Market Opportunities
- Value Chain Analysis
- COVID-19 Impact Analysis
- Porter's Five Forces Analysis
- Impact of Russia-Ukraine Conflict
- PESTLE Analysis
- Regulatory Analysis
- Price Trend Analysis
- Current Prices and Future Projections, 2025-2033
- Price Impact Factors
- Global Ready-mix Concrete Market Outlook, 2020 - 2033
- Global Ready-mix Concrete Market Outlook, by Product, Value (US$ Bn), 2020-2033
- Central Mixed
- Shrink Mixed
- Transit Mixed
- Global Ready-mix Concrete Market Outlook, by Application, Value (US$ Bn), 2020-2033
- Commercial
- Residential
- Infrastructure
- Industrial
- Global Ready-mix Concrete Market Outlook, by Region, Value (US$ Bn), 2020-2033
- North America
- Europe
- Asia Pacific
- Latin America
- Middle East & Africa
- Global Ready-mix Concrete Market Outlook, by Product, Value (US$ Bn), 2020-2033
- North America Ready-mix Concrete Market Outlook, 2020 - 2033
- North America Ready-mix Concrete Market Outlook, by Product, Value (US$ Bn), 2020-2033
- Central Mixed
- Shrink Mixed
- Transit Mixed
- North America Ready-mix Concrete Market Outlook, by Application, Value (US$ Bn), 2020-2033
- Commercial
- Residential
- Infrastructure
- Industrial
- North America Ready-mix Concrete Market Outlook, by Country, Value (US$ Bn), 2020-2033
- U.S. Ready-mix Concrete Market Outlook, by Product, 2020-2033
- U.S. Ready-mix Concrete Market Outlook, by Application, 2020-2033
- Canada Ready-mix Concrete Market Outlook, by Product, 2020-2033
- Canada Ready-mix Concrete Market Outlook, by Application, 2020-2033
- BPS Analysis/Market Attractiveness Analysis
- North America Ready-mix Concrete Market Outlook, by Product, Value (US$ Bn), 2020-2033
- Europe Ready-mix Concrete Market Outlook, 2020 - 2033
- Europe Ready-mix Concrete Market Outlook, by Product, Value (US$ Bn), 2020-2033
- Central Mixed
- Shrink Mixed
- Transit Mixed
- Europe Ready-mix Concrete Market Outlook, by Application, Value (US$ Bn), 2020-2033
- Commercial
- Residential
- Infrastructure
- Industrial
- Europe Ready-mix Concrete Market Outlook, by Country, Value (US$ Bn), 2020-2033
- Germany Ready-mix Concrete Market Outlook, by Product, 2020-2033
- Germany Ready-mix Concrete Market Outlook, by Application, 2020-2033
- Italy Ready-mix Concrete Market Outlook, by Product, 2020-2033
- Italy Ready-mix Concrete Market Outlook, by Application, 2020-2033
- France Ready-mix Concrete Market Outlook, by Product, 2020-2033
- France Ready-mix Concrete Market Outlook, by Application, 2020-2033
- U.K. Ready-mix Concrete Market Outlook, by Product, 2020-2033
- U.K. Ready-mix Concrete Market Outlook, by Application, 2020-2033
- Spain Ready-mix Concrete Market Outlook, by Product, 2020-2033
- Spain Ready-mix Concrete Market Outlook, by Application, 2020-2033
- Russia Ready-mix Concrete Market Outlook, by Product, 2020-2033
- Russia Ready-mix Concrete Market Outlook, by Application, 2020-2033
- Rest of Europe Ready-mix Concrete Market Outlook, by Product, 2020-2033
- Rest of Europe Ready-mix Concrete Market Outlook, by Application, 2020-2033
- BPS Analysis/Market Attractiveness Analysis
- Europe Ready-mix Concrete Market Outlook, by Product, Value (US$ Bn), 2020-2033
- Asia Pacific Ready-mix Concrete Market Outlook, 2020 - 2033
- Asia Pacific Ready-mix Concrete Market Outlook, by Product, Value (US$ Bn), 2020-2033
- Central Mixed
- Shrink Mixed
- Transit Mixed
- Asia Pacific Ready-mix Concrete Market Outlook, by Application, Value (US$ Bn), 2020-2033
- Commercial
- Residential
- Infrastructure
- Industrial
- Asia Pacific Ready-mix Concrete Market Outlook, by Country, Value (US$ Bn), 2020-2033
- China Ready-mix Concrete Market Outlook, by Product, 2020-2033
- China Ready-mix Concrete Market Outlook, by Application, 2020-2033
- Japan Ready-mix Concrete Market Outlook, by Product, 2020-2033
- Japan Ready-mix Concrete Market Outlook, by Application, 2020-2033
- South Korea Ready-mix Concrete Market Outlook, by Product, 2020-2033
- South Korea Ready-mix Concrete Market Outlook, by Application, 2020-2033
- India Ready-mix Concrete Market Outlook, by Product, 2020-2033
- India Ready-mix Concrete Market Outlook, by Application, 2020-2033
- Southeast Asia Ready-mix Concrete Market Outlook, by Product, 2020-2033
- Southeast Asia Ready-mix Concrete Market Outlook, by Application, 2020-2033
- Rest of SAO Ready-mix Concrete Market Outlook, by Product, 2020-2033
- Rest of SAO Ready-mix Concrete Market Outlook, by Application, 2020-2033
- BPS Analysis/Market Attractiveness Analysis
- Asia Pacific Ready-mix Concrete Market Outlook, by Product, Value (US$ Bn), 2020-2033
- Latin America Ready-mix Concrete Market Outlook, 2020 - 2033
- Latin America Ready-mix Concrete Market Outlook, by Product, Value (US$ Bn), 2020-2033
- Central Mixed
- Shrink Mixed
- Transit Mixed
- Latin America Ready-mix Concrete Market Outlook, by Application, Value (US$ Bn), 2020-2033
- Commercial
- Residential
- Infrastructure
- Industrial
- Latin America Ready-mix Concrete Market Outlook, by Country, Value (US$ Bn), 2020-2033
- Brazil Ready-mix Concrete Market Outlook, by Product, 2020-2033
- Brazil Ready-mix Concrete Market Outlook, by Application, 2020-2033
- Mexico Ready-mix Concrete Market Outlook, by Product, 2020-2033
- Mexico Ready-mix Concrete Market Outlook, by Application, 2020-2033
- Argentina Ready-mix Concrete Market Outlook, by Product, 2020-2033
- Argentina Ready-mix Concrete Market Outlook, by Application, 2020-2033
- Rest of LATAM Ready-mix Concrete Market Outlook, by Product, 2020-2033
- Rest of LATAM Ready-mix Concrete Market Outlook, by Application, 2020-2033
- BPS Analysis/Market Attractiveness Analysis
- Latin America Ready-mix Concrete Market Outlook, by Product, Value (US$ Bn), 2020-2033
- Middle East & Africa Ready-mix Concrete Market Outlook, 2020 - 2033
- Middle East & Africa Ready-mix Concrete Market Outlook, by Product, Value (US$ Bn), 2020-2033
- Central Mixed
- Shrink Mixed
- Transit Mixed
- Middle East & Africa Ready-mix Concrete Market Outlook, by Application, Value (US$ Bn), 2020-2033
- Commercial
- Residential
- Infrastructure
- Industrial
- Middle East & Africa Ready-mix Concrete Market Outlook, by Country, Value (US$ Bn), 2020-2033
- GCC Ready-mix Concrete Market Outlook, by Product, 2020-2033
- GCC Ready-mix Concrete Market Outlook, by Application, 2020-2033
- South Africa Ready-mix Concrete Market Outlook, by Product, 2020-2033
- South Africa Ready-mix Concrete Market Outlook, by Application, 2020-2033
- Egypt Ready-mix Concrete Market Outlook, by Product, 2020-2033
- Egypt Ready-mix Concrete Market Outlook, by Application, 2020-2033
- Nigeria Ready-mix Concrete Market Outlook, by Product, 2020-2033
- Nigeria Ready-mix Concrete Market Outlook, by Application, 2020-2033
- Rest of Middle East Ready-mix Concrete Market Outlook, by Product, 2020-2033
- Rest of Middle East Ready-mix Concrete Market Outlook, by Application, 2020-2033
- BPS Analysis/Market Attractiveness Analysis
- Middle East & Africa Ready-mix Concrete Market Outlook, by Product, Value (US$ Bn), 2020-2033
- Competitive Landscape
- Company Vs Segment Heatmap
- Company Market Share Analysis, 2025
- Competitive Dashboard
- Company Profiles
- ACC Limited
- Company Overview
- Product Portfolio
- Financial Overview
- Business Strategies and Developments
- Vicat S.A.
- HOLCIM
- Buzzi SpA
- W. Sidley, Inc.
- Barney & Dickenson, Inc.
- Dillon Bros Ready Mix Concrete
- Livingston's Concrete Service, Inc.
- Heidelberg Materials AG
- CEMEX, S.A.B. de C.V.
- S. Concrete, Inc.
- UltraTech Cement Ltd.
- China National Building Material Group Corporation
- Others
- ACC Limited
- Appendix
- Research Methodology
- Report Assumptions
- Acronyms and Abbreviations
|
BASE YEAR |
HISTORICAL DATA |
FORECAST PERIOD |
UNITS |
|||
|
2025 |
|
2019 - 2025 |
2026 - 2033 |
Value: US$ Billion |
||
|
REPORT FEATURES |
DETAILS |
|
By Product Coverage |
|
|
By Application Coverage |
|
|
Geographical Coverage |
|
|
Leading Companies |
|
|
Report Highlights |
Key Market Indicators, Macro-micro economic impact analysis, Technological Roadmap, Key Trends, Driver, Restraints, and Future Opportunities & Revenue Pockets, Porter’s 5 Forces Analysis, Historical Trend (2019-2024), Market Estimates and Forecast, Market Dynamics, Industry Trends, Competition Landscape, Category, Region, Country-wise Trends & Analysis, COVID-19 Impact Analysis (Demand and Supply Chain) |