



Zero Gravity Entertainment Market
Zero Gravity Entertainment Market Size, Share, Insights, Competitive Landscape, and Forecast 2026 to 2033
Zero Gravity Entertainment Market Size and Trend Analysis
How Small Is the Zero Gravity Entertainment Market Today?
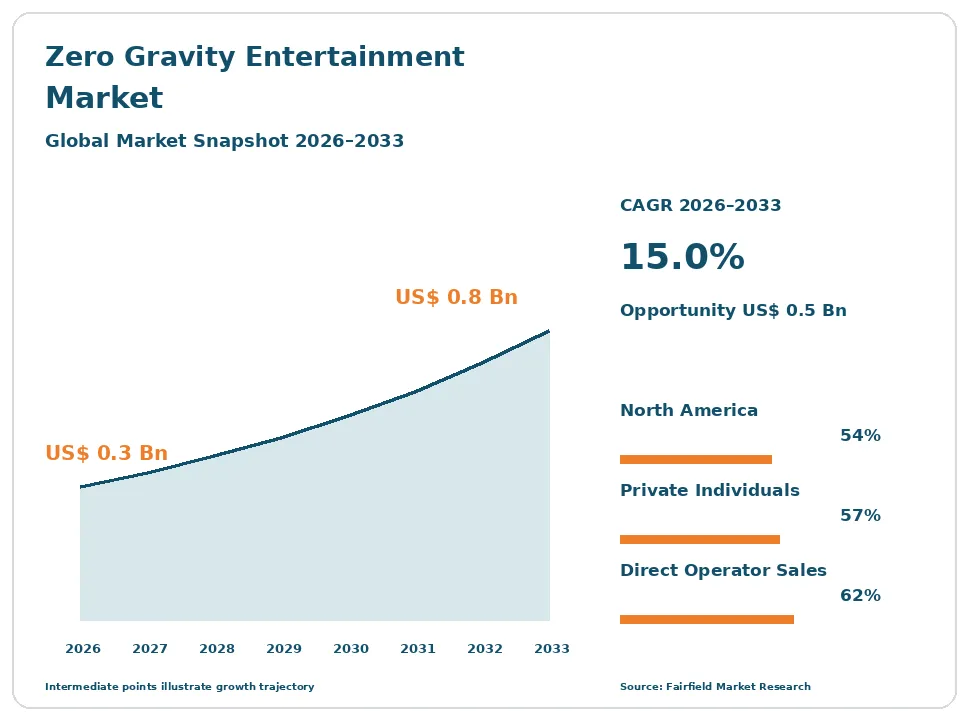
The global Zero Gravity Entertainment market size is expected to be valued at US$ 0.3 billion in 2026 and projected to reach US$ 0.8 billion by 2033, growing at a CAGR of 15.0% between 2026 and 2033.
This is a very small market, and the figure should be read as such. Between 2020 and 2025 it grew at roughly a 17% CAGR, but from a base measured in tens of millions, with flights suspended for long stretches. Revenue depends on a handful of aircraft and vehicles flying a few dozen times a year, so total passenger numbers remain in the low thousands. Growth comes mainly from ground-based and simulated attractions, which are cheap to replicate, and from research and media charters that pay regardless of tourist demand. Seat prices have not fallen as advocates once predicted, which is the central constraint on scale.
Key Report Takeaways
- By Experience Type: Suborbital Human Spaceflight held 29% share in 2026, while Ground-Based Simulators and Virtual Reality Attractions are projected to expand at a 24.6% CAGR through 2033, because they can be replicated in ordinary leisure venues at low unit cost.
- By Customer Type: Private Individuals held 57% share in 2026, while Media and Film Production is projected to grow at a 19.4% CAGR through 2033, as advertising and feature production budgets absorb charter costs that individuals cannot.
- By Booking Channel: Direct Operator Sales held 62% share in 2026, while Online Platforms are projected to expand at a 19.8% CAGR through 2033, reflecting the shift of low-priced attractions into conventional leisure booking systems.
- By Price Tier: The US$ 100,000–1 Million band held 32% share in 2026, while the Under US$ 10,000 band is projected to grow at a 21.3% CAGR through 2033, the only tier with a genuinely broad customer base.
- By Region: North America held 54% share in 2026, while Asia Pacific is projected to expand at an 18.9% CAGR through 2033, driven almost entirely by new ground-based attraction capacity.
Global Zero Gravity Entertainment Market Trends and Insights
Drivers Impact Analysis
| Driver | Impact on CAGR Forecast | Geographic Relevance | Impact Timeline |
| Scarcity pricing in a supply-constrained experience category | High | North America, Europe | Long term ≥4 years |
| Established licensing frameworks for commercial human spaceflight | Medium | North America, Europe | Medium term 2–4 years |
Two conditions, one commercial and one legal, explain the revenue this sector generates.
Scarcity Rather Than Technology Sustains Revenue Per Weightless Passenger
The product sold here is scarcity, not technology, and that is why a market with very few customers produces measurable revenue at all. A parabolic flight seat costs several thousand dollars, a suborbital seat costs hundreds of thousands, and an orbital private astronaut seat costs tens of millions. Because supply is fixed and visible, operators price against exclusivity rather than against cost, which keeps revenue per passenger extraordinarily high.
The mechanism resembles ultra-luxury experiential travel more than leisure. Buyers compare a weightless flight against a private expedition or a rare collectible, not against a theme park ticket, so demand is tied to high-net-worth spending rather than to consumer confidence. Operators reinforce scarcity by capping manifests and selling multi-year waiting positions. The consequence is a business that can be commercially viable at tiny volumes but cannot grow simply by lowering prices.
Licensing Frameworks in Several Countries Have Made Human Spaceflight Legally Routine
Clear licensing has removed the regulatory uncertainty that once prevented commercial sales. In the United States, the Federal Aviation Administration Office of Commercial Space Transportation issues launch and reentry licences under a consolidated framework, and parabolic flight operators work under established aircraft operating certificate arrangements. Operators can therefore quote dates and take deposits with a defined approval path, which is a precondition for selling an experience at all.
Comparable structures now exist elsewhere. The United Kingdom licenses spaceflight activities under the Space Industry Act 2018 and its implementing regulations, while EASA and national authorities in Europe cover the aviation side of parabolic operations. ICAO discussions on how suborbital flight should be classified remain unresolved, which complicates cross-border operations. Even so, the existence of a licence category, insurance requirements and third-party liability rules lets insurers underwrite flights that were previously uninsurable.
Restraints Impact Analysis
| Restraint | Impact on CAGR Forecast | Geographic Relevance | Impact Timeline |
| Severely limited flight supply and persistently high cost | High | Global | Long term ≥4 years |
| Safety framing, insurance, liability and medical screening limits | High | North America, Europe | Long term ≥4 years |
Two constraints keep this category small, and neither is likely to resolve within the forecast period.
Flight Supply Measured in Dozens Per Year Caps Total Achievable Revenue
Supply, not demand, sets the ceiling on this sector. A handful of modified aircraft conduct parabolic campaigns worldwide, suborbital vehicles fly at a cadence counted in flights per year rather than per week, and orbital private missions occur rarely. Each aircraft carries a few dozen passengers per campaign day and each suborbital vehicle carries a small crew. Total annual weightless passengers therefore remain in the low thousands.
Cost has not fallen the way advocates predicted. Vehicle refurbishment, propellant, specialised crew, range coordination and insurance are largely fixed per flight, so unit cost falls only with cadence, and cadence is limited by maintenance, weather and certification. Parabolic operators face aircraft availability and fuel costs that have risen, not fallen. Any vehicle grounding, whether technical or administrative, removes a meaningful share of global capacity for an extended period.
Informed Consent Framing, Liability Cover and Medical Screening Narrow the Eligible Market
The regulatory and insurance structure narrows who can legally and practically buy. In the United States, human spaceflight participants fly under an informed consent regime created by the Commercial Space Launch Amendments Act, rather than under the occupant-safety certification standard applied to commercial aviation. Participants must be informed in writing of risks and acknowledge them. Industry bodies argue this flexibility is necessary while flight experience accumulates; safety advocates argue it leaves passengers under-protected. Both positions are held by serious participants and the matter remains open.
A statutory learning period has restricted occupant-safety rulemaking and has been extended repeatedly by Congress. Separately, launch licences carry third-party liability insurance requirements, operators impose medical screening that excludes some applicants as an operational fact, and the whole category is sensitive to a single adverse event, which would suspend bookings industry-wide.
Market Opportunities
Ground-Based and Simulated Weightlessness Attractions Open a Scalable Consumer Pool
Ground-based and simulated experiences are the only part of this sector with a path to volume, and they open a consumer revenue pool that flight cannot reach. Vertical wind tunnels, drop towers marketed as weightlessness rides, motion-based simulators and virtual reality attractions sell at consumer price points, operate daily rather than seasonally, and can be installed in shopping centres, resorts and existing theme parks. Unit economics resemble conventional attractions.
Attraction builders, wind tunnel manufacturers and venue operators capture most of this, with leisure groups and tourism authorities as the buyers. Demand comes from families and young adults who will never buy a flight, which is a completely different customer base from the one operators serve today. The honest caveat is that these products simulate or approximate weightlessness rather than deliver sustained microgravity, and marketing claims attract consumer protection scrutiny in several jurisdictions.
Research, Training and Media Charters Open Revenue Independent of Tourist Demand
Chartered flights sold to institutions rather than individuals create a revenue pool that does not depend on leisure spending at all. Universities, space agencies, pharmaceutical and materials researchers buy parabolic campaign time to test hardware and run short microgravity experiments. Film production, advertising and broadcast clients buy flights to capture footage obtainable no other way. Astronaut training and corporate incentive programmes fill further capacity.
Parabolic flight operators and experience providers with aircraft access are best placed to capture this, because the same campaign can mix paying researchers with other users. The demand is counter-cyclical to tourism and is typically contracted months ahead, which stabilises utilisation. Government research funding and national space programmes underpin it, and the growing number of countries running microgravity research initiatives widens the buyer base beyond the traditional agencies.
Segment Analysis
By Experience Type: Suborbital Flight Leads Revenue While Simulated Attractions Scale Fastest
Suborbital human spaceflight accounted for 29% of 2026 revenue, the largest single share, because a seat price in the hundreds of thousands produces substantial revenue from very few passengers. Orbital private astronaut missions follow at 24% despite involving only a handful of people, since seats cost tens of millions. Vertical wind tunnel and drop-tower attractions, parabolic flights and neutral buoyancy experiences make up most of the remainder.
Ground-based simulators and virtual reality attractions are the fastest-growing type at a 24.6% CAGR through 2033, from roughly 10% of 2026 revenue. They scale because a venue can be built anywhere, operated daily and staffed without flight crew. The business implication is a widening gap between where the revenue sits today and where unit growth occurs, and vendors serving the two ends share almost no operating requirements.
By Customer Type: Private Individuals Lead While Media Production Grows Fastest
Private individuals represented 57% of 2026 revenue, reflecting a category still built around discretionary purchases by wealthy buyers and, at the lower price points, by ordinary consumers buying wind tunnel and simulator sessions. Research and education customers provide a stable floor through chartered parabolic campaigns, while corporate and brand clients buy flights for incentive programmes and product demonstrations.
Media and film production is the fastest-growing customer type at a 19.4% CAGR through 2033. Production budgets can absorb a charter cost that an individual cannot, and genuinely weightless footage remains difficult to fake convincingly even with modern visual effects. Streaming commissions and advertising campaigns have both used microgravity sequences as a distinguishing feature. The implication is that operators increasingly design manifests around mixed charters, which improves utilisation on aircraft that otherwise fly partly empty.
By Booking Channel: Direct Operator Sales Dominate as Online Platforms Expand
Direct operator sales held 62% of 2026 bookings, by far the largest channel, because high-value flights require medical questionnaires, training schedules, liability acknowledgement and staged payments that no third party handles well. For suborbital and orbital experiences, the sale is effectively a negotiated contract rather than a transaction, and operators keep it in house.
Online platforms are the fastest-growing channel at a 19.8% CAGR through 2033, driven almost entirely by ground-based attractions that behave like ordinary leisure products and sell through activity marketplaces and venue booking systems. Luxury travel agencies and specialist brokers retain a meaningful role for flight experiences, since their clients expect concierge handling. Corporate and institutional contracts cover research and media charters. The implication is channel divergence: the cheap end is commoditising while the expensive end stays relationship-driven.
By Price Tier: The Six-Figure Band Leads Revenue While the Entry Band Grows Fastest
The US$ 100,000–1 Million price tier held 32% of 2026 revenue, the largest band, because suborbital seats sit squarely within it and a small number of sales generate a large sum. Seats above US$ 1 Million, covering orbital missions, contributed 26% from an extremely small number of participants, which makes that band inherently lumpy from year to year.
The under US$ 10,000 tier is the fastest-growing at a 21.3% CAGR through 2033, covering wind tunnel sessions, simulator rides, virtual reality attractions and the cheaper end of parabolic seats. It is the only band with a customer base measured in millions rather than thousands. The implication for operators is that volume growth and revenue concentration will continue to sit in different places, which complicates any single strategy.
Geography Analysis
Which Region Is Leading the Zero Gravity Entertainment Market?
North America leads the zero gravity entertainment market with 54% share in 2026, overwhelmingly from the United States. The country hosts the licensed suborbital launch sites in New Mexico and West Texas, the main commercial parabolic flight operation, the brokers who arrange orbital private astronaut missions, and the largest installed base of vertical wind tunnels. Regulatory clarity is the practical reason: the Federal Aviation Administration licenses launch and reentry, and the informed consent framework gives operators a defined legal basis for selling flights to participants. Concentrations of high-net-worth buyers and a long association between spaceflight and national identity support demand. The limiting factor is the same as everywhere, namely cadence. The clearest regional change is the spread of simulator and wind tunnel venues into ordinary entertainment districts, far from any launch site.
Europe Supplies the Research-Backed Parabolic Flight Base
Europe holds 20% of 2026 revenue, and its position rests on parabolic flight rather than on launch. France hosts the long-running commercial parabolic operation that also serves agency research campaigns, giving the region a stable mixed-use aircraft base. Germany, Switzerland, Belgium and the Netherlands contribute wind tunnel venues and simulator attractions, and the United Kingdom has built a licensing regime under the Space Industry Act 2018 that anticipates commercial human spaceflight even though regular flights have not begun. EASA and national aviation authorities regulate the aircraft side, while ICAO has not settled how suborbital flight should be classified in controlled airspace. Cost and limited aircraft availability constrain growth. The opportunity lies in research charters funded by national and multinational microgravity programmes rather than in tourism.
Which Region Is Growing Fastest in the Zero Gravity Entertainment Market?
Asia Pacific is growing fastest, at an 18.9% CAGR between 2026 and 2033, from an 18% share in 2026. Growth comes almost entirely from ground-based capacity rather than from flight. China and Japan are adding vertical wind tunnels, drop attractions and immersive simulator venues inside large commercial leisure developments, and Singapore, South Korea, Malaysia and Australia host established indoor skydiving operations. India is an emerging venue market with rising disposable income in metropolitan areas. Human spaceflight experiences are not sold commercially in the region, so the revenue mix skews heavily toward low-priced products with high throughput. Regulatory treatment of weightlessness claims in advertising varies by country. The distinctive opportunity is integration of these attractions into mixed-use retail and resort projects, where footfall is already paid for.
Latin America Remains an Early Venue Market With Few Operators
Latin America accounts for 3% of 2026 revenue, the smallest regional share. Activity is confined to a small number of indoor skydiving venues and simulator attractions in Brazil and Mexico, plus occasional outbound sales of flight experiences to wealthy buyers who travel abroad to fly. There is no commercial parabolic or suborbital operation based in the region. Barriers are straightforward. Capital cost for a vertical wind tunnel is high relative to local attraction economics, imported equipment carries duty and currency risk, and the customer base able to pay six-figure seat prices is small and geographically scattered. Certification and insurance for novel attractions can be slow. The realistic opportunity is attraction installation within large urban leisure complexes, where a venue can share infrastructure and marketing with established operators.
Middle East & Africa Builds Attraction Capacity Around Tourism Investment
Middle East & Africa holds 5% of 2026 revenue, concentrated almost entirely in the United Arab Emirates and Qatar, with South Africa contributing a small venue base. Gulf tourism strategies have funded indoor skydiving facilities and immersive simulator attractions as part of wider entertainment districts, and regional carriers bring in visitors who treat such attractions as itinerary items. Sovereign investment in space programmes has also created interest in astronaut training experiences and microgravity research, though these remain limited. Barriers include extreme operating temperatures that raise facility energy costs, a thin local market outside tourism hubs, and the absence of any licensed human spaceflight operation. Across most of Africa, the category effectively does not exist. The opportunity sits with tourism authorities commissioning attractions as anchor tenants in new developments.
Competitive Landscape
The zero gravity entertainment market is highly concentrated, which is a direct consequence of how few organisations can legally and physically fly people in weightlessness. One commercial parabolic operator serves most of the United States market and one serves Europe. Suborbital human spaceflight is offered by a very small number of vehicle operators, and orbital private astronaut missions depend on an even smaller set of launch providers and brokers. By contrast, the ground-based layer is fragmented, with wind tunnel manufacturers, simulator builders and independent venue operators competing in a conventional attractions market. These two layers barely compete with each other.
Competition among flight operators turns on vehicle availability, demonstrated flight record, training programme quality and the credibility of scheduled dates. Customers paying six or seven figures are buying certainty as much as experience, and repeated schedule slippage damages a provider more than price does. Insurance terms and the strength of informed consent documentation also differentiate operators, since brokers and corporate buyers assess liability exposure carefully. In the ground-based layer, competition is ordinary: throughput per hour, capital cost per installation, safety record and the quality of the themed environment.
Strategic activity in the flight layer centres on building capacity rather than on acquisitions, because the binding constraint is vehicles and aircraft. Providers pursue longer-term arrangements with research agencies and media clients to underwrite utilisation. In the attractions layer, manufacturers partner with resort and leisure developers to place installations where footfall already exists.
Strategic direction across the sector is shifting toward diversifying away from individual tourists, who are too few to sustain capacity on their own.
Zero Gravity Entertainment Industry Leaders
- Zero Gravity Corporation
- Novespace SAS
- Blue Origin LLC
- Virgin Galactic Holdings, Inc.
- Space Adventures, Inc.
Recent Industry Developments
- March 2021: The Federal Aviation Administration consolidated launch and reentry licensing rule took effect, replacing separate licence categories with a single performance-based framework – it gave operators one predictable approval path, which is what allows dated flight offers to be sold.
- July 2021: The United Kingdom Space Industry Regulations came into force under the Space Industry Act 2018, completing the licensing framework for spaceflight activities and spaceports – the first full national regime outside the United States designed to accommodate commercial human spaceflight.
- December 2022: The United States Congress extended the statutory learning period restricting occupant-safety rulemaking for commercial human spaceflight through appropriations legislation, with further short extensions following – it preserves the informed consent model that current commercial sales depend on, and its continuation is actively disputed.
Companies Covered in the Report
- Zero Gravity Corporation
- Novespace SAS
- Blue Origin LLC
- Virgin Galactic Holdings, Inc.
- Space Adventures, Inc.
- Axiom Space, Inc.
- Vast Space LLC
- Space Exploration Technologies Corp.
- iFLY Holdings LLC
- Aerodium Technologies
- Blue Abyss Ltd.
- Incredible Adventures, Inc.
- Orbite
Zero Gravity Entertainment Market Report Scope
This report covers commercial experiences whose product is weightlessness or its simulation: parabolic flights, suborbital and orbital human spaceflight sold as an experience, neutral buoyancy analogues, wind tunnel and drop-tower attractions marketed as weightlessness, ground-based simulators and virtual reality venues, and microgravity media and event services. Government astronaut programmes and launch vehicle manufacturing are excluded. The base year is 2025 and the forecast period runs from 2026 to 2033, in US$ Billion.
Experience Type
- Parabolic Flight Experiences
- Suborbital Human Spaceflight
- Orbital Private Astronaut Missions
- Neutral Buoyancy and Underwater Analogue Experiences
- Vertical Wind Tunnel and Drop-Tower Attractions
- Ground-Based Simulators and Virtual Reality Attractions
Customer Type
- Private Individuals
- Corporate and Brand Clients
- Media and Film Production
- Research and Education
Booking Channel
- Direct Operator Sales
- Luxury Travel Agencies and Specialist Brokers
- Online Platforms
- Corporate and Institutional Contracts
Price Tier
- Under US$ 10,000
- US$ 10,000–100,000
- US$ 100,000–1 Million
- Above US$ 1 Million
Regions
- North America
- Europe
- Asia Pacific
- Latin America
- Middle East & Africa
Key Questions Answered in the Report
How big is the zero gravity entertainment market in 2026?
The market is valued at US$ 0.3 billion in 2026, a genuinely tiny figure that reflects how few people experience commercial weightlessness each year.
What is the forecast size and CAGR of the zero gravity entertainment market?
Revenue is projected to reach US$ 0.8 billion by 2033 at a 15.0% CAGR, an absolute dollar opportunity of US$ 0.5 billion.
Which experience type leads the zero gravity entertainment market?
Suborbital human spaceflight leads with 29% share in 2026, because seat prices in the hundreds of thousands generate large revenue from few passengers.
Which segment is growing fastest in zero gravity entertainment?
Ground-based simulators and virtual reality attractions grow fastest at a 24.6% CAGR, since venues can be replicated cheaply and operated daily.
Which region holds the largest zero gravity entertainment market share?
North America holds 54% share in 2026, reflecting licensed launch sites, the main parabolic operator and the largest wind tunnel base.
1. Executive Summary
1.1. Global Zero Gravity Entertainment Market Snapshot
1.2. Future Projections
1.3. Key Report Takeaways
1.4. Regional Snapshot
2. Market Overview
2.1. Market Definition and Report Scope
2.2. Historical Trends 2020–2025
2.3. Market Dynamics
2.3.1. Drivers
2.3.1.1. Scarcity Rather Than Technology Sustains Revenue Per Weightless Passenger
2.3.1.2. Licensing Frameworks in Several Countries Have Made Human Spaceflight Legally Routine
2.3.2. Restraints
2.3.2.1. Flight Supply Measured in Dozens Per Year Caps Total Achievable Revenue
2.3.2.2. Informed Consent Framing, Liability Cover and Medical Screening Narrow the Eligible Market
2.3.3. Market Opportunities
2.3.3.1. Ground-Based and Simulated Weightlessness Attractions Open a Scalable Consumer Pool
2.3.3.2. Research, Training and Media Charters Open Revenue Independent of Tourist Demand
3. Global Zero Gravity Entertainment Market Outlook, 2020–2033
3.1. Global Zero Gravity Entertainment Market Outlook, by Experience Type, Value (US$ Billion), 2020–2033
3.1.1. Parabolic Flight Experiences
3.1.2. Suborbital Human Spaceflight
3.1.3. Orbital Private Astronaut Missions
3.1.4. Neutral Buoyancy and Underwater Analogue Experiences
3.1.5. Vertical Wind Tunnel and Drop-Tower Attractions
3.1.6. Ground-Based Simulators and Virtual Reality Attractions
3.2. Global Zero Gravity Entertainment Market Outlook, by Customer Type, Value (US$ Billion), 2020–2033
3.2.1. Private Individuals
3.2.2. Corporate and Brand Clients
3.2.3. Media and Film Production
3.2.4. Research and Education
3.3. Global Zero Gravity Entertainment Market Outlook, by Booking Channel, Value (US$ Billion), 2020–2033
3.3.1. Direct Operator Sales
3.3.2. Luxury Travel Agencies and Specialist Brokers
3.3.3. Online Platforms
3.3.4. Corporate and Institutional Contracts
3.4. Global Zero Gravity Entertainment Market Outlook, by Price Tier, Value (US$ Billion), 2020–2033
3.4.1. Under US$ 10,000
3.4.2. US$ 10,000–100,000
3.4.3. US$ 100,000–1 Million
3.4.4. Above US$ 1 Million
3.5. Global Zero Gravity Entertainment Market Outlook, by Region, Value (US$ Billion), 2020–2033
3.5.1. North America
3.5.2. Europe
3.5.3. Asia Pacific
3.5.4. Latin America
3.5.5. Middle East & Africa
4. North America Zero Gravity Entertainment Market Outlook, 2020–2033
4.1. North America Zero Gravity Entertainment Market Outlook, by Experience Type, Value (US$ Billion), 2020–2033
4.1.1. Parabolic Flight Experiences
4.1.2. Suborbital Human Spaceflight
4.1.3. Orbital Private Astronaut Missions
4.1.4. Neutral Buoyancy and Underwater Analogue Experiences
4.1.5. Vertical Wind Tunnel and Drop-Tower Attractions
4.1.6. Ground-Based Simulators and Virtual Reality Attractions
4.2. North America Zero Gravity Entertainment Market Outlook, by Customer Type, Value (US$ Billion), 2020–2033
4.2.1. Private Individuals
4.2.2. Corporate and Brand Clients
4.2.3. Media and Film Production
4.2.4. Research and Education
4.3. North America Zero Gravity Entertainment Market Outlook, by Booking Channel, Value (US$ Billion), 2020–2033
4.3.1. Direct Operator Sales
4.3.2. Luxury Travel Agencies and Specialist Brokers
4.3.3. Online Platforms
4.3.4. Corporate and Institutional Contracts
4.4. North America Zero Gravity Entertainment Market Outlook, by Price Tier, Value (US$ Billion), 2020–2033
4.4.1. Under US$ 10,000
4.4.2. US$ 10,000–100,000
4.4.3. US$ 100,000–1 Million
4.4.4. Above US$ 1 Million
4.5. North America Zero Gravity Entertainment Market Outlook, by Country, Value (US$ Billion), 2020–2033
4.5.1. United States Zero Gravity Entertainment Market Outlook, by Experience Type, 2020–2033
4.5.2. United States Zero Gravity Entertainment Market Outlook, by Customer Type, 2020–2033
4.5.3. United States Zero Gravity Entertainment Market Outlook, by Booking Channel, 2020–2033
4.5.4. United States Zero Gravity Entertainment Market Outlook, by Price Tier, 2020–2033
5. Europe Zero Gravity Entertainment Market Outlook, 2020–2033
5.1. Europe Zero Gravity Entertainment Market Outlook, by Experience Type, Value (US$ Billion), 2020–2033
5.1.1. Parabolic Flight Experiences
5.1.2. Suborbital Human Spaceflight
5.1.3. Orbital Private Astronaut Missions
5.1.4. Neutral Buoyancy and Underwater Analogue Experiences
5.1.5. Vertical Wind Tunnel and Drop-Tower Attractions
5.1.6. Ground-Based Simulators and Virtual Reality Attractions
5.2. Europe Zero Gravity Entertainment Market Outlook, by Customer Type, Value (US$ Billion), 2020–2033
5.2.1. Private Individuals
5.2.2. Corporate and Brand Clients
5.2.3. Media and Film Production
5.2.4. Research and Education
5.3. Europe Zero Gravity Entertainment Market Outlook, by Booking Channel, Value (US$ Billion), 2020–2033
5.3.1. Direct Operator Sales
5.3.2. Luxury Travel Agencies and Specialist Brokers
5.3.3. Online Platforms
5.3.4. Corporate and Institutional Contracts
5.4. Europe Zero Gravity Entertainment Market Outlook, by Price Tier, Value (US$ Billion), 2020–2033
5.4.1. Under US$ 10,000
5.4.2. US$ 10,000–100,000
5.4.3. US$ 100,000–1 Million
5.4.4. Above US$ 1 Million
5.5. Europe Zero Gravity Entertainment Market Outlook, by Country, Value (US$ Billion), 2020–2033
5.5.1. France Zero Gravity Entertainment Market Outlook, by Experience Type, 2020–2033
5.5.2. France Zero Gravity Entertainment Market Outlook, by Customer Type, 2020–2033
5.5.3. France Zero Gravity Entertainment Market Outlook, by Booking Channel, 2020–2033
5.5.4. France Zero Gravity Entertainment Market Outlook, by Price Tier, 2020–2033
5.5.5. Germany Zero Gravity Entertainment Market Outlook, by Experience Type, 2020–2033
5.5.6. Germany Zero Gravity Entertainment Market Outlook, by Customer Type, 2020–2033
5.5.7. Germany Zero Gravity Entertainment Market Outlook, by Booking Channel, 2020–2033
5.5.8. Germany Zero Gravity Entertainment Market Outlook, by Price Tier, 2020–2033
5.5.9. Switzerland Zero Gravity Entertainment Market Outlook, by Experience Type, 2020–2033
5.5.10. Switzerland Zero Gravity Entertainment Market Outlook, by Customer Type, 2020–2033
5.5.11. Switzerland Zero Gravity Entertainment Market Outlook, by Booking Channel, 2020–2033
5.5.12. Switzerland Zero Gravity Entertainment Market Outlook, by Price Tier, 2020–2033
5.5.13. Belgium Zero Gravity Entertainment Market Outlook, by Experience Type, 2020–2033
5.5.14. Belgium Zero Gravity Entertainment Market Outlook, by Customer Type, 2020–2033
5.5.15. Belgium Zero Gravity Entertainment Market Outlook, by Booking Channel, 2020–2033
5.5.16. Belgium Zero Gravity Entertainment Market Outlook, by Price Tier, 2020–2033
5.5.17. Netherlands Zero Gravity Entertainment Market Outlook, by Experience Type, 2020–2033
5.5.18. Netherlands Zero Gravity Entertainment Market Outlook, by Customer Type, 2020–2033
5.5.19. Netherlands Zero Gravity Entertainment Market Outlook, by Booking Channel, 2020–2033
5.5.20. Netherlands Zero Gravity Entertainment Market Outlook, by Price Tier, 2020–2033
5.5.21. United Kingdom Zero Gravity Entertainment Market Outlook, by Experience Type, 2020–2033
5.5.22. United Kingdom Zero Gravity Entertainment Market Outlook, by Customer Type, 2020–2033
5.5.23. United Kingdom Zero Gravity Entertainment Market Outlook, by Booking Channel, 2020–2033
5.5.24. United Kingdom Zero Gravity Entertainment Market Outlook, by Price Tier, 2020–2033
6. Asia Pacific Zero Gravity Entertainment Market Outlook, 2020–2033
6.1. Asia Pacific Zero Gravity Entertainment Market Outlook, by Experience Type, Value (US$ Billion), 2020–2033
6.1.1. Parabolic Flight Experiences
6.1.2. Suborbital Human Spaceflight
6.1.3. Orbital Private Astronaut Missions
6.1.4. Neutral Buoyancy and Underwater Analogue Experiences
6.1.5. Vertical Wind Tunnel and Drop-Tower Attractions
6.1.6. Ground-Based Simulators and Virtual Reality Attractions
6.2. Asia Pacific Zero Gravity Entertainment Market Outlook, by Customer Type, Value (US$ Billion), 2020–2033
6.2.1. Private Individuals
6.2.2. Corporate and Brand Clients
6.2.3. Media and Film Production
6.2.4. Research and Education
6.3. Asia Pacific Zero Gravity Entertainment Market Outlook, by Booking Channel, Value (US$ Billion), 2020–2033
6.3.1. Direct Operator Sales
6.3.2. Luxury Travel Agencies and Specialist Brokers
6.3.3. Online Platforms
6.3.4. Corporate and Institutional Contracts
6.4. Asia Pacific Zero Gravity Entertainment Market Outlook, by Price Tier, Value (US$ Billion), 2020–2033
6.4.1. Under US$ 10,000
6.4.2. US$ 10,000–100,000
6.4.3. US$ 100,000–1 Million
6.4.4. Above US$ 1 Million
6.5. Asia Pacific Zero Gravity Entertainment Market Outlook, by Country, Value (US$ Billion), 2020–2033
6.5.1. China Zero Gravity Entertainment Market Outlook, by Experience Type, 2020–2033
6.5.2. China Zero Gravity Entertainment Market Outlook, by Customer Type, 2020–2033
6.5.3. China Zero Gravity Entertainment Market Outlook, by Booking Channel, 2020–2033
6.5.4. China Zero Gravity Entertainment Market Outlook, by Price Tier, 2020–2033
6.5.5. Japan Zero Gravity Entertainment Market Outlook, by Experience Type, 2020–2033
6.5.6. Japan Zero Gravity Entertainment Market Outlook, by Customer Type, 2020–2033
6.5.7. Japan Zero Gravity Entertainment Market Outlook, by Booking Channel, 2020–2033
6.5.8. Japan Zero Gravity Entertainment Market Outlook, by Price Tier, 2020–2033
6.5.9. Singapore Zero Gravity Entertainment Market Outlook, by Experience Type, 2020–2033
6.5.10. Singapore Zero Gravity Entertainment Market Outlook, by Customer Type, 2020–2033
6.5.11. Singapore Zero Gravity Entertainment Market Outlook, by Booking Channel, 2020–2033
6.5.12. Singapore Zero Gravity Entertainment Market Outlook, by Price Tier, 2020–2033
6.5.13. South Korea Zero Gravity Entertainment Market Outlook, by Experience Type, 2020–2033
6.5.14. South Korea Zero Gravity Entertainment Market Outlook, by Customer Type, 2020–2033
6.5.15. South Korea Zero Gravity Entertainment Market Outlook, by Booking Channel, 2020–2033
6.5.16. South Korea Zero Gravity Entertainment Market Outlook, by Price Tier, 2020–2033
6.5.17. Malaysia Zero Gravity Entertainment Market Outlook, by Experience Type, 2020–2033
6.5.18. Malaysia Zero Gravity Entertainment Market Outlook, by Customer Type, 2020–2033
6.5.19. Malaysia Zero Gravity Entertainment Market Outlook, by Booking Channel, 2020–2033
6.5.20. Malaysia Zero Gravity Entertainment Market Outlook, by Price Tier, 2020–2033
6.5.21. Australia Zero Gravity Entertainment Market Outlook, by Experience Type, 2020–2033
6.5.22. Australia Zero Gravity Entertainment Market Outlook, by Customer Type, 2020–2033
6.5.23. Australia Zero Gravity Entertainment Market Outlook, by Booking Channel, 2020–2033
6.5.24. Australia Zero Gravity Entertainment Market Outlook, by Price Tier, 2020–2033
6.5.25. India Zero Gravity Entertainment Market Outlook, by Experience Type, 2020–2033
6.5.26. India Zero Gravity Entertainment Market Outlook, by Customer Type, 2020–2033
6.5.27. India Zero Gravity Entertainment Market Outlook, by Booking Channel, 2020–2033
6.5.28. India Zero Gravity Entertainment Market Outlook, by Price Tier, 2020–2033
7. Latin America Zero Gravity Entertainment Market Outlook, 2020–2033
7.1. Latin America Zero Gravity Entertainment Market Outlook, by Experience Type, Value (US$ Billion), 2020–2033
7.1.1. Parabolic Flight Experiences
7.1.2. Suborbital Human Spaceflight
7.1.3. Orbital Private Astronaut Missions
7.1.4. Neutral Buoyancy and Underwater Analogue Experiences
7.1.5. Vertical Wind Tunnel and Drop-Tower Attractions
7.1.6. Ground-Based Simulators and Virtual Reality Attractions
7.2. Latin America Zero Gravity Entertainment Market Outlook, by Customer Type, Value (US$ Billion), 2020–2033
7.2.1. Private Individuals
7.2.2. Corporate and Brand Clients
7.2.3. Media and Film Production
7.2.4. Research and Education
7.3. Latin America Zero Gravity Entertainment Market Outlook, by Booking Channel, Value (US$ Billion), 2020–2033
7.3.1. Direct Operator Sales
7.3.2. Luxury Travel Agencies and Specialist Brokers
7.3.3. Online Platforms
7.3.4. Corporate and Institutional Contracts
7.4. Latin America Zero Gravity Entertainment Market Outlook, by Price Tier, Value (US$ Billion), 2020–2033
7.4.1. Under US$ 10,000
7.4.2. US$ 10,000–100,000
7.4.3. US$ 100,000–1 Million
7.4.4. Above US$ 1 Million
7.5. Latin America Zero Gravity Entertainment Market Outlook, by Country, Value (US$ Billion), 2020–2033
7.5.1. Brazil Zero Gravity Entertainment Market Outlook, by Experience Type, 2020–2033
7.5.2. Brazil Zero Gravity Entertainment Market Outlook, by Customer Type, 2020–2033
7.5.3. Brazil Zero Gravity Entertainment Market Outlook, by Booking Channel, 2020–2033
7.5.4. Brazil Zero Gravity Entertainment Market Outlook, by Price Tier, 2020–2033
7.5.5. Mexico Zero Gravity Entertainment Market Outlook, by Experience Type, 2020–2033
7.5.6. Mexico Zero Gravity Entertainment Market Outlook, by Customer Type, 2020–2033
7.5.7. Mexico Zero Gravity Entertainment Market Outlook, by Booking Channel, 2020–2033
7.5.8. Mexico Zero Gravity Entertainment Market Outlook, by Price Tier, 2020–2033
8. Middle East & Africa Zero Gravity Entertainment Market Outlook, 2020–2033
8.1. Middle East & Africa Zero Gravity Entertainment Market Outlook, by Experience Type, Value (US$ Billion), 2020–2033
8.1.1. Parabolic Flight Experiences
8.1.2. Suborbital Human Spaceflight
8.1.3. Orbital Private Astronaut Missions
8.1.4. Neutral Buoyancy and Underwater Analogue Experiences
8.1.5. Vertical Wind Tunnel and Drop-Tower Attractions
8.1.6. Ground-Based Simulators and Virtual Reality Attractions
8.2. Middle East & Africa Zero Gravity Entertainment Market Outlook, by Customer Type, Value (US$ Billion), 2020–2033
8.2.1. Private Individuals
8.2.2. Corporate and Brand Clients
8.2.3. Media and Film Production
8.2.4. Research and Education
8.3. Middle East & Africa Zero Gravity Entertainment Market Outlook, by Booking Channel, Value (US$ Billion), 2020–2033
8.3.1. Direct Operator Sales
8.3.2. Luxury Travel Agencies and Specialist Brokers
8.3.3. Online Platforms
8.3.4. Corporate and Institutional Contracts
8.4. Middle East & Africa Zero Gravity Entertainment Market Outlook, by Price Tier, Value (US$ Billion), 2020–2033
8.4.1. Under US$ 10,000
8.4.2. US$ 10,000–100,000
8.4.3. US$ 100,000–1 Million
8.4.4. Above US$ 1 Million
8.5. Middle East & Africa Zero Gravity Entertainment Market Outlook, by Country, Value (US$ Billion), 2020–2033
8.5.1. United Arab Emirates Zero Gravity Entertainment Market Outlook, by Experience Type, 2020–2033
8.5.2. United Arab Emirates Zero Gravity Entertainment Market Outlook, by Customer Type, 2020–2033
8.5.3. United Arab Emirates Zero Gravity Entertainment Market Outlook, by Booking Channel, 2020–2033
8.5.4. United Arab Emirates Zero Gravity Entertainment Market Outlook, by Price Tier, 2020–2033
8.5.5. Qatar Zero Gravity Entertainment Market Outlook, by Experience Type, 2020–2033
8.5.6. Qatar Zero Gravity Entertainment Market Outlook, by Customer Type, 2020–2033
8.5.7. Qatar Zero Gravity Entertainment Market Outlook, by Booking Channel, 2020–2033
8.5.8. Qatar Zero Gravity Entertainment Market Outlook, by Price Tier, 2020–2033
8.5.9. South Africa Zero Gravity Entertainment Market Outlook, by Experience Type, 2020–2033
8.5.10. South Africa Zero Gravity Entertainment Market Outlook, by Customer Type, 2020–2033
8.5.11. South Africa Zero Gravity Entertainment Market Outlook, by Booking Channel, 2020–2033
8.5.12. South Africa Zero Gravity Entertainment Market Outlook, by Price Tier, 2020–2033
9. Competitive Landscape
9.1. Market Concentration and Industry Leaders
9.2. Competitive Differentiation
9.3. Strategic Moves and Market Direction
9.4. Recent Industry Developments
9.5. Company Profiles
9.5.1. Zero Gravity Corporation
9.5.2. Novespace SAS
9.5.3. Blue Origin LLC
9.5.4. Virgin Galactic Holdings, Inc.
9.5.5. Space Adventures, Inc.
9.5.6. Axiom Space, Inc.
9.5.7. Vast Space LLC
9.5.8. Space Exploration Technologies Corp.
9.5.9. iFLY Holdings LLC
9.5.10. Aerodium Technologies
9.5.11. Blue Abyss Ltd.
9.5.12. Incredible Adventures, Inc.
9.5.13. Orbite
10. Appendix
10.1. Research Methodology
10.2. Report Assumptions
10.3. Acronyms and Abbreviations
| Experience Type | Parabolic Flight Experiences, Suborbital Human Spaceflight, Orbital Private Astronaut Missions, Neutral Buoyancy and Underwater Analogue Experiences, Vertical Wind Tunnel and Drop-Tower Attractions, Ground-Based Simulators and Virtual Reality Attractions |
| Customer Type | Private Individuals, Corporate and Brand Clients, Media and Film Production, Research and Education |
| Booking Channel | Direct Operator Sales, Luxury Travel Agencies and Specialist Brokers, Online Platforms, Corporate and Institutional Contracts |
| Price Tier | Under US$ 10,000, US$ 10,000–100,000, US$ 100,000–1 Million, Above US$ 1 Million |
| Regions | North America, Europe, Asia Pacific, Latin America, Middle East & Africa |
Our Research Methodology
Considering the volatility of business today, traditional approaches to strategizing a game plan can be unfruitful if not detrimental. True ambiguity is no way to determine a forecast. A myriad of predetermined factors must be accounted for such as the degree of risk involved, the magnitude of circumstances, as well as conditions or consequences that are not known or unpredictable. To circumvent binary views that cast uncertainty, the application of market research intelligence to strategically posture, move, and enable actionable outcomes is necessary.
View Methodology
Quality Assured
Rigorous Validation Process

Confidentiality Assured
End-to-end Data Security

Custom Research Services
Tailored To Your Objectives
FAQs
The market is valued at US$ 0.3 billion in 2026, a genuinely tiny figure that reflects how few people experience commercial weightlessness each year.
Revenue is projected to reach US$ 0.8 billion by 2033 at a 15.0% CAGR, an absolute dollar opportunity of US$ 0.5 billion.
Suborbital human spaceflight leads with 29% share in 2026, because seat prices in the hundreds of thousands generate large revenue from few passengers.
Ground-based simulators and virtual reality attractions grow fastest at a 24.6% CAGR, since venues can be replicated cheaply and operated daily.
North America holds 54% share in 2026, reflecting licensed launch sites, the main parabolic operator and the largest wind tunnel base.
Related Reports
Veterinary Wearable Devices Market Size, Share, Insights, Competitive Landscape, and Forecast 2026 to 2033
The veterinary wearable devices market is projected to grow from US$3.10 billion in 2026 to US$7.69 billion by 2033, at a 13.9% CAGR, led by pet and herd monitoring.
Expansion Joints Market Size, Share, Insights, Competitive Landscape, and Forecast 2026 to 2033
The expansion joints market is projected to grow from US$1,285.1 million in 2026 to US$1,691.1 million by 2033, at a CAGR of 4.0%, led by energy investment.
Tankless Water Heater Market Size, Share, Insights, Competitive Landscape, and Forecast 2026 to 2033
The tankless water heater market is projected to grow from US$5.60 billion in 2026 to US$10.37 billion by 2033, at a 9.2% CAGR, driven by efficient heating.
Plus Size Womens Clothing Market Size, Share, Insights, Competitive Landscape, and Forecast 2026 to 2033
Plus size womens clothing market to reach US$344.91 Bn by 2033 from US$219.06 Bn in 2026 at 6.7% CAGR. Explore products, price ranges, age groups and regions.
Plumbing Fixtures Market Size, Share, Insights, Competitive Landscape, and Forecast 2026 to 2033
Plumbing fixtures market to grow from US$101.09 Bn in 2026 to US$135.91 Bn by 2033 at 4.3% CAGR. Explore products, technology, applications and regions.
Landscaping Products Market Size, Share, Insights, Competitive Landscape, and Forecast 2026 to 2033
Explore the landscaping products market, reaching US$ 187.02 billion by 2033 at 6.8% CAGR, with product, power source and regional insights.