



Expansion Joints Market
Expansion Joints Market Size, Share, Insights, Competitive Landscape, and Forecast 2026 to 2033
How Fast Is the Expansion Joints Market Growing?
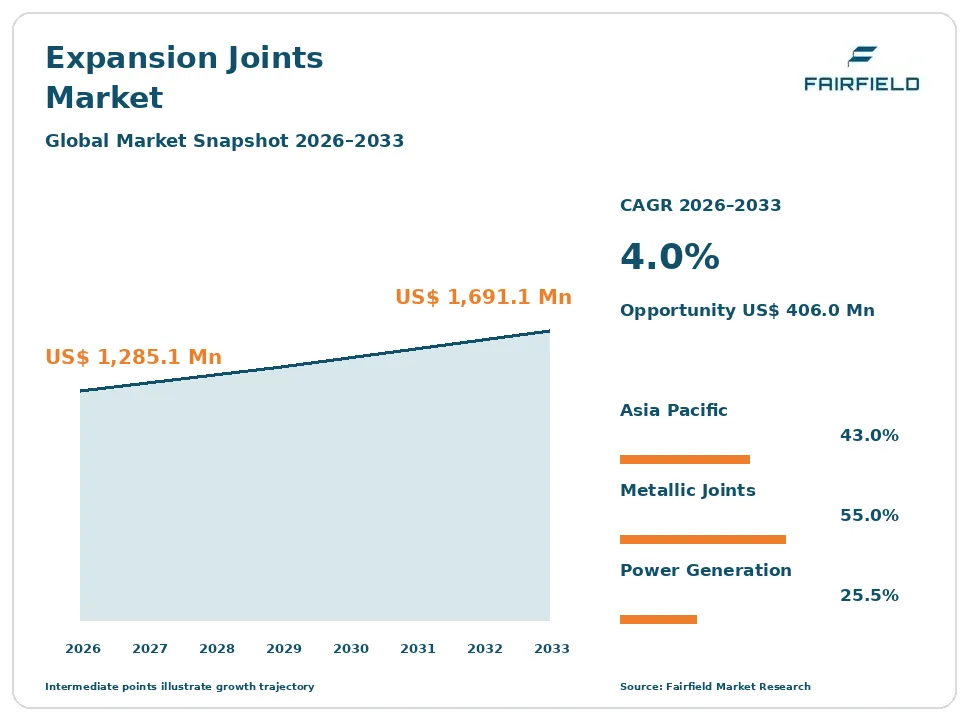
The global expansion joints market size is expected to be valued at US$ 1,285.1 million in 2026 and projected to reach US$ 1,691.1 million by 2033, growing at a CAGR of 4.0% between 2026 and 2033.
Between 2020 and 2025, the market grew at a CAGR of about 3.5%, supported by steady spending on power plants, refineries, chemical plants, and building projects. Expansion joints absorb thermal expansion, vibration, and movement in piping systems, ducts, and structures, preventing cracks and leaks. Three factors now drive growth: investment in power generation and district heating networks, maintenance and replacement in aging industrial plants, and growth in infrastructure and commercial construction. The market is shifting toward metallic expansion joints made from high-grade alloys for high temperatures and pressures, lighter fabric expansion joints for ducts and exhaust systems, and new designs for hydrogen, LNG, and carbon capture plants. Manufacturers are also opening new plants in India and China to serve growing local demand and shorten delivery times.
Key Report Takeaways
- By Material: Metallic held 55.0% share in 2026, while Fabric is projected to expand at a 5.2% CAGR through 2033, driven by gas turbine, flue gas, and HVAC duct applications.
- By Equipment Type: Axial held 30.0% share in 2026, while Angular is projected to expand at a 4.9% CAGR through 2033, driven by complex piping layouts in process plants.
- By End Use: Power Generation held 25.5% share in 2026, while District Heating is projected to expand at a 7.0% CAGR through 2033, driven by heat network expansion in Europe and China.
- By Region: Asia Pacific held 43.0% share in 2026, while India is projected to expand at a 6.1% CAGR through 2033, driven by refinery, power, and metro rail projects.
Global Expansion Joints Market Trends and Insights
Drivers Impact Analysis
| Driver | Impact on CAGR Forecast | Geographic Relevance | Impact Timeline |
| Investment in power, energy, and heating networks | High | Asia Pacific, Europe, Middle East & Africa | Long term (≥4 years) |
| Maintenance and replacement in aging plants | Medium | North America, Europe | Medium term (2-4 years) |
Two drivers carry the strongest influence on expansion joints demand during the forecast period.
Energy Investment Is Driving the Expansion Joints Market
Investment in power, energy, and heating networks is the strongest driver of the expansion joints market. Every power plant, refinery, and heat network needs joints to handle heat and movement.
The mechanism is the physics of hot pipes. Steam, gas, and hot water lines expand as they heat up and shrink as they cool, and without joints, pipes and equipment would crack. China and India continue to build power plants, refineries, and chemical complexes. Saudi Arabia, the United Arab Emirates, and Qatar are expanding gas processing and petrochemical capacity. Europe is extending district heating networks to cut emissions. Nuclear, solar thermal, and waste-to-energy plants also use large numbers of expansion joints. New LNG terminals and hydrogen projects need joints rated for very low temperatures. These factors keep order books steady for manufacturers.
Plant Maintenance Is Expanding the Expansion Joints Market
Maintenance and replacement in aging industrial plants are expanding the expansion joints market. Joints wear out and must be replaced over time.
The cause is the age of industrial infrastructure. Many power plants, refineries, and chemical plants in North America and Europe were built decades ago, and their joints face fatigue, corrosion, and leaks. Plant operators replace joints during planned shutdowns to avoid costly failures and safety incidents. Stricter safety and emissions rules require leak-free systems. Upgrades to plants, such as switching fuels or adding carbon capture, also need new joints. The aftermarket provides steady revenue that is less affected by new construction cycles. These trends support stable demand for replacement and repair services.
Restraints Impact Analysis
| Restraint | Impact on CAGR Forecast | Geographic Relevance | Impact Timeline |
| Raw material price swings | Medium | Global | Short term (≤2 years) |
| Slowdown in fossil fuel projects | Medium | North America, Europe | Long term (≥4 years) |
Two restraints limit how quickly the expansion joints market grows.
Raw Material Costs Slow the Expansion Joints Market
Raw material price swings slow the expansion joints market. Stainless steel, nickel alloys, and rubber make up a large share of product costs.
The specific causes are volatile commodity markets. Nickel, chromium, and stainless steel prices have swung sharply since 2021 due to supply disruptions and trade measures. High-performance alloys, such as Inconel and Hastelloy, are especially expensive. Manufacturers often sign fixed-price contracts for large projects, so cost spikes can squeeze margins. Tariffs on steel in the United States and other countries add uncertainty. Smaller manufacturers have less buying power to manage these swings and may lose bids to larger rivals. Delays in steel deliveries can also push back project schedules. These factors raise prices and slow some orders, especially in price-sensitive markets.
Fossil Fuel Slowdown Restricts the Expansion Joints Market
A slowdown in fossil fuel projects restricts the expansion joints market. Coal and oil projects have long been major buyers of expansion joints.
The underlying causes are climate policy and changing energy investment. Many countries in Europe and North America are closing coal plants and limiting new refineries. Banks and investors are cutting funding for fossil fuel projects. Fewer new large plants mean fewer large orders for high-value joints. Renewable energy sources such as wind and solar photovoltaic use fewer expansion joints than thermal plants. Manufacturers must shift toward hydrogen, nuclear, and district heating to offset lost demand. Some oil and gas companies have also cut capital budgets when prices fell. Low-cost suppliers in China add price pressure on global firms. These factors slow growth in mature markets.
Market Opportunities
Hydrogen and LNG Projects Open a Specialized Revenue Pool
Hydrogen and LNG projects open a specialized revenue pool in the expansion joints market. These projects need joints that work at very low temperatures and resist leaks.
Manufacturers with advanced engineering and testing can capture this opportunity. Hydrogen can make some metals brittle, so joints need special materials and designs. LNG terminals handle temperatures below minus 160 degrees Celsius. Hydrogen pipelines, electrolyzers, and ammonia plants are being planned in Europe, Australia, Saudi Arabia, and Japan. ditec, part of ELAFLEX, has developed expansion joints for hydrogen. Specialized products carry higher margins and long-term service contracts. Carbon capture plants and ammonia shipping terminals add further demand for joints that handle corrosive and cold fluids. Testing and certification capabilities are a key advantage.
District Heating Networks Create a Growing Revenue Pool
District heating networks create a growing revenue pool in the expansion joints market. Cities are expanding heat networks to cut emissions from buildings.
Manufacturers serving pipe network builders can capture this opportunity. District heating pipes carry hot water across cities and need many joints to handle thermal expansion. Denmark, Germany, Poland, Sweden, and China have large networks, and the United Kingdom is building new ones. Waste heat from data centers and industry is being fed into networks. Indutrade’s purchase of Belman in 2026 shows interest in this segment. This area is expected to grow at about 7.0% a year. Joints for district heating are often supplied with pre-insulated pipes, so partnerships with pipe makers help win contracts. Replacing older networks also adds steady repair demand.
Segment Analysis
By Material: Metallic Leads While Fabric Grows Fastest
Metallic held 55.0% share in 2026. Metallic expansion joints made from stainless steel and nickel alloys handle high temperatures and pressures in steam lines, refineries, chemical plants, and power stations. They last long and meet strict safety codes. Witzenmann Group, EagleBurgmann, BOA Group, and Senior Flexonics lead in metal bellows.
Fabric is the fastest-growing material, expanding at a 5.2% CAGR through 2033. Fabric expansion joints made from layered high-temperature materials are lightweight and flexible, and they handle large movements in ducts. They are used in gas turbine exhausts, flue gas systems, and cement plants. For the market, fabric growth adds demand in power and emissions control. Rubber joints serve water and wastewater systems, pumps, and HVAC equipment where noise and vibration control matter.
By Equipment Type: Axial Leads While Angular Grows Fastest
Axial held 30.0% share in 2026. Axial expansion joints absorb movement along the length of a pipe and are the simplest and most common type. They are widely used in straight piping systems, district heating lines, and HVAC systems. Their low cost and simple installation make them a standard choice for contractors.
Angular is the fastest-growing equipment type, expanding at a 4.9% CAGR through 2033. Angular, or hinged, joints allow bending movement in one plane, and they are often used in pairs or sets to handle complex pipe routes. Process plants with tight layouts use them widely. Universal and lateral joints handle combined movements in larger systems. For the market, angular growth adds higher-value engineered products.
By End Use: Power Generation Leads While District Heating Grows Fastest
Power Generation held 25.5% share in 2026. Coal, gas, nuclear, and waste-to-energy plants use expansion joints in steam lines, turbine exhausts, condensers, and ducts. New gas and nuclear plants in Asia Pacific and Middle East & Africa drive orders, while older plants need replacements.
District Heating is the fastest-growing end use, expanding at a 7.0% CAGR through 2033. Cities in Europe and China are expanding hot water networks to replace individual gas boilers. Long pipe runs need many joints to handle thermal expansion. Joints for these networks must last decades with little maintenance. For the market, district heating adds steady demand linked to climate policy.
Geography Analysis
North America Advances the Expansion Joints Market Through Plant Maintenance
North America holds about 22% of the expansion joints market. The United States has a large base of refineries, chemical plants, power stations, and commercial buildings that need regular joint replacement. LNG export terminals in Texas and Louisiana use large numbers of cryogenic joints. Canada adds demand from oil sands and power projects. Senior Flexonics, Hyspan, Unaflex, and Balco are active here. Building codes for earthquakes and fire drive demand for architectural joints. Key barriers include steel tariffs. One change shaping the region is fire-rated joint systems for multi-story wood buildings, along with new data center cooling projects.
Europe Builds the Expansion Joints Market Through District Heating
Europe holds about 18.5% of the expansion joints market. Germany hosts Witzenmann Group, EagleBurgmann, and ELAFLEX, while Denmark is home to Belman and Switzerland to BOA Group. Poland, Sweden, Finland, and Denmark have large district heating networks. France and the United Kingdom are investing in nuclear power. Hydrogen projects in the Netherlands and Germany create new demand. Italy and Spain have large chemical and refining industries that need regular replacement. Key barriers include declining coal power and high energy costs for industry. One opportunity is heat network expansion funded by national climate programs.
Which Region Is Leading the Expansion Joints Market?
Asia Pacific is leading the expansion joints market with a 43.0% share in 2026. China builds more power plants, chemical complexes, and district heating networks than any other country, and it has many local manufacturers such as Aerosun and Jiangsu Yaguang Bellows. Japan and South Korea have advanced shipbuilding, power, and chemical industries. Australia is developing LNG and hydrogen projects. Indonesia and Vietnam are adding power capacity. Shipbuilding in South Korea, China, and Japan uses joints in engine exhausts. Key barriers include price competition from local makers. One change shaping the region is new factories opened by global suppliers.
Which Country Is Growing Fastest in the Expansion Joints Market?
India is growing fastest in the expansion joints market at a 6.1% CAGR through 2033. The country is expanding refineries, power plants, steel mills, and city gas networks, and metro rail and bridge projects use structural joints. Witzenmann Group broke ground on a new Chennai plant in 2026 to make expansion joints and metal hoses locally. EagleBurgmann also has a large presence in the country. Government programs such as Make in India encourage local production, and new nuclear and solar thermal projects add demand. Key barriers include price pressure from local makers. One opportunity is local manufacturing for export.
Latin America Grows the Expansion Joints Market Through Energy Projects
Latin America holds a small share of the expansion joints market. Brazil has large oil, gas, pulp, and paper industries, and Mexico is upgrading refineries and power plants. Argentina is developing LNG export facilities and pipelines linked to its shale gas resources. Chile and Peru use joints in mining, smelting, and copper processing plants. Colombia and Ecuador have refinery upgrade projects. Most high-end joints are imported from Europe and the United States, while local workshops make simpler rubber and metal joints. Key barriers include project delays and import costs. One opportunity is maintenance for aging plants and refineries.
Middle East & Africa Expands the Expansion Joints Market Through Petrochemicals
Middle East & Africa is a growing expansion joints market. Saudi Arabia, the United Arab Emirates, Qatar, and Kuwait are expanding refineries, petrochemical plants, LNG trains, and desalination plants. Qatar’s LNG expansion is one of the largest energy projects in the world and needs many cryogenic joints. Egypt and South Africa have power and industrial projects, and Oman is planning large green hydrogen hubs. Desalination plants use many rubber and metal joints to handle water flow. Key barriers include project timing and oil price swings. One opportunity is hydrogen projects in Saudi Arabia and Oman.
Competitive Landscape
The expansion joints market is fragmented. Global leaders such as EagleBurgmann, Witzenmann Group, Trelleborg, BOA Group, Senior Flexonics, and Belman, now owned by Indutrade, compete with many regional specialists, including Macoga, Flexider, Unaflex, Hyspan, Weldmac, and Technoflex. Chinese makers such as Aerosun and Jiangsu Yaguang Bellows serve large domestic projects.
Companies compete on engineering expertise, product range, quality certifications, delivery time, and price. Large projects often require compliance with standards from the Expansion Joint Manufacturers Association and pressure equipment rules. Custom design and on-site service are important for critical applications. Larger firms grow by acquiring specialists to add products and enter new regions. Fast delivery for emergency replacements during plant shutdowns can win repeat business, so service networks matter. Regional makers in China and India compete strongly on price for standard products, while global firms focus on complex, high-value designs.
Strategic moves show how competition is changing. In February 2026, Indutrade completed its acquisition of Belman, a Danish maker of metallic and non-metallic joints. In February 2026, Balco, a CSW Industrials company, received UL 2079 listing for its MetaBlock fire-rated joint barriers. In March 2026, Witzenmann Group broke ground on a new plant in Chennai. These moves show competition shifting toward consolidation and local manufacturing.
Three themes shape vendor strategy. First, companies are buying specialists. Second, they are building plants in India and China. Third, they are developing products for hydrogen and LNG.
Expansion Joints Market Industry Leaders
- EagleBurgmann
- Witzenmann Group
- Belman
- Trelleborg
- BOA Group
Recent Industry Developments
- March 2026: Witzenmann Group broke ground on a new manufacturing facility in Chennai, India, for expansion joints and flexible metal hoses - strengthens local supply in the fastest-growing country.
- February 2026: Indutrade completed its acquisition of Belman, a Danish maker of custom metallic and non-metallic expansion joints with about DKK 180 million in annual sales - consolidates the specialist segment.
- February 2026: Balco, a CSW Industrials company, received UL 2079 listing for its MetaBlock fire-rated expansion joint barriers for wood-frame assemblies - expands fire-rated architectural joint options.
Companies Covered in the Report
- EagleBurgmann
- Witzenmann Group
- Belman
- Trelleborg
- BOA Group
- Senior Flexonics
- Macoga
- Flexider
- Unaflex
- Hyspan
- Balco
- Aerosun
Expansion Joints Market Report Scope
This report covers expansion joints made from metallic, fabric, rubber, and other materials, including axial, universal, lateral, and angular types, used in power generation, oil and gas, petrochemicals, chemical processing, district heating, HVAC, shipbuilding, and building structures. It includes new installation and replacement sales. The base year is 2025, and the forecast period runs from 2026 to 2033. All values are expressed in US$ Million.
Material
- Metallic
- Fabric
- Rubber
- Others
Equipment Type
- Axial
- Universal
- Lateral
- Angular
End Use
- Power Generation
- Oil & Gas and Petrochemicals
- Chemical Processing
- District Heating
- HVAC and Buildings
- Others
Regions
- North America
- Europe
- Asia Pacific
- Latin America
- Middle East & Africa
Key Questions Answered in the Report
How big is the expansion joints market in 2026?
The expansion joints market is valued at US$ 1,285.1 million in 2026, led by metallic joints and power generation.
What is the expansion joints market forecast to 2033?
The market is projected to reach US$ 1,691.1 million by 2033, growing at a 4.0% CAGR and adding US$ 406.0 million.
Which end use is growing fastest in the expansion joints market?
District heating is growing fastest at a 7.0% CAGR through 2033, driven by heat network expansion in Europe and China.
Which country is growing fastest in the expansion joints market?
India is growing fastest at a 6.1% CAGR through 2033, driven by refinery, power, and infrastructure projects and new local plants.
Which region holds the largest expansion joints market share?
Asia Pacific holds the largest share at 43.0% in 2026, supported by large power, chemical, and heating projects in China.
1. Executive Summary
1.1. Global Expansion Joints Market Snapshot
1.2. Future Projections
1.3. Key Report Takeaways
1.4. Regional Snapshot
2. Market Overview
2.1. Market Definition and Report Scope
2.2. Historical Trends 2020–2025
2.3. Market Dynamics
2.3.1. Drivers
2.3.1.1. Energy Investment Is Driving the Expansion Joints Market
2.3.1.2. Plant Maintenance Is Expanding the Expansion Joints Market
2.3.2. Restraints
2.3.2.1. Raw Material Costs Slow the Expansion Joints Market
2.3.2.2. Fossil Fuel Slowdown Restricts the Expansion Joints Market
2.3.3. Market Opportunities
2.3.3.1. Hydrogen and LNG Projects Open a Specialized Revenue Pool
2.3.3.2. District Heating Networks Create a Growing Revenue Pool
3. Global Expansion Joints Market Outlook, 2020-2033
3.1. Global Expansion Joints Market Outlook, by Material, Value (US$ Million), 2020-2033
3.1.1. Metallic
3.1.2. Fabric
3.1.3. Rubber
3.1.4. Others
3.2. Global Expansion Joints Market Outlook, by Equipment Type, Value (US$ Million), 2020-2033
3.2.1. Axial
3.2.2. Universal
3.2.3. Lateral
3.2.4. Angular
3.3. Global Expansion Joints Market Outlook, by End Use, Value (US$ Million), 2020-2033
3.3.1. Power Generation
3.3.2. Oil & Gas and Petrochemicals
3.3.3. Chemical Processing
3.3.4. District Heating
3.3.5. HVAC and Buildings
3.3.6. Others
3.4. Global Expansion Joints Market Outlook, by Region, Value (US$ Million), 2020-2033
3.4.1. North America
3.4.2. Europe
3.4.3. Asia Pacific
3.4.4. Latin America
3.4.5. Middle East & Africa
4. North America Expansion Joints Market Outlook, 2020-2033
4.1. North America Expansion Joints Market Outlook, by Material, Value (US$ Million), 2020-2033
4.1.1. Metallic
4.1.2. Fabric
4.1.3. Rubber
4.1.4. Others
4.2. North America Expansion Joints Market Outlook, by Equipment Type, Value (US$ Million), 2020-2033
4.2.1. Axial
4.2.2. Universal
4.2.3. Lateral
4.2.4. Angular
4.3. North America Expansion Joints Market Outlook, by End Use, Value (US$ Million), 2020-2033
4.3.1. Power Generation
4.3.2. Oil & Gas and Petrochemicals
4.3.3. Chemical Processing
4.3.4. District Heating
4.3.5. HVAC and Buildings
4.3.6. Others
4.4. North America Expansion Joints Market Outlook, by Country, Value (US$ Million), 2020-2033
4.4.1. United States Expansion Joints Market Outlook, by Material, 2020-2033
4.4.2. United States Expansion Joints Market Outlook, by Equipment Type, 2020-2033
4.4.3. United States Expansion Joints Market Outlook, by End Use, 2020-2033
4.4.4. Canada Expansion Joints Market Outlook, by Material, 2020-2033
4.4.5. Canada Expansion Joints Market Outlook, by Equipment Type, 2020-2033
4.4.6. Canada Expansion Joints Market Outlook, by End Use, 2020-2033
5. Europe Expansion Joints Market Outlook, 2020-2033
5.1. Europe Expansion Joints Market Outlook, by Material, Value (US$ Million), 2020-2033
5.1.1. Metallic
5.1.2. Fabric
5.1.3. Rubber
5.1.4. Others
5.2. Europe Expansion Joints Market Outlook, by Equipment Type, Value (US$ Million), 2020-2033
5.2.1. Axial
5.2.2. Universal
5.2.3. Lateral
5.2.4. Angular
5.3. Europe Expansion Joints Market Outlook, by End Use, Value (US$ Million), 2020-2033
5.3.1. Power Generation
5.3.2. Oil & Gas and Petrochemicals
5.3.3. Chemical Processing
5.3.4. District Heating
5.3.5. HVAC and Buildings
5.3.6. Others
5.4. Europe Expansion Joints Market Outlook, by Country, Value (US$ Million), 2020-2033
5.4.1. Germany Expansion Joints Market Outlook, by Material, 2020-2033
5.4.2. Germany Expansion Joints Market Outlook, by Equipment Type, 2020-2033
5.4.3. Germany Expansion Joints Market Outlook, by End Use, 2020-2033
5.4.4. Denmark Expansion Joints Market Outlook, by Material, 2020-2033
5.4.5. Denmark Expansion Joints Market Outlook, by Equipment Type, 2020-2033
5.4.6. Denmark Expansion Joints Market Outlook, by End Use, 2020-2033
5.4.7. Switzerland Expansion Joints Market Outlook, by Material, 2020-2033
5.4.8. Switzerland Expansion Joints Market Outlook, by Equipment Type, 2020-2033
5.4.9. Switzerland Expansion Joints Market Outlook, by End Use, 2020-2033
5.4.10. Poland Expansion Joints Market Outlook, by Material, 2020-2033
5.4.11. Poland Expansion Joints Market Outlook, by Equipment Type, 2020-2033
5.4.12. Poland Expansion Joints Market Outlook, by End Use, 2020-2033
5.4.13. Sweden Expansion Joints Market Outlook, by Material, 2020-2033
5.4.14. Sweden Expansion Joints Market Outlook, by Equipment Type, 2020-2033
5.4.15. Sweden Expansion Joints Market Outlook, by End Use, 2020-2033
5.4.16. Finland Expansion Joints Market Outlook, by Material, 2020-2033
5.4.17. Finland Expansion Joints Market Outlook, by Equipment Type, 2020-2033
5.4.18. Finland Expansion Joints Market Outlook, by End Use, 2020-2033
5.4.19. France Expansion Joints Market Outlook, by Material, 2020-2033
5.4.20. France Expansion Joints Market Outlook, by Equipment Type, 2020-2033
5.4.21. France Expansion Joints Market Outlook, by End Use, 2020-2033
5.4.22. United Kingdom Expansion Joints Market Outlook, by Material, 2020-2033
5.4.23. United Kingdom Expansion Joints Market Outlook, by Equipment Type, 2020-2033
5.4.24. United Kingdom Expansion Joints Market Outlook, by End Use, 2020-2033
5.4.25. Netherlands Expansion Joints Market Outlook, by Material, 2020-2033
5.4.26. Netherlands Expansion Joints Market Outlook, by Equipment Type, 2020-2033
5.4.27. Netherlands Expansion Joints Market Outlook, by End Use, 2020-2033
5.4.28. Italy Expansion Joints Market Outlook, by Material, 2020-2033
5.4.29. Italy Expansion Joints Market Outlook, by Equipment Type, 2020-2033
5.4.30. Italy Expansion Joints Market Outlook, by End Use, 2020-2033
5.4.31. Spain Expansion Joints Market Outlook, by Material, 2020-2033
5.4.32. Spain Expansion Joints Market Outlook, by Equipment Type, 2020-2033
5.4.33. Spain Expansion Joints Market Outlook, by End Use, 2020-2033
6. Asia Pacific Expansion Joints Market Outlook, 2020-2033
6.1. Asia Pacific Expansion Joints Market Outlook, by Material, Value (US$ Million), 2020-2033
6.1.1. Metallic
6.1.2. Fabric
6.1.3. Rubber
6.1.4. Others
6.2. Asia Pacific Expansion Joints Market Outlook, by Equipment Type, Value (US$ Million), 2020-2033
6.2.1. Axial
6.2.2. Universal
6.2.3. Lateral
6.2.4. Angular
6.3. Asia Pacific Expansion Joints Market Outlook, by End Use, Value (US$ Million), 2020-2033
6.3.1. Power Generation
6.3.2. Oil & Gas and Petrochemicals
6.3.3. Chemical Processing
6.3.4. District Heating
6.3.5. HVAC and Buildings
6.3.6. Others
6.4. Asia Pacific Expansion Joints Market Outlook, by Country, Value (US$ Million), 2020-2033
6.4.1. China Expansion Joints Market Outlook, by Material, 2020-2033
6.4.2. China Expansion Joints Market Outlook, by Equipment Type, 2020-2033
6.4.3. China Expansion Joints Market Outlook, by End Use, 2020-2033
6.4.4. Japan Expansion Joints Market Outlook, by Material, 2020-2033
6.4.5. Japan Expansion Joints Market Outlook, by Equipment Type, 2020-2033
6.4.6. Japan Expansion Joints Market Outlook, by End Use, 2020-2033
6.4.7. South Korea Expansion Joints Market Outlook, by Material, 2020-2033
6.4.8. South Korea Expansion Joints Market Outlook, by Equipment Type, 2020-2033
6.4.9. South Korea Expansion Joints Market Outlook, by End Use, 2020-2033
6.4.10. Australia Expansion Joints Market Outlook, by Material, 2020-2033
6.4.11. Australia Expansion Joints Market Outlook, by Equipment Type, 2020-2033
6.4.12. Australia Expansion Joints Market Outlook, by End Use, 2020-2033
6.4.13. Indonesia Expansion Joints Market Outlook, by Material, 2020-2033
6.4.14. Indonesia Expansion Joints Market Outlook, by Equipment Type, 2020-2033
6.4.15. Indonesia Expansion Joints Market Outlook, by End Use, 2020-2033
6.4.16. Vietnam Expansion Joints Market Outlook, by Material, 2020-2033
6.4.17. Vietnam Expansion Joints Market Outlook, by Equipment Type, 2020-2033
6.4.18. Vietnam Expansion Joints Market Outlook, by End Use, 2020-2033
6.4.19. India Expansion Joints Market Outlook, by Material, 2020-2033
6.4.20. India Expansion Joints Market Outlook, by Equipment Type, 2020-2033
6.4.21. India Expansion Joints Market Outlook, by End Use, 2020-2033
7. Latin America Expansion Joints Market Outlook, 2020-2033
7.1. Latin America Expansion Joints Market Outlook, by Material, Value (US$ Million), 2020-2033
7.1.1. Metallic
7.1.2. Fabric
7.1.3. Rubber
7.1.4. Others
7.2. Latin America Expansion Joints Market Outlook, by Equipment Type, Value (US$ Million), 2020-2033
7.2.1. Axial
7.2.2. Universal
7.2.3. Lateral
7.2.4. Angular
7.3. Latin America Expansion Joints Market Outlook, by End Use, Value (US$ Million), 2020-2033
7.3.1. Power Generation
7.3.2. Oil & Gas and Petrochemicals
7.3.3. Chemical Processing
7.3.4. District Heating
7.3.5. HVAC and Buildings
7.3.6. Others
7.4. Latin America Expansion Joints Market Outlook, by Country, Value (US$ Million), 2020-2033
7.4.1. Brazil Expansion Joints Market Outlook, by Material, 2020-2033
7.4.2. Brazil Expansion Joints Market Outlook, by Equipment Type, 2020-2033
7.4.3. Brazil Expansion Joints Market Outlook, by End Use, 2020-2033
7.4.4. Mexico Expansion Joints Market Outlook, by Material, 2020-2033
7.4.5. Mexico Expansion Joints Market Outlook, by Equipment Type, 2020-2033
7.4.6. Mexico Expansion Joints Market Outlook, by End Use, 2020-2033
7.4.7. Argentina Expansion Joints Market Outlook, by Material, 2020-2033
7.4.8. Argentina Expansion Joints Market Outlook, by Equipment Type, 2020-2033
7.4.9. Argentina Expansion Joints Market Outlook, by End Use, 2020-2033
7.4.10. Chile Expansion Joints Market Outlook, by Material, 2020-2033
7.4.11. Chile Expansion Joints Market Outlook, by Equipment Type, 2020-2033
7.4.12. Chile Expansion Joints Market Outlook, by End Use, 2020-2033
7.4.13. Peru Expansion Joints Market Outlook, by Material, 2020-2033
7.4.14. Peru Expansion Joints Market Outlook, by Equipment Type, 2020-2033
7.4.15. Peru Expansion Joints Market Outlook, by End Use, 2020-2033
7.4.16. Colombia Expansion Joints Market Outlook, by Material, 2020-2033
7.4.17. Colombia Expansion Joints Market Outlook, by Equipment Type, 2020-2033
7.4.18. Colombia Expansion Joints Market Outlook, by End Use, 2020-2033
7.4.19. Ecuador Expansion Joints Market Outlook, by Material, 2020-2033
7.4.20. Ecuador Expansion Joints Market Outlook, by Equipment Type, 2020-2033
7.4.21. Ecuador Expansion Joints Market Outlook, by End Use, 2020-2033
8. Middle East & Africa Expansion Joints Market Outlook, 2020-2033
8.1. Middle East & Africa Expansion Joints Market Outlook, by Material, Value (US$ Million), 2020-2033
8.1.1. Metallic
8.1.2. Fabric
8.1.3. Rubber
8.1.4. Others
8.2. Middle East & Africa Expansion Joints Market Outlook, by Equipment Type, Value (US$ Million), 2020-2033
8.2.1. Axial
8.2.2. Universal
8.2.3. Lateral
8.2.4. Angular
8.3. Middle East & Africa Expansion Joints Market Outlook, by End Use, Value (US$ Million), 2020-2033
8.3.1. Power Generation
8.3.2. Oil & Gas and Petrochemicals
8.3.3. Chemical Processing
8.3.4. District Heating
8.3.5. HVAC and Buildings
8.3.6. Others
8.4. Middle East & Africa Expansion Joints Market Outlook, by Country, Value (US$ Million), 2020-2033
8.4.1. Saudi Arabia Expansion Joints Market Outlook, by Material, 2020-2033
8.4.2. Saudi Arabia Expansion Joints Market Outlook, by Equipment Type, 2020-2033
8.4.3. Saudi Arabia Expansion Joints Market Outlook, by End Use, 2020-2033
8.4.4. United Arab Emirates Expansion Joints Market Outlook, by Material, 2020-2033
8.4.5. United Arab Emirates Expansion Joints Market Outlook, by Equipment Type, 2020-2033
8.4.6. United Arab Emirates Expansion Joints Market Outlook, by End Use, 2020-2033
8.4.7. Qatar Expansion Joints Market Outlook, by Material, 2020-2033
8.4.8. Qatar Expansion Joints Market Outlook, by Equipment Type, 2020-2033
8.4.9. Qatar Expansion Joints Market Outlook, by End Use, 2020-2033
8.4.10. Kuwait Expansion Joints Market Outlook, by Material, 2020-2033
8.4.11. Kuwait Expansion Joints Market Outlook, by Equipment Type, 2020-2033
8.4.12. Kuwait Expansion Joints Market Outlook, by End Use, 2020-2033
8.4.13. Egypt Expansion Joints Market Outlook, by Material, 2020-2033
8.4.14. Egypt Expansion Joints Market Outlook, by Equipment Type, 2020-2033
8.4.15. Egypt Expansion Joints Market Outlook, by End Use, 2020-2033
8.4.16. South Africa Expansion Joints Market Outlook, by Material, 2020-2033
8.4.17. South Africa Expansion Joints Market Outlook, by Equipment Type, 2020-2033
8.4.18. South Africa Expansion Joints Market Outlook, by End Use, 2020-2033
8.4.19. Oman Expansion Joints Market Outlook, by Material, 2020-2033
8.4.20. Oman Expansion Joints Market Outlook, by Equipment Type, 2020-2033
8.4.21. Oman Expansion Joints Market Outlook, by End Use, 2020-2033
9. Competitive Landscape
9.1. Market Concentration and Industry Leaders
9.2. Competitive Differentiation
9.3. Strategic Moves and Market Direction
9.4. Recent Industry Developments
9.5. Company Profiles
9.5.1. EagleBurgmann
9.5.2. Witzenmann Group
9.5.3. Belman
9.5.4. Trelleborg
9.5.5. BOA Group
9.5.6. Senior Flexonics
9.5.7. Macoga
9.5.8. Flexider
9.5.9. Unaflex
9.5.10. Hyspan
9.5.11. Balco
9.5.12. Aerosun
10. Appendix
10.1. Research Methodology
10.2. Report Assumptions
10.3. Acronyms and Abbreviations
| Material | Metallic, Fabric, Rubber, Others |
| Equipment Type | Axial, Universal, Lateral, Angular |
| End Use | Power Generation, Oil & Gas and Petrochemicals, Chemical Processing, District Heating, HVAC and Buildings, Others |
| Regions | North America, Europe, Asia Pacific, Latin America, Middle East & Africa |
Our Research Methodology
Considering the volatility of business today, traditional approaches to strategizing a game plan can be unfruitful if not detrimental. True ambiguity is no way to determine a forecast. A myriad of predetermined factors must be accounted for such as the degree of risk involved, the magnitude of circumstances, as well as conditions or consequences that are not known or unpredictable. To circumvent binary views that cast uncertainty, the application of market research intelligence to strategically posture, move, and enable actionable outcomes is necessary.
View Methodology
Quality Assured
Rigorous Validation Process

Confidentiality Assured
End-to-end Data Security

Custom Research Services
Tailored To Your Objectives
FAQs
The expansion joints market is valued at US$ 1,285.1 million in 2026, led by metallic joints and power generation.
The market is projected to reach US$ 1,691.1 million by 2033, growing at a 4.0% CAGR and adding US$ 406.0 million.
District heating is growing fastest at a 7.0% CAGR through 2033, driven by heat network expansion in Europe and China.
India is growing fastest at a 6.1% CAGR through 2033, driven by refinery, power, and infrastructure projects and new local plants.
Asia Pacific holds the largest share at 43.0% in 2026, supported by large power, chemical, and heating projects in China.
Related Reports
Baby Car Seat Market Size, Share, Insights, Competitive Landscape, and Forecast 2026 to 2033
The baby car seat market is forecast to grow from US$ 6.12 billion in 2026 to US$ 10.09 billion by 2033 at a 7.4% CAGR.
Aloe Vera Extract Market Size, Share, Insights, Competitive Landscape, and Forecast 2026 to 2033
The aloe vera extract market is projected to grow from US$ 1.1 billion in 2026 to US$ 1.7 billion by 2033 at a 6.4% CAGR.
Household Cooking Appliance Market Size, Share, Insights, Competitive Landscape, and Forecast 2026 to 2033
Household cooking appliance market to reach US$ 580.24 billion by 2033 from US$ 366.11 billion in 2026 at a 6.8% CAGR. Explore products and regional trends.
Toilet Paper Market Size, Share, Insights, Competitive Landscape, and Forecast 2026 to 2033
The global toilet paper market is valued at US$54.27 billion in 2026, reaching US$67.98 billion by 2033, growing at a 3.27% CAGR
Vertical Garden Construction Market Size, Share, Insights, Competitive Landscape, and Forecast 2026 to 2033
The global vertical garden construction market is valued at US$1.28 billion in 2026, reaching US$2.26 billion by 2033, growing at an 8.5% CAGR
Zero Gravity Entertainment Market Size, Share, Insights, Competitive Landscape, and Forecast 2026 to 2033
Zero gravity entertainment market to grow from US$ 0.3 billion in 2026 to US$ 0.8 billion by 2033 at a 15.0% CAGR. Explore experiences, channels and regions.