



Autonomous Cars, Robotaxis & Sensors Market
Autonomous Cars, Robotaxis & Sensors Market Size, Share, Insights, Competitive Landscape, and Forecast 2026 to 2033
Autonomous Cars, Robotaxis & Sensors Market Size and Trend Analysis
What Is the Realistic Outlook for Automated Driving Revenue?
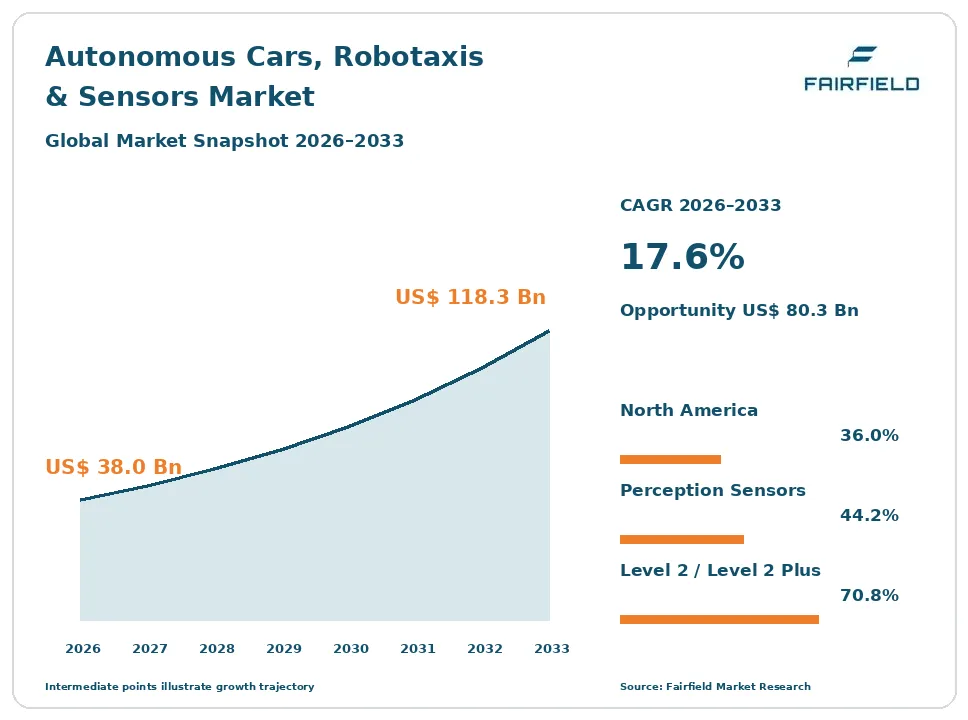
The global autonomous cars, robotaxis and sensors market size is expected to be valued at US$ 38.0 billion in 2026 and projected to reach US$ 118.3 billion by 2033, growing at a CAGR of 17.6% between 2026 and 2033.
The headline figure covers the technology and service value chain for automated driving: perception sensors, compute platforms and automated driving software, high-definition mapping and localisation, teleoperation infrastructure, and robotaxi service revenue where it is actually earned. Between 2020 and 2025 the market grew at roughly 19.4% a year, almost entirely on driver assistance sensor volume rather than autonomy. Two realities shape the forecast. Regulated assistance features put radar and cameras on tens of millions of vehicles each year. Fully automated services remain small and geographically concentrated. Growth is therefore hardware-led in the near term, with service revenue scaling slowly and unevenly.
Key Report Takeaways
- By Technology Layer: Perception sensors held 44.2% share in 2026, while robotaxi and automated ride-hailing services are projected to expand at a 31.5% CAGR through 2033, growing from a small base as individual cities authorise commercial passenger operation.
- By Sensor Type: Camera modules held 37.8% share in 2026, while lidar is projected to grow at a 23.6% CAGR through 2033, driven by unit prices falling far enough to appear in series production vehicles rather than test fleets.
- By Automation Level: Level 2 and Level 2 Plus systems held 70.8% share in 2026, while Level 4 is projected to advance at a 29.4% CAGR through 2033, concentrated in permitted operating domains rather than general road use.
- By Vehicle and Application: Passenger cars held 75.6% share in 2026, while commercial vehicles and automated trucking are projected to grow at a 26.8% CAGR through 2033, because fixed highway corridors are a simpler operating domain than dense city streets.
- By Geography: North America held 36.0% share in 2026, while Asia Pacific is projected to post a 21.0% CAGR through 2033, driven by national pilot programmes and domestic sensor manufacturing at lower cost points.
Global Autonomous Cars, Robotaxis & Sensors Market Trends and Insights
Drivers Impact Analysis
| Driver | Impact on CAGR Forecast | Geographic Relevance | Impact Timeline |
| Regulated driver assistance content putting sensors on mass-market vehicles | High | Europe, North America, Asia Pacific | Short term (≤2 years) |
| Falling lidar and compute cost per vehicle enabling higher automation content | High | Asia Pacific, North America, Europe | Medium term (2–4 years) |
Two forces account for most of the revenue added through 2033, and neither depends on full autonomy arriving.
Mandated Driver Assistance Content Puts Automotive Sensors on Mass-Market Vehicles
Driver assistance, not autonomy, is what ships in volume today, and regulation is what put it there. Automatic emergency braking, lane keeping assistance, driver drowsiness detection, intelligent speed assistance and reversing detection all require sensors, and they are now required or heavily incentivised across major markets. A single mid-range vehicle may carry a forward camera, several radar units and a dozen ultrasonic sensors. That is a far larger business than robotaxi service revenue.
The mechanism is type approval and consumer rating protocols working together. The EU General Safety Regulation made a package of assistance features mandatory for new vehicle types, and vehicle safety rating programmes award points for functions beyond the legal minimum. Manufacturers fit them across whole model ranges rather than per market. UNECE Regulation No. 157 on automated lane keeping systems provided the first binding international basis for a conditionally automated function, giving suppliers a specification to engineer against.
Falling Lidar and Compute Cost Brings Higher Automation Content Into Series Production
Sensor and compute cost per vehicle has fallen sharply, and that is what moves automation from demonstration fleets into production cars. Lidar units that once cost as much as the vehicle now sell for a small fraction of that, and automotive compute platforms deliver far more processing per watt than the racks of equipment used in early test vehicles. Each cost reduction moves a capability from a research budget into a bill of materials a programme manager can approve.
The mechanism is semiconductor integration and manufacturing scale. Solid-state and semi-solid-state lidar designs removed most moving parts, allowing automated assembly. Imaging radar raised angular resolution enough to classify objects that older radar merely detected. Automotive system-on-chip platforms consolidated separate control units into a single domain controller. The architecture argument between camera-only perception and multi-sensor fusion remains genuinely unresolved, and both camps are shipping products while the dispute continues.
Restraints Impact Analysis
| Restraint | Impact on CAGR Forecast | Geographic Relevance | Impact Timeline |
| Safety validation burden and unsettled liability and insurance frameworks | High | Global | Long term (≥4 years) |
| Robotaxi unit economics and permit-by-permit city expansion | High | North America, Asia Pacific, Europe | Long term (≥4 years) |
Two restraints explain why deployment timelines in this industry have repeatedly slipped.
Proving Safety Statistically Remains the Hardest Problem in Automated Driving
Validation is the binding constraint on automated driving, and it is a statistical problem before it is an engineering one. Demonstrating that a system is safer than a competent human driver requires exposure measured in hundreds of millions of kilometres, because the events that matter are rare. No developer can drive that distance quickly enough, so the field relies on simulation, scenario libraries and structured road testing, and regulators have not agreed on how much of each is sufficient.
The cause is the nature of the residual risk. ISO 26262 addresses functional safety when a component fails, while ISO 21448 addresses the harder case where everything works as designed but the design does not cover the situation. Edge cases in weather, construction zones, emergency vehicles and unusual pedestrian behaviour sit in that second category. Liability and insurance frameworks remain unsettled, and incidents attract immediate regulatory and political response regardless of statistical context.
Robotaxi Unit Economics and City-by-City Permitting Slow Commercial Expansion
Robotaxi expansion is a negotiated, capital-intensive process rather than a software rollout, and the economics are harder than the demonstrations suggest. Each new city needs mapping, validation in local conditions, a depot, a cleaning and charging operation, remote assistance staff and a separate regulatory authorisation. The vehicle itself is only part of the cost. Depreciation on a sensor-laden vehicle, remote support headcount and fleet utilisation across the day all weigh on per-ride economics.
The regulatory structure compounds this. The United States has no federal framework for deploying automated vehicles, so operation depends on a patchwork of state rules, with California Department of Motor Vehicles testing and deployment permits and California Public Utilities Commission passenger service authorisations serving as the template others copy. NHTSA’s exemption petition process remains narrow. The industry has already been through one cycle of consolidation in which well-funded programmes closed entirely.
Market Opportunities
Automated Trucking on Fixed Highway Corridors Opens a Freight Revenue Pool
Highway freight is the most tractable commercial opportunity in automated driving, because the operating domain is far simpler than a city street. A divided highway has no pedestrians, no cyclists, no unprotected left turns and predictable lane geometry. Hub-to-hub operation along a defined corridor, with human drivers handling the first and last miles, converts the hardest parts of the problem into a conventional logistics task and leaves the easy middle to the automated system.
Freight carriers, shippers and terminal operators create the demand, because driver availability and hours-of-service limits cap how far a load moves in a day. The revenue pool is per-mile freight rather than per-ride fares, which suits a vehicle running at high utilisation. Capturing it requires corridor mapping, depot infrastructure and state-level regulatory acceptance along the route, and progress will track those approvals rather than any technical milestone.
Simulation and Validation Toolchains Become a Business in Their Own Right
The tooling used to prove automated driving systems is becoming a product category rather than an internal cost. Scenario generation, sensor simulation, synthetic data, hardware-in-the-loop rigs, data labelling and regression testing infrastructure are now bought rather than built by most programmes. Because validation effort scales with capability, this spending continues even when deployment stalls, which makes it a more predictable revenue line than service operations.
Vehicle manufacturers, tier-one suppliers, chip vendors and regulators all create demand here. Safety-case documentation under ISO 26262 and ISO 21448, together with type-approval evidence requirements in the EU implementing regulation on the type-approval of fully automated vehicles, turn simulation output into regulatory artefacts. Tool vendors that can demonstrate traceability from a scenario library to an approval submission are positioned to capture the budget, because the evidence burden is permanent.
Segment Analysis
By Technology Layer: Perception Sensors Carry Revenue While Service Operations Grow Fastest
Perception sensors accounted for 44.2% of market value in 2026, the largest layer because every vehicle fitted with assistance features carries several, and the volumes involved dwarf autonomy programmes. Compute platforms and automated driving software followed at 33.6%, covering domain controllers and the perception, prediction and planning stacks that run on them. High-definition mapping and localisation took 9.4% and teleoperation and remote assistance infrastructure 4.2%.
Robotaxi and automated ride-hailing services hold 8.6% share and grow fastest at a 31.5% CAGR through 2033, from a small base and in a limited number of cities. Each new service area is individually negotiated, which caps how quickly that growth compounds. The business implication is blunt: a sensor market and a service market are different measures, and treating fare revenue as proof of sensor demand, or the reverse, misreads the industry.
By Sensor Type: Cameras Dominate the Suite as Lidar Unit Economics Improve
Camera modules represented 37.8% of sensor value in 2026, the largest share because every assistance package needs forward vision and surround-view systems add four or more units per vehicle. Automotive radar including imaging radar took 30.5%, valued for working in rain, fog and darkness where cameras degrade. Ultrasonic sensors accounted for 10.6%, used in parking and low-speed manoeuvring, and thermal sensors for 2.7%, a niche focused on pedestrian detection at night.
Lidar holds 18.4% share and grows fastest at a 23.6% CAGR through 2033. Prices have fallen steeply as solid-state designs removed moving parts and volume production began, bringing units into series vehicles rather than test fleets. Whether lidar is necessary at all remains genuinely disputed, with credible engineering arguments on both sides of the camera-only versus sensor-fusion question. The implication is that architecture choice, not sensor performance alone, determines supplier fortunes.
By Automation Level: Level 2 Systems Ship in Volume While Level 4 Expands From a Small Base
Level 2 and Level 2 Plus systems under SAE J3016 held 70.8% share in 2026, overwhelmingly the largest category because these are the assistance features shipping on mainstream vehicles today. The driver remains responsible throughout, which keeps the regulatory and liability burden manageable. Level 3 conditional automation took 17.3%, approved in limited conditions and offered on a small number of premium models where the manufacturer accepts responsibility within a defined domain.
Level 4 holds 11.6% share and grows fastest at a 29.4% CAGR through 2033, while Level 5 remains at 0.3% and essentially theoretical. Level 4 growth is concentrated in geofenced robotaxi operation and closed-site applications, not in privately owned vehicles. The implication is that the definitional boundary matters commercially: marketing language that blurs Level 2 and Level 3 creates liability exposure that regulators have begun to scrutinise closely.
By Vehicle and Application: Passenger Cars Lead While Automated Trucking Advances Quickest
Passenger cars accounted for 75.6% of market value in 2026, far ahead of every other application, simply because assistance-equipped private vehicles are produced in tens of millions of units each year. Robotaxi and shared mobility fleets took 9.2% of value, a figure that reflects sensor and compute content as well as service revenue. Buses and shuttles accounted for 3.8%, concentrated in low-speed campus, airport and controlled-route deployments.
Commercial vehicles and automated trucking hold 11.4% share and grow fastest at a 26.8% CAGR through 2033. Highway corridors present a simpler operating domain than urban streets, and freight economics justify higher sensor content per vehicle because utilisation is high. Robotaxi fleets grow quickly too, but their expansion is capped by city-level authorisation rather than vehicle supply. The implication is that commercial duty cycles, not consumer demand, fund the next phase of sensor volume.
Geography Analysis
Which Region Is Leading the Autonomous Cars, Robotaxis & Sensors Market?
North America is leading the autonomous cars, robotaxis and sensors market, with 36.0% share in 2026 and a 16.8% CAGR to 2033. The United States accounts for almost all of it, with Canada contributing research and winter-condition testing. Leadership rests on three things: the concentration of automated driving software development and venture capital, the largest commercial robotaxi operations anywhere, and a vehicle fleet with high assistance feature fitment.
The regulatory picture is the region’s main weakness rather than its strength. There is no federal deployment framework, so operation depends on individual state rules, and NHTSA works mainly through its Standing General Order crash reporting requirement and a narrow exemption process. Permits are granted service area by service area. The clearest change underway is scrutiny of how assistance features are marketed, after reported incidents prompted questions about whether drivers understand what their systems can and cannot do.
Europe Builds Automated Driving on Type Approval Rather Than Service Permits
Europe held 23.5% share in 2026 and grows at 14.6% through 2033. Germany, France, the United Kingdom, Sweden and Italy account for most activity, anchored by vehicle manufacturers and a deep tier-one supplier base in sensors, braking and control systems. The region’s distinctive approach is regulatory: capability is authorised through vehicle type approval rather than through operator permits, which produces slower but more uniform rollout across member states.
The framework is unusually complete. The General Safety Regulation mandates assistance features, UNECE Regulation No. 157 governs automated lane keeping, an EU implementing regulation sets out type-approval rules for fully automated vehicles, and UNECE Regulations No. 155 and 156 cover cybersecurity management and software update management. The barrier is commercial rather than technical: service deployment has been cautious and small in scale. The opportunity lies in supplying validated sensor and software content to manufacturers worldwide.
Which Region Is Growing Fastest in the Autonomous Cars, Robotaxis & Sensors Market?
Asia Pacific is growing fastest in the autonomous cars, robotaxis and sensors market, at a 21.0% CAGR through 2033 from a 34.5% share in 2026, already close to the largest regional position. China drives most of it, with Japan, Korea and Singapore contributing. Domestic lidar and radar manufacturing has pushed sensor costs below levels available elsewhere, which puts higher automation content into mid-priced vehicles.
Policy structure explains the pace. China’s intelligent connected vehicle access and on-road pilot programmes created a national route from testing to limited commercial operation, with designated zones in multiple cities and a defined approval sequence. That is a more coordinated path than a state-by-state patchwork. Japan and Korea have amended road traffic law to permit conditionally automated driving. The barriers are data governance rules that restrict cross-border mapping data, and the same unresolved safety validation question facing every market.
Latin America Adopts Driver Assistance Features Before Any Automated Services
Latin America held 2.5% share in 2026 and grows at 13.0% to 2033, the smallest regional position. Brazil, Mexico, Argentina and Chile account for most of it, and essentially all demand sits in driver assistance content fitted to locally assembled and imported vehicles rather than in any automated service operation. Regional vehicle assembly plants follow the specifications of parent manufacturers, so sensor fitment arrives with model refreshes.
The barriers are substantial. Vehicle safety regulation lags, which removes the mandate that drives sensor fitment elsewhere, and average vehicle age is high, so fleet turnover is slow. Road marking quality and informal traffic behaviour also limit how well assistance systems perform. The opportunity is regulatory alignment: as national authorities adopt vehicle safety requirements closer to international standards, assistance content becomes a compliance item rather than an optional extra on premium trims.
Middle East & Africa Uses Pilot Programmes to Attract Automated Mobility Investment
Middle East & Africa accounted for 3.5% share in 2026 and grows at 16.0% to 2033. The United Arab Emirates and Saudi Arabia drive nearly all activity, where national mobility strategies have set public targets for automated transport and created regulatory sandboxes to attract developers. Wide, well-marked, newly built road networks in planned cities are an unusually favourable operating environment compared with older urban layouts elsewhere.
The constraints are climate and scale. Extreme heat stresses sensors and battery systems, and dust and sand degrade optical performance in ways that temperate-climate validation does not capture. Across the wider region, vehicle safety regulation is uneven and fleet renewal is slow, so assistance feature penetration remains low outside the Gulf. The opportunity is that government-backed programmes can fund deployments on commercial terms that private operators would not attempt, making the region a useful proving ground.
Competitive Landscape
This market has medium concentration, but it is really several different competitive structures sharing a label. Automotive sensors and tier-one integration are moderately concentrated around a small group of established suppliers with the scale and quality systems that vehicle manufacturers require. Automotive compute is more concentrated still, with few credible platform vendors. Automated driving software and robotaxi operation are concentrated by necessity rather than by share, because capital intensity and regulatory burden have already eliminated most entrants. Lidar is the exception: it remains fragmented, loss-making for many participants and consolidating.
Competition runs on different axes in each layer. Sensor suppliers compete on cost per unit at automotive quality levels, on functional safety documentation and on winning multi-year platform awards. Compute vendors compete on performance per watt, toolchain maturity and the ease of porting an existing software stack. Software and service developers compete on demonstrated safety performance, on the breadth of validated operating conditions and on the cost of remote assistance per vehicle hour. Mapping and simulation vendors compete on coverage, update cadence and traceability of evidence.
Strategic direction across the field has shifted toward near-term revenue. Suppliers that once positioned themselves purely as autonomy companies now emphasise driver assistance volumes, because that is where vehicles ship. Several lidar and perception specialists have reoriented toward series production awards rather than robotaxi programmes. Vehicle manufacturers have moved between in-house development and supplier partnerships more than once, reflecting genuine uncertainty about where the value sits.
The honest summary is that nobody should treat deployment timelines as predictable. Vendor strategies reflect that, hedging between assistance volume today and automation capability whose commercial arrival remains contested.
Autonomous Cars, Robotaxis & Sensors Industry Leaders
- Waymo LLC
- Mobileye Global Inc.
- NVIDIA Corporation
- Robert Bosch GmbH
- Hesai Group
Recent Industry Developments
- January 2021: UNECE Regulation No. 157 on automated lane keeping systems entered into force, the first binding international rule for a conditionally automated driving function – it gave manufacturers a specification to engineer against and regulators a common approval basis.
- January 2021: UNECE Regulations No. 155 and 156 on cybersecurity management systems and software update management systems entered into force – they made security governance and over-the-air update control a type-approval condition rather than a voluntary practice.
- June 2021: NHTSA issued its Standing General Order requiring crash reporting for vehicles equipped with automated driving systems and advanced driver assistance – it created the first systematic public dataset on incidents involving these systems.
- July 2022: The EU General Safety Regulation became applicable to new vehicle types, mandating a package of driver assistance features – it converted sensor fitment from an optional selling point into a condition of selling a vehicle in the European market.
- November 2023: China’s Ministry of Industry and Information Technology and partner ministries launched a national pilot for intelligent connected vehicle access and on-road operation – it created a defined national path from testing toward limited commercial deployment.
Companies Covered in the Report
- Waymo LLC
- Mobileye Global Inc.
- NVIDIA Corporation
- Qualcomm Incorporated
- Aptiv PLC
- Robert Bosch GmbH
- Continental AG
- ZF Friedrichshafen AG
- Valeo SE
- Denso Corporation
- Hesai Group
- Luminar Technologies, Inc.
- Ouster, Inc.
- Baidu, Inc.
- Pony.ai Inc.
Autonomous Cars, Robotaxis & Sensors Market Report Scope
This report sizes the technology and service value chain for automated driving. The headline figure includes perception sensors, compute platforms and automated driving software, high-definition mapping and localisation, teleoperation infrastructure, and robotaxi service revenue, each treated as a separate segment. Complete vehicle sales, conventional telematics and non-automotive lidar are excluded. The base year is 2025, the forecast period runs from 2026 to 2033, and all values are expressed in US$ Billion.
Technology Layer
- Perception Sensors
- Compute Platforms and Automated Driving Software
- High-Definition Mapping and Localisation
- Teleoperation and Remote Assistance
- Robotaxi and Automated Ride-Hailing Services
Sensor Type
- Camera Modules
- Automotive Radar including Imaging Radar
- Lidar
- Ultrasonic Sensors
- Thermal Sensors
Automation Level
- Level 2 and Level 2 Plus
- Level 3
- Level 4
- Level 5
Vehicle and Application
- Passenger Cars
- Robotaxi and Shared Mobility Fleets
- Commercial Vehicles and Automated Trucking
- Buses and Shuttles
Regions
- North America
- Europe
- Asia Pacific
- Latin America
- Middle East & Africa
Key Questions Answered in the Report
How big is the autonomous cars, robotaxis and sensors market in 2026?
The market is valued at US$ 38.0 billion in 2026, covering perception sensors, compute and software, mapping, teleoperation and robotaxi service revenue combined.
What is the forecast size and CAGR of the autonomous cars, robotaxis and sensors market by 2033?
The market is projected to reach US$ 118.3 billion by 2033, growing at a 17.6% CAGR and adding an absolute opportunity of US$ 80.3 billion.
Which technology layer leads the autonomous cars, robotaxis and sensors market?
Perception sensors lead with 44.2% share in 2026, because assistance-equipped vehicles ship in volumes that autonomy programmes do not approach.
Which segment and region are growing fastest in the autonomous cars, robotaxis and sensors market?
Robotaxi and automated ride-hailing services grow fastest at 31.5% from a small base, and Asia Pacific is the fastest region at 21.0%.
Which region holds the largest autonomous cars, robotaxis and sensors market share?
North America holds 36.0% share in 2026, supported by concentrated software development, the largest commercial robotaxi operations and high assistance feature fitment.
1. Executive Summary
1.1. Global Autonomous Cars, Robotaxis & Sensors Market Snapshot
1.2. Future Projections
1.3. Key Report Takeaways
1.4. Regional Snapshot
2. Market Overview
2.1. Market Definition and Report Scope
2.2. Historical Trends 2020–2025
2.3. Market Dynamics
2.3.1. Drivers
2.3.1.1. Mandated Driver Assistance Content Puts Automotive Sensors on Mass-Market Vehicles
2.3.1.2. Falling Lidar and Compute Cost Brings Higher Automation Content Into Series Production
2.3.2. Restraints
2.3.2.1. Proving Safety Statistically Remains the Hardest Problem in Automated Driving
2.3.2.2. Robotaxi Unit Economics and City-by-City Permitting Slow Commercial Expansion
2.3.3. Market Opportunities
2.3.3.1. Automated Trucking on Fixed Highway Corridors Opens a Freight Revenue Pool
2.3.3.2. Simulation and Validation Toolchains Become a Business in Their Own Right
3. Global Autonomous Cars, Robotaxis & Sensors Market Outlook, 2020–2033
3.1. Global Autonomous Cars, Robotaxis & Sensors Market Outlook, by Technology Layer, Value (US$ Billion), 2020–2033
3.1.1. Perception Sensors
3.1.2. Compute Platforms and Automated Driving Software
3.1.3. High-Definition Mapping and Localisation
3.1.4. Teleoperation and Remote Assistance
3.1.5. Robotaxi and Automated Ride-Hailing Services
3.2. Global Autonomous Cars, Robotaxis & Sensors Market Outlook, by Sensor Type, Value (US$ Billion), 2020–2033
3.2.1. Camera Modules
3.2.2. Automotive Radar including Imaging Radar
3.2.3. Lidar
3.2.4. Ultrasonic Sensors
3.2.5. Thermal Sensors
3.3. Global Autonomous Cars, Robotaxis & Sensors Market Outlook, by Automation Level, Value (US$ Billion), 2020–2033
3.3.1. Level 2 and Level 2 Plus
3.3.2. Level 3
3.3.3. Level 4
3.3.4. Level 5
3.4. Global Autonomous Cars, Robotaxis & Sensors Market Outlook, by Vehicle and Application, Value (US$ Billion), 2020–2033
3.4.1. Passenger Cars
3.4.2. Robotaxi and Shared Mobility Fleets
3.4.3. Commercial Vehicles and Automated Trucking
3.4.4. Buses and Shuttles
3.5. Global Autonomous Cars, Robotaxis & Sensors Market Outlook, by Region, Value (US$ Billion), 2020–2033
3.5.1. North America
3.5.2. Europe
3.5.3. Asia Pacific
3.5.4. Latin America
3.5.5. Middle East & Africa
4. North America Autonomous Cars, Robotaxis & Sensors Market Outlook, 2020–2033
4.1. North America Autonomous Cars, Robotaxis & Sensors Market Outlook, by Technology Layer, Value (US$ Billion), 2020–2033
4.1.1. Perception Sensors
4.1.2. Compute Platforms and Automated Driving Software
4.1.3. High-Definition Mapping and Localisation
4.1.4. Teleoperation and Remote Assistance
4.1.5. Robotaxi and Automated Ride-Hailing Services
4.2. North America Autonomous Cars, Robotaxis & Sensors Market Outlook, by Sensor Type, Value (US$ Billion), 2020–2033
4.2.1. Camera Modules
4.2.2. Automotive Radar including Imaging Radar
4.2.3. Lidar
4.2.4. Ultrasonic Sensors
4.2.5. Thermal Sensors
4.3. North America Autonomous Cars, Robotaxis & Sensors Market Outlook, by Automation Level, Value (US$ Billion), 2020–2033
4.3.1. Level 2 and Level 2 Plus
4.3.2. Level 3
4.3.3. Level 4
4.3.4. Level 5
4.4. North America Autonomous Cars, Robotaxis & Sensors Market Outlook, by Vehicle and Application, Value (US$ Billion), 2020–2033
4.4.1. Passenger Cars
4.4.2. Robotaxi and Shared Mobility Fleets
4.4.3. Commercial Vehicles and Automated Trucking
4.4.4. Buses and Shuttles
4.5. North America Autonomous Cars, Robotaxis & Sensors Market Outlook, by Country, Value (US$ Billion), 2020–2033
4.5.1. United States Autonomous Cars, Robotaxis & Sensors Market Outlook, by Technology Layer, 2020–2033
4.5.2. United States Autonomous Cars, Robotaxis & Sensors Market Outlook, by Sensor Type, 2020–2033
4.5.3. United States Autonomous Cars, Robotaxis & Sensors Market Outlook, by Automation Level, 2020–2033
4.5.4. United States Autonomous Cars, Robotaxis & Sensors Market Outlook, by Vehicle and Application, 2020–2033
4.5.5. Canada Autonomous Cars, Robotaxis & Sensors Market Outlook, by Technology Layer, 2020–2033
4.5.6. Canada Autonomous Cars, Robotaxis & Sensors Market Outlook, by Sensor Type, 2020–2033
4.5.7. Canada Autonomous Cars, Robotaxis & Sensors Market Outlook, by Automation Level, 2020–2033
4.5.8. Canada Autonomous Cars, Robotaxis & Sensors Market Outlook, by Vehicle and Application, 2020–2033
5. Europe Autonomous Cars, Robotaxis & Sensors Market Outlook, 2020–2033
5.1. Europe Autonomous Cars, Robotaxis & Sensors Market Outlook, by Technology Layer, Value (US$ Billion), 2020–2033
5.1.1. Perception Sensors
5.1.2. Compute Platforms and Automated Driving Software
5.1.3. High-Definition Mapping and Localisation
5.1.4. Teleoperation and Remote Assistance
5.1.5. Robotaxi and Automated Ride-Hailing Services
5.2. Europe Autonomous Cars, Robotaxis & Sensors Market Outlook, by Sensor Type, Value (US$ Billion), 2020–2033
5.2.1. Camera Modules
5.2.2. Automotive Radar including Imaging Radar
5.2.3. Lidar
5.2.4. Ultrasonic Sensors
5.2.5. Thermal Sensors
5.3. Europe Autonomous Cars, Robotaxis & Sensors Market Outlook, by Automation Level, Value (US$ Billion), 2020–2033
5.3.1. Level 2 and Level 2 Plus
5.3.2. Level 3
5.3.3. Level 4
5.3.4. Level 5
5.4. Europe Autonomous Cars, Robotaxis & Sensors Market Outlook, by Vehicle and Application, Value (US$ Billion), 2020–2033
5.4.1. Passenger Cars
5.4.2. Robotaxi and Shared Mobility Fleets
5.4.3. Commercial Vehicles and Automated Trucking
5.4.4. Buses and Shuttles
5.5. Europe Autonomous Cars, Robotaxis & Sensors Market Outlook, by Country, Value (US$ Billion), 2020–2033
5.5.1. Germany Autonomous Cars, Robotaxis & Sensors Market Outlook, by Technology Layer, 2020–2033
5.5.2. Germany Autonomous Cars, Robotaxis & Sensors Market Outlook, by Sensor Type, 2020–2033
5.5.3. Germany Autonomous Cars, Robotaxis & Sensors Market Outlook, by Automation Level, 2020–2033
5.5.4. Germany Autonomous Cars, Robotaxis & Sensors Market Outlook, by Vehicle and Application, 2020–2033
5.5.5. France Autonomous Cars, Robotaxis & Sensors Market Outlook, by Technology Layer, 2020–2033
5.5.6. France Autonomous Cars, Robotaxis & Sensors Market Outlook, by Sensor Type, 2020–2033
5.5.7. France Autonomous Cars, Robotaxis & Sensors Market Outlook, by Automation Level, 2020–2033
5.5.8. France Autonomous Cars, Robotaxis & Sensors Market Outlook, by Vehicle and Application, 2020–2033
5.5.9. United Kingdom Autonomous Cars, Robotaxis & Sensors Market Outlook, by Technology Layer, 2020–2033
5.5.10. United Kingdom Autonomous Cars, Robotaxis & Sensors Market Outlook, by Sensor Type, 2020–2033
5.5.11. United Kingdom Autonomous Cars, Robotaxis & Sensors Market Outlook, by Automation Level, 2020–2033
5.5.12. United Kingdom Autonomous Cars, Robotaxis & Sensors Market Outlook, by Vehicle and Application, 2020–2033
5.5.13. Sweden Autonomous Cars, Robotaxis & Sensors Market Outlook, by Technology Layer, 2020–2033
5.5.14. Sweden Autonomous Cars, Robotaxis & Sensors Market Outlook, by Sensor Type, 2020–2033
5.5.15. Sweden Autonomous Cars, Robotaxis & Sensors Market Outlook, by Automation Level, 2020–2033
5.5.16. Sweden Autonomous Cars, Robotaxis & Sensors Market Outlook, by Vehicle and Application, 2020–2033
5.5.17. Italy Autonomous Cars, Robotaxis & Sensors Market Outlook, by Technology Layer, 2020–2033
5.5.18. Italy Autonomous Cars, Robotaxis & Sensors Market Outlook, by Sensor Type, 2020–2033
5.5.19. Italy Autonomous Cars, Robotaxis & Sensors Market Outlook, by Automation Level, 2020–2033
5.5.20. Italy Autonomous Cars, Robotaxis & Sensors Market Outlook, by Vehicle and Application, 2020–2033
6. Asia Pacific Autonomous Cars, Robotaxis & Sensors Market Outlook, 2020–2033
6.1. Asia Pacific Autonomous Cars, Robotaxis & Sensors Market Outlook, by Technology Layer, Value (US$ Billion), 2020–2033
6.1.1. Perception Sensors
6.1.2. Compute Platforms and Automated Driving Software
6.1.3. High-Definition Mapping and Localisation
6.1.4. Teleoperation and Remote Assistance
6.1.5. Robotaxi and Automated Ride-Hailing Services
6.2. Asia Pacific Autonomous Cars, Robotaxis & Sensors Market Outlook, by Sensor Type, Value (US$ Billion), 2020–2033
6.2.1. Camera Modules
6.2.2. Automotive Radar including Imaging Radar
6.2.3. Lidar
6.2.4. Ultrasonic Sensors
6.2.5. Thermal Sensors
6.3. Asia Pacific Autonomous Cars, Robotaxis & Sensors Market Outlook, by Automation Level, Value (US$ Billion), 2020–2033
6.3.1. Level 2 and Level 2 Plus
6.3.2. Level 3
6.3.3. Level 4
6.3.4. Level 5
6.4. Asia Pacific Autonomous Cars, Robotaxis & Sensors Market Outlook, by Vehicle and Application, Value (US$ Billion), 2020–2033
6.4.1. Passenger Cars
6.4.2. Robotaxi and Shared Mobility Fleets
6.4.3. Commercial Vehicles and Automated Trucking
6.4.4. Buses and Shuttles
6.5. Asia Pacific Autonomous Cars, Robotaxis & Sensors Market Outlook, by Country, Value (US$ Billion), 2020–2033
6.5.1. China Autonomous Cars, Robotaxis & Sensors Market Outlook, by Technology Layer, 2020–2033
6.5.2. China Autonomous Cars, Robotaxis & Sensors Market Outlook, by Sensor Type, 2020–2033
6.5.3. China Autonomous Cars, Robotaxis & Sensors Market Outlook, by Automation Level, 2020–2033
6.5.4. China Autonomous Cars, Robotaxis & Sensors Market Outlook, by Vehicle and Application, 2020–2033
6.5.5. Japan Autonomous Cars, Robotaxis & Sensors Market Outlook, by Technology Layer, 2020–2033
6.5.6. Japan Autonomous Cars, Robotaxis & Sensors Market Outlook, by Sensor Type, 2020–2033
6.5.7. Japan Autonomous Cars, Robotaxis & Sensors Market Outlook, by Automation Level, 2020–2033
6.5.8. Japan Autonomous Cars, Robotaxis & Sensors Market Outlook, by Vehicle and Application, 2020–2033
6.5.9. Korea Autonomous Cars, Robotaxis & Sensors Market Outlook, by Technology Layer, 2020–2033
6.5.10. Korea Autonomous Cars, Robotaxis & Sensors Market Outlook, by Sensor Type, 2020–2033
6.5.11. Korea Autonomous Cars, Robotaxis & Sensors Market Outlook, by Automation Level, 2020–2033
6.5.12. Korea Autonomous Cars, Robotaxis & Sensors Market Outlook, by Vehicle and Application, 2020–2033
6.5.13. Singapore Autonomous Cars, Robotaxis & Sensors Market Outlook, by Technology Layer, 2020–2033
6.5.14. Singapore Autonomous Cars, Robotaxis & Sensors Market Outlook, by Sensor Type, 2020–2033
6.5.15. Singapore Autonomous Cars, Robotaxis & Sensors Market Outlook, by Automation Level, 2020–2033
6.5.16. Singapore Autonomous Cars, Robotaxis & Sensors Market Outlook, by Vehicle and Application, 2020–2033
7. Latin America Autonomous Cars, Robotaxis & Sensors Market Outlook, 2020–2033
7.1. Latin America Autonomous Cars, Robotaxis & Sensors Market Outlook, by Technology Layer, Value (US$ Billion), 2020–2033
7.1.1. Perception Sensors
7.1.2. Compute Platforms and Automated Driving Software
7.1.3. High-Definition Mapping and Localisation
7.1.4. Teleoperation and Remote Assistance
7.1.5. Robotaxi and Automated Ride-Hailing Services
7.2. Latin America Autonomous Cars, Robotaxis & Sensors Market Outlook, by Sensor Type, Value (US$ Billion), 2020–2033
7.2.1. Camera Modules
7.2.2. Automotive Radar including Imaging Radar
7.2.3. Lidar
7.2.4. Ultrasonic Sensors
7.2.5. Thermal Sensors
7.3. Latin America Autonomous Cars, Robotaxis & Sensors Market Outlook, by Automation Level, Value (US$ Billion), 2020–2033
7.3.1. Level 2 and Level 2 Plus
7.3.2. Level 3
7.3.3. Level 4
7.3.4. Level 5
7.4. Latin America Autonomous Cars, Robotaxis & Sensors Market Outlook, by Vehicle and Application, Value (US$ Billion), 2020–2033
7.4.1. Passenger Cars
7.4.2. Robotaxi and Shared Mobility Fleets
7.4.3. Commercial Vehicles and Automated Trucking
7.4.4. Buses and Shuttles
7.5. Latin America Autonomous Cars, Robotaxis & Sensors Market Outlook, by Country, Value (US$ Billion), 2020–2033
7.5.1. Brazil Autonomous Cars, Robotaxis & Sensors Market Outlook, by Technology Layer, 2020–2033
7.5.2. Brazil Autonomous Cars, Robotaxis & Sensors Market Outlook, by Sensor Type, 2020–2033
7.5.3. Brazil Autonomous Cars, Robotaxis & Sensors Market Outlook, by Automation Level, 2020–2033
7.5.4. Brazil Autonomous Cars, Robotaxis & Sensors Market Outlook, by Vehicle and Application, 2020–2033
7.5.5. Mexico Autonomous Cars, Robotaxis & Sensors Market Outlook, by Technology Layer, 2020–2033
7.5.6. Mexico Autonomous Cars, Robotaxis & Sensors Market Outlook, by Sensor Type, 2020–2033
7.5.7. Mexico Autonomous Cars, Robotaxis & Sensors Market Outlook, by Automation Level, 2020–2033
7.5.8. Mexico Autonomous Cars, Robotaxis & Sensors Market Outlook, by Vehicle and Application, 2020–2033
7.5.9. Argentina Autonomous Cars, Robotaxis & Sensors Market Outlook, by Technology Layer, 2020–2033
7.5.10. Argentina Autonomous Cars, Robotaxis & Sensors Market Outlook, by Sensor Type, 2020–2033
7.5.11. Argentina Autonomous Cars, Robotaxis & Sensors Market Outlook, by Automation Level, 2020–2033
7.5.12. Argentina Autonomous Cars, Robotaxis & Sensors Market Outlook, by Vehicle and Application, 2020–2033
7.5.13. Chile Autonomous Cars, Robotaxis & Sensors Market Outlook, by Technology Layer, 2020–2033
7.5.14. Chile Autonomous Cars, Robotaxis & Sensors Market Outlook, by Sensor Type, 2020–2033
7.5.15. Chile Autonomous Cars, Robotaxis & Sensors Market Outlook, by Automation Level, 2020–2033
7.5.16. Chile Autonomous Cars, Robotaxis & Sensors Market Outlook, by Vehicle and Application, 2020–2033
8. Middle East & Africa Autonomous Cars, Robotaxis & Sensors Market Outlook, 2020–2033
8.1. Middle East & Africa Autonomous Cars, Robotaxis & Sensors Market Outlook, by Technology Layer, Value (US$ Billion), 2020–2033
8.1.1. Perception Sensors
8.1.2. Compute Platforms and Automated Driving Software
8.1.3. High-Definition Mapping and Localisation
8.1.4. Teleoperation and Remote Assistance
8.1.5. Robotaxi and Automated Ride-Hailing Services
8.2. Middle East & Africa Autonomous Cars, Robotaxis & Sensors Market Outlook, by Sensor Type, Value (US$ Billion), 2020–2033
8.2.1. Camera Modules
8.2.2. Automotive Radar including Imaging Radar
8.2.3. Lidar
8.2.4. Ultrasonic Sensors
8.2.5. Thermal Sensors
8.3. Middle East & Africa Autonomous Cars, Robotaxis & Sensors Market Outlook, by Automation Level, Value (US$ Billion), 2020–2033
8.3.1. Level 2 and Level 2 Plus
8.3.2. Level 3
8.3.3. Level 4
8.3.4. Level 5
8.4. Middle East & Africa Autonomous Cars, Robotaxis & Sensors Market Outlook, by Vehicle and Application, Value (US$ Billion), 2020–2033
8.4.1. Passenger Cars
8.4.2. Robotaxi and Shared Mobility Fleets
8.4.3. Commercial Vehicles and Automated Trucking
8.4.4. Buses and Shuttles
8.5. Middle East & Africa Autonomous Cars, Robotaxis & Sensors Market Outlook, by Country, Value (US$ Billion), 2020–2033
8.5.1. United Arab Emirates Autonomous Cars, Robotaxis & Sensors Market Outlook, by Technology Layer, 2020–2033
8.5.2. United Arab Emirates Autonomous Cars, Robotaxis & Sensors Market Outlook, by Sensor Type, 2020–2033
8.5.3. United Arab Emirates Autonomous Cars, Robotaxis & Sensors Market Outlook, by Automation Level, 2020–2033
8.5.4. United Arab Emirates Autonomous Cars, Robotaxis & Sensors Market Outlook, by Vehicle and Application, 2020–2033
8.5.5. Saudi Arabia Autonomous Cars, Robotaxis & Sensors Market Outlook, by Technology Layer, 2020–2033
8.5.6. Saudi Arabia Autonomous Cars, Robotaxis & Sensors Market Outlook, by Sensor Type, 2020–2033
8.5.7. Saudi Arabia Autonomous Cars, Robotaxis & Sensors Market Outlook, by Automation Level, 2020–2033
8.5.8. Saudi Arabia Autonomous Cars, Robotaxis & Sensors Market Outlook, by Vehicle and Application, 2020–2033
9. Competitive Landscape
9.1. Market Concentration and Industry Leaders
9.2. Competitive Differentiation
9.3. Strategic Moves and Market Direction
9.4. Recent Industry Developments
9.5. Company Profiles
9.5.1. Waymo LLC
9.5.2. Mobileye Global Inc.
9.5.3. NVIDIA Corporation
9.5.4. Qualcomm Incorporated
9.5.5. Aptiv PLC
9.5.6. Robert Bosch GmbH
9.5.7. Continental AG
9.5.8. ZF Friedrichshafen AG
9.5.9. Valeo SE
9.5.10. Denso Corporation
9.5.11. Hesai Group
9.5.12. Luminar Technologies, Inc.
9.5.13. Ouster, Inc.
9.5.14. Baidu, Inc.
9.5.15. Pony.ai Inc.
10. Appendix
10.1. Research Methodology
10.2. Report Assumptions
10.3. Acronyms and Abbreviations
| Technology Layer | Perception Sensors, Compute Platforms and Automated Driving Software, High-Definition Mapping and Localisation, Teleoperation and Remote Assistance, Robotaxi and Automated Ride-Hailing Services |
| Sensor Type | Camera Modules, Automotive Radar including Imaging Radar, Lidar, Ultrasonic Sensors, Thermal Sensors |
| Automation Level | Level 2 and Level 2 Plus, Level 3, Level 4, Level 5 |
| Vehicle and Application | Passenger Cars, Robotaxi and Shared Mobility Fleets, Commercial Vehicles and Automated Trucking, Buses and Shuttles |
| Regions | North America, Europe, Asia Pacific, Latin America, Middle East & Africa |
Our Research Methodology
Considering the volatility of business today, traditional approaches to strategizing a game plan can be unfruitful if not detrimental. True ambiguity is no way to determine a forecast. A myriad of predetermined factors must be accounted for such as the degree of risk involved, the magnitude of circumstances, as well as conditions or consequences that are not known or unpredictable. To circumvent binary views that cast uncertainty, the application of market research intelligence to strategically posture, move, and enable actionable outcomes is necessary.
View Methodology
Quality Assured
Rigorous Validation Process

Confidentiality Assured
End-to-end Data Security

Custom Research Services
Tailored To Your Objectives
FAQs
The market is valued at US$ 38.0 billion in 2026, covering perception sensors, compute and software, mapping, teleoperation and robotaxi service revenue combined.
The market is projected to reach US$ 118.3 billion by 2033, growing at a 17.6% CAGR and adding an absolute opportunity of US$ 80.3 billion.
Perception sensors lead with 44.2% share in 2026, because assistance-equipped vehicles ship in volumes that autonomy programmes do not approach.
Robotaxi and automated ride-hailing services grow fastest at 31.5% from a small base, and Asia Pacific is the fastest region at 21.0%.
North America holds 36.0% share in 2026, supported by concentrated software development, the largest commercial robotaxi operations and high assistance feature fitment.
Related Reports
Smart Oil Dipstick Market Size, Share, Insights, Competitive Landscape, and Forecast 2026 to 2033
Smart Oil Dipstick Market is projected to rise from US$ 4.03 billion in 2026 to US$ 13.02 billion by 2033 at an 18.2% CAGR. Explore key uses and trends.
Rail Glazing Market Size, Share, Insights, Competitive Landscape, and Forecast 2026 to 2033
Rail Glazing Market is projected to grow from US$ 2.37 billion in 2026 to US$ 3.56 billion by 2033 at a 6.0% CAGR. Explore materials and applications.
Passenger Vehicle ADAS Market Size, Share, Insights, Competitive Landscape, and Forecast 2026 to 2033
Passenger Vehicle ADAS Market is set to grow from US$ 36.7 billion in 2026 to US$ 115.5 billion by 2033 at a 17.8% CAGR. Explore sensors and trends.
Container Fleet Market Size, Share, Insights, Competitive Landscape, and Forecast 2026 to 2033
Explore the container fleet market, projected to reach US$ 26.8 billion by 2033 at a 5.4% CAGR, with container types, ownership and regional insights.
Micro-mobility Charging Infrastructure Market Size, Share, Insights, Competitive Landscape, and Forecast 2026 to 2033
The global micro-mobility charging infrastructure market is valued at US$9.06 billion in 2026, reaching US$34.02 billion by 2033, growing at a 20.8% CAGR
eCTOL Aircraft Market Size, Share, Insights, Competitive Landscape, and Forecast 2026 to 2033
Explore the eCTOL aircraft market, projected to reach US$ 11.14 billion by 2033 at a 10.6% CAGR, with propulsion, application and regional insights.