



Building Energy Management Systems Market
Building Energy Management Systems Market Size, Share, Insights, Competitive Landscape, and Forecast 2026 to 2033
Report Overview
Building Energy Management Systems Market Size and Trend Analysis
How Fast Will Building Energy Management Systems Grow?
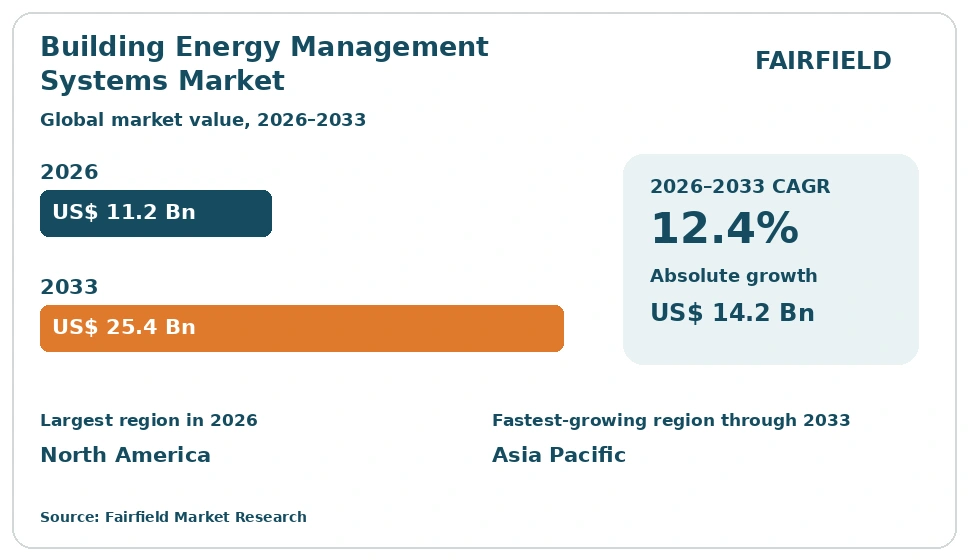
The global Building Energy Management Systems market size is expected to be valued at US$ 11.2 billion in 2026 and projected to reach US$ 25.4 billion by 2033, growing at a CAGR of 12.4% between 2026 and 2033. Growth adds an absolute dollar opportunity of US$ 14.2 billion over the forecast period, against a historical CAGR of 9.6% from 2020 to 2025. Rising electricity prices, tighter building performance rules and cheaper sensing hardware are the main growth factors. Owners are shifting from one-off efficiency upgrades to continuous monitoring and automated control. Software and services are capturing a larger share of each project as analytics mature.
Key Report Takeaways
- By Component: Hardware led with 46.0% share in 2026, while software is projected to expand at a 14.6% CAGR through 2033, driven by demand for analytics that turn raw meter data into automated control actions.
- By Building Type: Commercial offices led with 31.0% share in 2026, while residential buildings are set to grow at a 15.2% CAGR through 2033, driven by smart thermostats and home electrification programmes.
- By Deployment: On-premises systems led with 44.0% share in 2026, while cloud deployment is forecast to rise at a 15.8% CAGR through 2033, driven by portfolio operators seeking remote supervision without local servers.
- By Region: North America led with 34.5% share in 2026, while Asia Pacific is projected to expand at a 15.4% CAGR through 2033; Europe, Latin America and Middle East & Africa follow, driven by grid decarbonisation and new construction.
Market Trends and Insights
Market Growth Drivers
Volatile Energy Prices Make Active Load Control a Priority
Higher and less predictable electricity prices have turned energy from a fixed overhead into a managed cost line. Building owners now treat consumption data as an operating lever rather than a billing record. Energy management systems show load profiles by floor, tenant and asset, then act on them automatically. That visibility shortens payback on control upgrades and strengthens the case for portfolio-wide deployment.
Commercial landlords face parallel pressure from tenants and lenders who ask for verified performance data. Corporate occupiers report emissions tied to leased space, so they want metered evidence rather than estimates. Utilities in many markets apply time-of-use tariffs and demand charges that reward load shifting. These forces together move spending from isolated retrofit projects toward continuous monitoring, automated control sequences and measured outcomes that finance teams can audit.
Cheaper Sensing and Connectivity Open the Retrofit Market
Most of the building stock that will exist in 2033 is already built, and retrofits now dominate project volume. Falling prices for wireless sensors, submeters and gateways have removed the cabling cost that once blocked older buildings. Installers can meter a floor in days, so projects reach payback without major capital approval. This widens the addressable base from flagship towers to mid-sized offices, schools and clinics.
Wireless mesh protocols, cellular modules and edge gateways let data flow from legacy chillers and lighting panels without replacing the underlying plant. Vendors package sensing, connectivity and a control application as a single subscription, which suits owners with thin engineering teams. Equipment makers also ship native connectivity in rooftop units and lighting drivers. The result is a steady rise in metered points per building and richer datasets for optimisation.
Restraints Impact Analysis of Market
High Upfront Cost Slows Adoption in Smaller Buildings
Capital cost remains the main barrier outside large commercial portfolios. A full system spans meters, controllers, network equipment, software licences and commissioning labour, and the engineering effort often exceeds the hardware bill. Smaller owners face payback periods they consider too long against competing repairs. Split incentives compound the problem, since landlords fund the system while tenants collect most savings.
Financing structures have not closed this gap evenly. Performance contracts and as-a-service models work well for public estates and large campuses with predictable loads and creditworthy sponsors. Owners of a few mid-sized assets rarely clear the deal size specialist financiers need. Budget cycles in schools, clinics and municipal offices also delay approvals by a year or more. Adoption in these segments stays below the technical potential of the installed building stock.
Protocol Fragmentation and Legacy Plant Complicate Integration
Integration complexity slows projects and erodes expected savings. A typical building carries controls from several vendors and generations, each using different protocols, point naming and proprietary extensions. Engineers spend much of the project mapping points and resolving conflicts before any optimisation starts. Poor commissioning then leaves sequences overridden to manual, and performance drifts back toward the baseline.
Open protocols and semantic tagging frameworks have improved matters without removing the problem. Older chillers, boilers and lighting panels expose few usable data points, so retrofit teams add gateways and sensors to fill gaps. Skilled controls engineers are scarce in many markets, which lengthens schedules and raises labour rates. Cybersecurity reviews add further steps when control networks connect to corporate IT. These frictions push some owners toward narrow point solutions rather than integrated platforms.
Market Opportunities
Grid-Interactive Buildings Create Demand Flexibility Revenue
Buildings that can shift load on demand turn an operating system into a revenue asset. Utilities and grid operators pay for capacity that responds within minutes, and a tuned control platform can deliver it from chillers, ventilation, lighting and water heating. This changes the economics of a project, since flexibility payments arrive alongside energy savings. Owners with many sites can aggregate response and bid it into capacity markets.
Rising variable renewable generation makes this flexibility more valuable to system operators each year. Onsite solar, battery storage and electric vehicle charging add controllable assets inside the same building envelope. Energy management vendors are extending their platforms to dispatch these assets against price and carbon signals. Aggregators and energy retailers partner with control suppliers to reach building stock at scale, creating a channel neither side could build alone.
Analytics and Managed Services Build Recurring Income
Recurring software and service revenue is becoming the most attractive part of the value chain. Hardware margins face price pressure, while fault detection, continuous commissioning and reporting subscriptions renew every year. Vendors that hold the data layer can sell optimisation, benchmarking and compliance reporting across a customer estate. This model also lifts measured savings, because faults get flagged and corrected rather than left to accumulate.
Machine learning applied to historical trend data supports predictive control of heating, cooling and ventilation against weather and occupancy. Remote operations centres let a small team supervise hundreds of buildings, which suits owners without in-house controls staff. Reporting duties tied to disclosure rules and certification add a compliance workload that software can absorb. Service partners, systems integrators and facility managers are building practices around these recurring contracts.
Category-wise Insights
Which Component Segment Leads BEMS Spending?
Hardware leads the market with 46.0% share in 2026, covering meters, sensors, controllers, gateways and field panels. Every project begins with instrumentation, and retrofit work carries a heavy field device count. Software holds 31.5% share in 2026 and is the fastest-growing component at a 14.6% CAGR through 2033, while services hold 22.5% share in 2026 and grow at 13.1%. Hardware leadership reflects installed volume, not value capture.
Software growth follows the shift from supervisory dashboards to fault detection, predictive control and automated reporting that renews annually. Cheaper sensing lowers the hardware bill per point even as point counts climb. Services gain from commissioning, integration and remote operations contracts. For vendors, device sales win the site, while analytics subscriptions and managed services determine long-term account value.
Commercial Offices Anchor Demand While Homes Scale Fastest
Commercial offices lead by building type with 31.0% share in 2026, supported by large floor plates, professional facility teams and tenant reporting duties. Industrial and manufacturing facilities follow at 18.0%, with retail and hospitality at 14.5%, educational and government buildings at 13.5% and healthcare at 12.0%. Office portfolios justify full platforms because savings scale across many similar assets.
Residential buildings are the fastest-growing type at a 15.2% CAGR through 2033, from a smaller base of 11.0% share in 2026. Smart thermostats, connected water heaters, heat pumps and home charging create controllable load in dwellings that previously had none. Utility programmes and multifamily operators are aggregating this capacity. For the wider market, residential growth pulls simpler, lower-cost control products into a sector long shaped by commercial-grade engineering.
Cloud Deployment Overtakes On-Premises Control Rooms
On-premises deployment leads with 44.0% share in 2026, reflecting the installed base of supervisory servers in single large buildings and security-sensitive estates. Hybrid architectures hold 17.5% share in 2026, keeping control logic local while sending trend data upstream. Cloud deployment stands at 38.5% share in 2026 and is the fastest-growing model at a 15.8% CAGR between 2026 and 2033.
Cloud growth tracks the rise of multi-site portfolios that need one view across many buildings and no local server at each site. Subscription pricing also suits owners who prefer operating budgets to capital approvals. Local controllers still execute safety logic during network outages, so hybrid designs remain standard. The shift moves advantage toward vendors with reliable data pipelines, strong cybersecurity and open interfaces.
Building Owners Lead While Utilities Scale Fastest
Building owners and developers lead the end-user category with 28.0% share in 2026, since they control capital budgets and carry asset value exposure. Facility management service providers hold 24.0% share in 2026, energy service companies 19.5%, and corporate occupiers and tenants 17.0%. Owners buy platforms that protect rental income, certification status and long-term asset performance.
Utilities and grid operators are the fastest-growing end user at a 15.6% CAGR through 2033, from 11.5% share in 2026. Demand response programmes, efficiency obligations and distribution constraints push utilities to fund controls inside customer premises. Energy service companies also grow through performance contracts in public estates. This widens the buyer set beyond the traditional owner-operator and brings programme-scale procurement into a market historically sold building by building.
Geography Analysis
Which Region Is Leading the Building Energy Management Systems Market?
North America leads the market with 34.5% share in 2026 and grows at an 11.2% CAGR through 2033. The United States and Canada contribute most of the revenue, supported by a large stock of institutional and commercial floor space already fitted with digital controls. Utility demand response programmes, state and provincial efficiency obligations and corporate reporting commitments sustain steady replacement and upgrade activity. Data centre and healthcare construction adds high-value projects with dense instrumentation. A mature integrator base keeps commissioning capacity available. Growth trails emerging markets because penetration is already high, so spending shifts toward software renewals, analytics subscriptions and managed service contracts.
Energy Performance Rules Keep Europe a Deep Retrofit Market
Europe holds 29.0% share in 2026 and expands at a 12.1% CAGR through 2033. Germany, the United Kingdom, France, the Netherlands and the Nordic countries account for the bulk of demand. Building performance regulation, energy labelling requirements and public renovation programmes direct investment toward the existing stock rather than new construction. Variable wholesale power prices strengthen the savings case. Heat pump installation across the residential and light commercial base creates new controllable load that needs coordination with onsite solar. District heating networks in northern markets add another layer of optimisation. Its contractor base is experienced in deep retrofit work on older buildings with constrained plant rooms.
Which Region Is Growing Fastest in the Building Energy Management Systems Market?
Asia Pacific is the fastest-growing region, expanding at a 15.4% CAGR through 2033 from 25.5% share in 2026. China, India, Japan, South Korea, Singapore and Australia drive the gains. Rapid commercial construction means systems are specified at the design stage, which lowers installation cost and raises the share of connected floor space. Rising cooling demand pushes ventilation and chiller optimisation up the agenda. Green building certification is widely used by developers to attract international tenants. Domestic manufacturing of sensors, meters and controllers keeps equipment prices competitive. Government efficiency standards for large buildings and expanding smart meter rollouts give operators the data foundation that control platforms need.
Tariff Pressure and Grid Reliability Lift Latin American Uptake
Latin America accounts for 5.5% share in 2026 and grows at an 11.6% CAGR through 2033. Brazil, Mexico, Chile and Colombia lead adoption. High commercial electricity tariffs and periodic supply constraints give office towers, shopping centres and hotels a direct financial reason to control load. Distributed solar growth creates onsite generation that benefits from coordinated building control. International retail, hotel and banking groups apply global energy standards across their regional estates, which spreads proven designs. Cost sensitivity favours modular retrofits and cloud subscriptions over large capital projects. Constraints remain in financing availability, currency exposure on imported equipment and a shortage of trained controls engineers.
Cooling Loads and New Construction Shape Middle East & Africa Demand
Middle East & Africa holds 5.5% share in 2026 and grows at a 12.8% CAGR through 2033. The United Arab Emirates, Saudi Arabia, Qatar and South Africa contribute most activity. Cooling dominates building energy use across the Gulf, so chiller plant optimisation and district cooling control deliver large measurable savings. Major mixed-use and civic developments specify integrated systems from the design stage, often alongside green building certification targets. National efficiency programmes and utility tariff reform support the business case. In South Africa, supply reliability concerns make load management and onsite generation control a practical necessity. Elsewhere in Africa, adoption concentrates in new commercial and hospitality assets.
Competitive Landscape
The Building Energy Management Systems market is moderately concentrated at the top and fragmented below it. A small group of diversified automation and electrical equipment suppliers holds the large multi-site accounts, backed by global service networks and long-standing controls installed bases. Beneath them sit hundreds of regional systems integrators, controls contractors and software specialists who win on local presence and sector focus. Acquisition activity has steadily pulled analytics startups and niche controls firms into larger portfolios, which signals a market moving from component supply toward integrated platform competition.
Competition centres on software capability rather than device specification. Vendors differentiate through fault detection quality, the breadth of supported protocols, the ease of connecting third-party equipment, and the cybersecurity posture of their cloud services. Open data models and published interfaces matter to owners who want to avoid lock-in across a mixed estate. Independent software entrants compete without hardware, selling an analytics layer over whatever controls a building already has, and they push incumbents to open their platforms further.
Strategic activity concentrates on building recurring revenue and closing capability gaps. Equipment makers add native connectivity and cloud services to protect margins as hardware commoditises. Software suppliers partner with facility management firms and energy retailers to reach buildings they cannot sell into directly. Investment in remote operations centres extends service coverage without adding field staff in every market.
The direction of travel favours suppliers that combine field-proven control engineering with credible data platforms and flexible commercial models. Grid services, electrification of heat and transport, and reporting duties are widening what a system is expected to do.
Industry Leaders
- Schneider Electric SE
- Siemens AG
- Honeywell International Inc.
- Johnson Controls International plc
- ABB Ltd.
Companies Covered in the Report
- Schneider Electric SE
- Siemens AG
- Honeywell International Inc.
- Johnson Controls International plc
- ABB Ltd.
- Carrier Global Corporation
- Trane Technologies plc
- Mitsubishi Electric Corporation
- Hitachi, Ltd.
- Azbil Corporation
- Legrand SA
- Eaton Corporation plc
- Danfoss A/S
- Signify N.V.
Building Energy Management Systems Market Report Scope
The market is segmented by component, building type, deployment, end user and region.
| By Component | Hardware, Software, Services |
| By Building Type | Commercial Offices, Retail & Hospitality, Healthcare Facilities, Educational & Government Buildings, Industrial & Manufacturing Facilities, Residential Buildings |
| By Deployment | On-premises, Cloud, Hybrid |
| By End User | Building Owners & Developers, Facility Management Service Providers, Energy Service Companies, Corporate Occupiers & Tenants, Utilities & Grid Operators |
| By Region | North America, Europe, Asia Pacific, Latin America, Middle East & Africa |
1. Executive Summary
1.1 Building Energy Management Systems Market Snapshot
1.2 Future Projections
1.3 Key Industry Highlights
1.4 Geographical Snapshot
2. Market Overview
2.1 Market Definition and Segmentation
2.2 Historical Market Trends
2.3 Market Dynamics
2.3.1 Drivers
2.3.2 Restraints
2.3.3 Market Opportunities
3. Global Building Energy Management Systems Market Outlook, 2026–2033
3.1 Global Building Energy Management Systems Market Outlook, by Component, Value (US$ Billion), 2026–2033
3.1.1 Hardware
3.1.2 Software
3.1.3 Services
3.2 Global Building Energy Management Systems Market Outlook, by Building Type, Value (US$ Billion), 2026–2033
3.2.1 Commercial Offices
3.2.2 Retail & Hospitality
3.2.3 Healthcare Facilities
3.2.4 Educational & Government Buildings
3.2.5 Industrial & Manufacturing Facilities
3.2.6 Residential Buildings
3.3 Global Building Energy Management Systems Market Outlook, by Deployment, Value (US$ Billion), 2026–2033
3.3.1 On-premises
3.3.2 Cloud
3.3.3 Hybrid
3.4 Global Building Energy Management Systems Market Outlook, by End User, Value (US$ Billion), 2026–2033
3.4.1 Building Owners & Developers
3.4.2 Facility Management Service Providers
3.4.3 Energy Service Companies
3.4.4 Corporate Occupiers & Tenants
3.4.5 Utilities & Grid Operators
3.5 Global Building Energy Management Systems Market Outlook, by Region, Value (US$ Billion), 2026–2033
3.5.1 North America
3.5.2 Europe
3.5.3 Asia Pacific
3.5.4 Latin America
3.5.5 Middle East & Africa
4. North America Building Energy Management Systems Market Outlook, 2026–2033
4.1 North America Building Energy Management Systems Market Outlook, by Component, Value (US$ Billion), 2026–2033
4.1.1 Hardware
4.1.2 Software
4.1.3 Services
4.2 North America Building Energy Management Systems Market Outlook, by Building Type, Value (US$ Billion), 2026–2033
4.2.1 Commercial Offices
4.2.2 Retail & Hospitality
4.2.3 Healthcare Facilities
4.2.4 Educational & Government Buildings
4.2.5 Industrial & Manufacturing Facilities
4.2.6 Residential Buildings
4.3 North America Building Energy Management Systems Market Outlook, by Deployment, Value (US$ Billion), 2026–2033
4.3.1 On-premises
4.3.2 Cloud
4.3.3 Hybrid
4.4 North America Building Energy Management Systems Market Outlook, by End User, Value (US$ Billion), 2026–2033
4.4.1 Building Owners & Developers
4.4.2 Facility Management Service Providers
4.4.3 Energy Service Companies
4.4.4 Corporate Occupiers & Tenants
4.4.5 Utilities & Grid Operators
4.5 North America Building Energy Management Systems Market Outlook, by Country, Value (US$ Billion), 2026–2033
4.5.1 United States Building Energy Management Systems Market Outlook, by Component, 2026–2033
4.5.2 United States Building Energy Management Systems Market Outlook, by Building Type, 2026–2033
4.5.3 United States Building Energy Management Systems Market Outlook, by Deployment, 2026–2033
4.5.4 United States Building Energy Management Systems Market Outlook, by End User, 2026–2033
4.5.5 Canada Building Energy Management Systems Market Outlook, by Component, 2026–2033
4.5.6 Canada Building Energy Management Systems Market Outlook, by Building Type, 2026–2033
4.5.7 Canada Building Energy Management Systems Market Outlook, by Deployment, 2026–2033
4.5.8 Canada Building Energy Management Systems Market Outlook, by End User, 2026–2033
5. Europe Building Energy Management Systems Market Outlook, 2026–2033
5.1 Europe Building Energy Management Systems Market Outlook, by Component, Value (US$ Billion), 2026–2033
5.1.1 Hardware
5.1.2 Software
5.1.3 Services
5.2 Europe Building Energy Management Systems Market Outlook, by Building Type, Value (US$ Billion), 2026–2033
5.2.1 Commercial Offices
5.2.2 Retail & Hospitality
5.2.3 Healthcare Facilities
5.2.4 Educational & Government Buildings
5.2.5 Industrial & Manufacturing Facilities
5.2.6 Residential Buildings
5.3 Europe Building Energy Management Systems Market Outlook, by Deployment, Value (US$ Billion), 2026–2033
5.3.1 On-premises
5.3.2 Cloud
5.3.3 Hybrid
5.4 Europe Building Energy Management Systems Market Outlook, by End User, Value (US$ Billion), 2026–2033
5.4.1 Building Owners & Developers
5.4.2 Facility Management Service Providers
5.4.3 Energy Service Companies
5.4.4 Corporate Occupiers & Tenants
5.4.5 Utilities & Grid Operators
5.5 Europe Building Energy Management Systems Market Outlook, by Country and Subregion, Value (US$ Billion), 2026–2033
5.5.1 Germany Building Energy Management Systems Market Outlook, by Component, 2026–2033
5.5.2 Germany Building Energy Management Systems Market Outlook, by Building Type, 2026–2033
5.5.3 Germany Building Energy Management Systems Market Outlook, by Deployment, 2026–2033
5.5.4 Germany Building Energy Management Systems Market Outlook, by End User, 2026–2033
5.5.5 United Kingdom Building Energy Management Systems Market Outlook, by Component, 2026–2033
5.5.6 United Kingdom Building Energy Management Systems Market Outlook, by Building Type, 2026–2033
5.5.7 United Kingdom Building Energy Management Systems Market Outlook, by Deployment, 2026–2033
5.5.8 United Kingdom Building Energy Management Systems Market Outlook, by End User, 2026–2033
5.5.9 France Building Energy Management Systems Market Outlook, by Component, 2026–2033
5.5.10 France Building Energy Management Systems Market Outlook, by Building Type, 2026–2033
5.5.11 France Building Energy Management Systems Market Outlook, by Deployment, 2026–2033
5.5.12 France Building Energy Management Systems Market Outlook, by End User, 2026–2033
5.5.13 Netherlands Building Energy Management Systems Market Outlook, by Component, 2026–2033
5.5.14 Netherlands Building Energy Management Systems Market Outlook, by Building Type, 2026–2033
5.5.15 Netherlands Building Energy Management Systems Market Outlook, by Deployment, 2026–2033
5.5.16 Netherlands Building Energy Management Systems Market Outlook, by End User, 2026–2033
5.5.17 Nordic countries Building Energy Management Systems Market Outlook, by Component, 2026–2033
5.5.18 Nordic countries Building Energy Management Systems Market Outlook, by Building Type, 2026–2033
5.5.19 Nordic countries Building Energy Management Systems Market Outlook, by Deployment, 2026–2033
5.5.20 Nordic countries Building Energy Management Systems Market Outlook, by End User, 2026–2033
6. Asia Pacific Building Energy Management Systems Market Outlook, 2026–2033
6.1 Asia Pacific Building Energy Management Systems Market Outlook, by Component, Value (US$ Billion), 2026–2033
6.1.1 Hardware
6.1.2 Software
6.1.3 Services
6.2 Asia Pacific Building Energy Management Systems Market Outlook, by Building Type, Value (US$ Billion), 2026–2033
6.2.1 Commercial Offices
6.2.2 Retail & Hospitality
6.2.3 Healthcare Facilities
6.2.4 Educational & Government Buildings
6.2.5 Industrial & Manufacturing Facilities
6.2.6 Residential Buildings
6.3 Asia Pacific Building Energy Management Systems Market Outlook, by Deployment, Value (US$ Billion), 2026–2033
6.3.1 On-premises
6.3.2 Cloud
6.3.3 Hybrid
6.4 Asia Pacific Building Energy Management Systems Market Outlook, by End User, Value (US$ Billion), 2026–2033
6.4.1 Building Owners & Developers
6.4.2 Facility Management Service Providers
6.4.3 Energy Service Companies
6.4.4 Corporate Occupiers & Tenants
6.4.5 Utilities & Grid Operators
6.5 Asia Pacific Building Energy Management Systems Market Outlook, by Country, Value (US$ Billion), 2026–2033
6.5.1 China Building Energy Management Systems Market Outlook, by Component, 2026–2033
6.5.2 China Building Energy Management Systems Market Outlook, by Building Type, 2026–2033
6.5.3 China Building Energy Management Systems Market Outlook, by Deployment, 2026–2033
6.5.4 China Building Energy Management Systems Market Outlook, by End User, 2026–2033
6.5.5 India Building Energy Management Systems Market Outlook, by Component, 2026–2033
6.5.6 India Building Energy Management Systems Market Outlook, by Building Type, 2026–2033
6.5.7 India Building Energy Management Systems Market Outlook, by Deployment, 2026–2033
6.5.8 India Building Energy Management Systems Market Outlook, by End User, 2026–2033
6.5.9 Japan Building Energy Management Systems Market Outlook, by Component, 2026–2033
6.5.10 Japan Building Energy Management Systems Market Outlook, by Building Type, 2026–2033
6.5.11 Japan Building Energy Management Systems Market Outlook, by Deployment, 2026–2033
6.5.12 Japan Building Energy Management Systems Market Outlook, by End User, 2026–2033
6.5.13 South Korea Building Energy Management Systems Market Outlook, by Component, 2026–2033
6.5.14 South Korea Building Energy Management Systems Market Outlook, by Building Type, 2026–2033
6.5.15 South Korea Building Energy Management Systems Market Outlook, by Deployment, 2026–2033
6.5.16 South Korea Building Energy Management Systems Market Outlook, by End User, 2026–2033
6.5.17 Singapore Building Energy Management Systems Market Outlook, by Component, 2026–2033
6.5.18 Singapore Building Energy Management Systems Market Outlook, by Building Type, 2026–2033
6.5.19 Singapore Building Energy Management Systems Market Outlook, by Deployment, 2026–2033
6.5.20 Singapore Building Energy Management Systems Market Outlook, by End User, 2026–2033
6.5.21 Australia Building Energy Management Systems Market Outlook, by Component, 2026–2033
6.5.22 Australia Building Energy Management Systems Market Outlook, by Building Type, 2026–2033
6.5.23 Australia Building Energy Management Systems Market Outlook, by Deployment, 2026–2033
6.5.24 Australia Building Energy Management Systems Market Outlook, by End User, 2026–2033
7. Latin America Building Energy Management Systems Market Outlook, 2026–2033
7.1 Latin America Building Energy Management Systems Market Outlook, by Component, Value (US$ Billion), 2026–2033
7.1.1 Hardware
7.1.2 Software
7.1.3 Services
7.2 Latin America Building Energy Management Systems Market Outlook, by Building Type, Value (US$ Billion), 2026–2033
7.2.1 Commercial Offices
7.2.2 Retail & Hospitality
7.2.3 Healthcare Facilities
7.2.4 Educational & Government Buildings
7.2.5 Industrial & Manufacturing Facilities
7.2.6 Residential Buildings
7.3 Latin America Building Energy Management Systems Market Outlook, by Deployment, Value (US$ Billion), 2026–2033
7.3.1 On-premises
7.3.2 Cloud
7.3.3 Hybrid
7.4 Latin America Building Energy Management Systems Market Outlook, by End User, Value (US$ Billion), 2026–2033
7.4.1 Building Owners & Developers
7.4.2 Facility Management Service Providers
7.4.3 Energy Service Companies
7.4.4 Corporate Occupiers & Tenants
7.4.5 Utilities & Grid Operators
7.5 Latin America Building Energy Management Systems Market Outlook, by Country, Value (US$ Billion), 2026–2033
7.5.1 Brazil Building Energy Management Systems Market Outlook, by Component, 2026–2033
7.5.2 Brazil Building Energy Management Systems Market Outlook, by Building Type, 2026–2033
7.5.3 Brazil Building Energy Management Systems Market Outlook, by Deployment, 2026–2033
7.5.4 Brazil Building Energy Management Systems Market Outlook, by End User, 2026–2033
7.5.5 Mexico Building Energy Management Systems Market Outlook, by Component, 2026–2033
7.5.6 Mexico Building Energy Management Systems Market Outlook, by Building Type, 2026–2033
7.5.7 Mexico Building Energy Management Systems Market Outlook, by Deployment, 2026–2033
7.5.8 Mexico Building Energy Management Systems Market Outlook, by End User, 2026–2033
7.5.9 Chile Building Energy Management Systems Market Outlook, by Component, 2026–2033
7.5.10 Chile Building Energy Management Systems Market Outlook, by Building Type, 2026–2033
7.5.11 Chile Building Energy Management Systems Market Outlook, by Deployment, 2026–2033
7.5.12 Chile Building Energy Management Systems Market Outlook, by End User, 2026–2033
7.5.13 Colombia Building Energy Management Systems Market Outlook, by Component, 2026–2033
7.5.14 Colombia Building Energy Management Systems Market Outlook, by Building Type, 2026–2033
7.5.15 Colombia Building Energy Management Systems Market Outlook, by Deployment, 2026–2033
7.5.16 Colombia Building Energy Management Systems Market Outlook, by End User, 2026–2033
8. Middle East & Africa Building Energy Management Systems Market Outlook, 2026–2033
8.1 Middle East & Africa Building Energy Management Systems Market Outlook, by Component, Value (US$ Billion), 2026–2033
8.1.1 Hardware
8.1.2 Software
8.1.3 Services
8.2 Middle East & Africa Building Energy Management Systems Market Outlook, by Building Type, Value (US$ Billion), 2026–2033
8.2.1 Commercial Offices
8.2.2 Retail & Hospitality
8.2.3 Healthcare Facilities
8.2.4 Educational & Government Buildings
8.2.5 Industrial & Manufacturing Facilities
8.2.6 Residential Buildings
8.3 Middle East & Africa Building Energy Management Systems Market Outlook, by Deployment, Value (US$ Billion), 2026–2033
8.3.1 On-premises
8.3.2 Cloud
8.3.3 Hybrid
8.4 Middle East & Africa Building Energy Management Systems Market Outlook, by End User, Value (US$ Billion), 2026–2033
8.4.1 Building Owners & Developers
8.4.2 Facility Management Service Providers
8.4.3 Energy Service Companies
8.4.4 Corporate Occupiers & Tenants
8.4.5 Utilities & Grid Operators
8.5 Middle East & Africa Building Energy Management Systems Market Outlook, by Country, Value (US$ Billion), 2026–2033
8.5.1 United Arab Emirates Building Energy Management Systems Market Outlook, by Component, 2026–2033
8.5.2 United Arab Emirates Building Energy Management Systems Market Outlook, by Building Type, 2026–2033
8.5.3 United Arab Emirates Building Energy Management Systems Market Outlook, by Deployment, 2026–2033
8.5.4 United Arab Emirates Building Energy Management Systems Market Outlook, by End User, 2026–2033
8.5.5 Saudi Arabia Building Energy Management Systems Market Outlook, by Component, 2026–2033
8.5.6 Saudi Arabia Building Energy Management Systems Market Outlook, by Building Type, 2026–2033
8.5.7 Saudi Arabia Building Energy Management Systems Market Outlook, by Deployment, 2026–2033
8.5.8 Saudi Arabia Building Energy Management Systems Market Outlook, by End User, 2026–2033
8.5.9 Qatar Building Energy Management Systems Market Outlook, by Component, 2026–2033
8.5.10 Qatar Building Energy Management Systems Market Outlook, by Building Type, 2026–2033
8.5.11 Qatar Building Energy Management Systems Market Outlook, by Deployment, 2026–2033
8.5.12 Qatar Building Energy Management Systems Market Outlook, by End User, 2026–2033
8.5.13 South Africa Building Energy Management Systems Market Outlook, by Component, 2026–2033
8.5.14 South Africa Building Energy Management Systems Market Outlook, by Building Type, 2026–2033
8.5.15 South Africa Building Energy Management Systems Market Outlook, by Deployment, 2026–2033
8.5.16 South Africa Building Energy Management Systems Market Outlook, by End User, 2026–2033
9. Competitive Landscape
9.1 Industry Leaders
9.2 Company Profiles
9.2.1 Schneider Electric SE
9.2.2 Siemens AG
9.2.3 Honeywell International Inc.
9.2.4 Johnson Controls International plc
9.2.5 ABB Ltd.
9.2.6 Carrier Global Corporation
9.2.7 Trane Technologies plc
9.2.8 Mitsubishi Electric Corporation
9.2.9 Hitachi, Ltd.
9.2.10 Azbil Corporation
9.2.11 Legrand SA
9.2.12 Eaton Corporation plc
9.2.13 Danfoss A/S
9.2.14 Signify N.V.
10. Appendix
10.1 Research Methodology
10.2 Report Assumptions
10.3 Acronyms and Abbreviations
| By Component | Hardware, Software, Services |
| By Building Type | Commercial Offices, Retail & Hospitality, Healthcare Facilities, Educational & Government Buildings, Industrial & Manufacturing Facilities, Residential Buildings |
| By Deployment | On-premises, Cloud, Hybrid |
| By End User | Building Owners & Developers, Facility Management Service Providers, Energy Service Companies, Corporate Occupiers & Tenants, Utilities & Grid Operators |
| By Region | North America, Europe, Asia Pacific, Latin America, Middle East & Africa |
Our Research Methodology
Considering the volatility of business today, traditional approaches to strategizing a game plan can be unfruitful if not detrimental. True ambiguity is no way to determine a forecast. A myriad of predetermined factors must be accounted for such as the degree of risk involved, the magnitude of circumstances, as well as conditions or consequences that are not known or unpredictable. To circumvent binary views that cast uncertainty, the application of market research intelligence to strategically posture, move, and enable actionable outcomes is necessary.
View Methodology
Quality Assured
Rigorous Validation Process

Confidentiality Assured
End-to-end Data Security

Custom Research Services
Tailored To Your Objectives
FAQs
The market is valued at US$ 11.2 billion in 2026, supported by rising energy costs and wider metering across commercial and institutional buildings.
The market is projected to grow at a 12.4% CAGR between 2026 and 2033, reaching US$ 25.4 billion and adding US$ 14.2 billion.
Hardware leads with 46.0% share in 2026, while software is the fastest-growing component at a 14.6% CAGR through 2033, driven by analytics adoption.
North America holds 34.5% share in 2026, while Asia Pacific grows fastest at a 15.4% CAGR through 2033, led by new construction.
Leading suppliers include Schneider Electric SE, Siemens AG, Honeywell International Inc., Johnson Controls International plc and ABB Ltd., competing on analytics and services.
Related Reports
Fuel Management System Market Size, Share, Insights, Competitive Landscape, and Forecast 2026 to 2033
The global fuel management system market is valued at US$21.4 billion in 2026, reaching US$38.6 billion by 2033, growing at an 8.8% CAGR
Oil Immersed Current Transformer Market Size, Share, Insights, Competitive Landscape, and Forecast 2026 to 2033
The oil immersed current transformer market is projected to grow from US$2.4 billion in 2026 to US$3.6 billion by 2033 at a 6.0% CAGR.
Load Forecasting Solution Market Size, Share, Insights, Competitive Landscape, and Forecast 2026 to 2033
The load forecasting solution market is projected to reach US$3.0 billion by 2033. Explore demand by forecast horizon, deployment mode, and end user.
Enhanced Oil Recovery Market Size, Share, Insights, Competitive Landscape, and Forecast 2026 to 2033
The global enhanced oil recovery market is valued at US$46.5 billion in 2026, reaching US$58.9 billion by 2033, growing at a 3.43% CAGR
Biochar Gasification Market Size, Share, Insights, Competitive Landscape, and Forecast 2026 to 2033
The global biochar gasification market is valued at US$0.6 billion in 2026, reaching US$1.4 billion by 2033, growing at a 12.87% CAGR
AC-Coupled Energy Storage Inverter Market Size, Share, Insights, Competitive Landscape, and Forecast 2026 to 2033
The AC-coupled energy storage inverter market is forecast to grow from US$ 4.2 billion in 2026 to US$ 10.5 billion by 2033 at a 13.99% CAGR.