



Oil Immersed Current Transformer Market
Oil Immersed Current Transformer Market Size, Share, Insights, Competitive Landscape, and Forecast 2026 to 2033
Report Overview
Oil Immersed Current Transformer Market Size and Trend Analysis
What Is Driving Oil Immersed Current Transformer Market Growth?
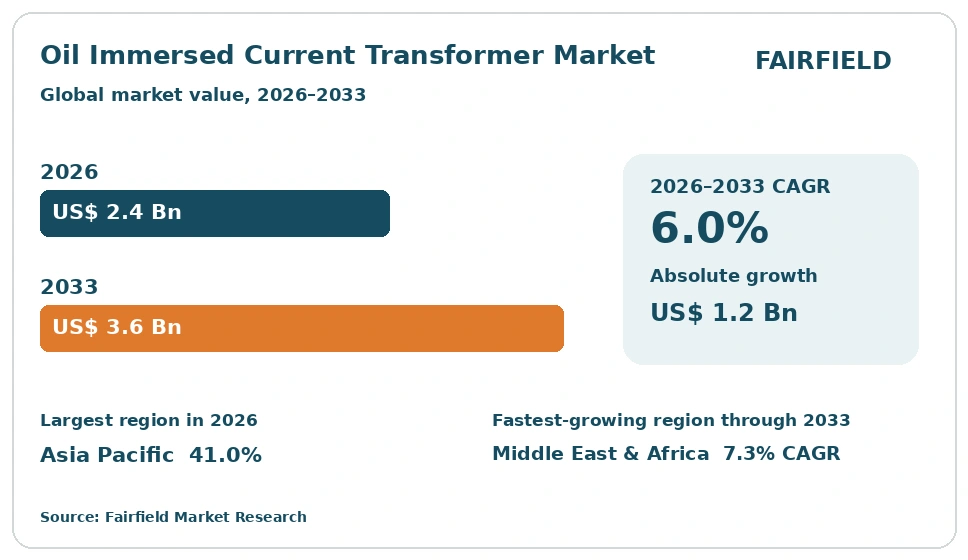
The global Oil Immersed Current Transformer market size is expected to be valued at US$ 2.4 Bn in 2026 and projected to reach US$ 3.6 Bn by 2033, growing at a CAGR of 6.0% between 2026 and 2033. Growth rests on heavy substation construction across transmission and distribution networks. Utilities in Asia Pacific and the Middle East are adding high-voltage capacity, while operators in North America and Europe replace equipment installed decades ago. Oil-immersed designs remain the preferred choice at higher voltage classes because they deliver stable accuracy, strong dielectric strength and long service life at competitive cost. The absolute dollar opportunity over the forecast period stands at US$ 1.2 Bn.
Key Report Takeaways
- By Voltage Rating: Medium voltage led with 46.5% share in 2026, while extra high voltage is projected to expand at a 7.6% CAGR through 2033, driven by long-distance transmission corridors that link remote generation sites to distant urban load centres.
- By Design: Dead-tank hairpin units held 57.5% share in 2026, while live-tank designs are set to grow at a 6.7% CAGR through 2033, supported by compact outdoor switchyards where shorter erection time and lighter foundations matter.
- By Application: Protection units captured 44.0% share in 2026, while combined metering and protection models should advance at a 7.1% CAGR through 2033, reflecting substation layouts that cut the number of separate instrument bays.
- By End Use: Transmission and distribution utilities accounted for 54.0% share in 2026, while renewable energy and interconnection projects are forecast to rise at an 8.1% CAGR through 2033, as wind and solar plants need dedicated revenue measurement points.
- By Region: Asia Pacific held 41.0% share in 2026 across North America, Europe, Asia Pacific, Latin America and Middle East & Africa, while Middle East & Africa is expected to post a 7.3% CAGR through 2033 on new cross-border grid links.
Market Trends and Insights
Market Growth Drivers
Grid Expansion and New Substation Capacity Lift Unit Demand
Rising substation construction is the single largest source of demand for oil immersed current transformers. Every new transmission bay needs measurement and protection cores, so volumes track the pace of grid build-out rather than electricity consumption alone. Utilities across Asia Pacific, Latin America and the Middle East are commissioning new high-voltage lines that connect generation to growing urban load. Each project pulls through several oil-filled units per bay.
The underlying trend is electrification. Data centres, electric transport and industrial process heat are raising peak demand on networks designed for lighter loads. National grid operators respond by adding circuits, upgrading voltage classes and building fresh switchyards. Oil immersed construction suits this work because the designs are proven, field-serviceable and available from several qualified suppliers. Procurement teams also value long asset life, which lowers whole-life cost across a thirty-year network plan.
Ageing Substation Fleets in Mature Grids Drive Replacement Orders
Replacement demand gives the market a steady base that does not depend on new line construction. Large parts of the installed substation fleet in North America and Europe were energised in the 1970s and 1980s. Insulation ages, accuracy drifts and spare parts become scarce. Asset managers therefore schedule rolling renewal programmes, and current transformers are replaced bay by bay during planned outages rather than all at once.
Condition monitoring has sharpened this trend. Dissolved gas analysis, partial discharge testing and thermal surveys let utilities rank units by risk instead of replacing on age alone. Regulators in several markets allow renewal spending to enter the regulated asset base, which makes the business case easier to approve. The result is a predictable annual order stream for suppliers that hold type-test approvals and can match existing mounting footprints.
Restraints Impact Analysis of Market
Competition from Dry-Type, Gas-Insulated and Optical Sensing Alternatives
Alternative insulation technologies limit how far oil immersed designs can extend. Resin-cast dry-type units dominate indoor medium-voltage switchgear, where fire load rules and confined rooms make liquid insulation unattractive. Gas-insulated switchgear bundles measurement cores inside the sealed enclosure, removing the need for separate outdoor units. Optical and low-power electronic sensors add further pressure at the top of the voltage range.
The pull toward these alternatives comes from substation design rather than price. Urban sites are shrinking, so compact gas-insulated layouts win on footprint. Digital substation architectures favour sensors that output sampled values directly onto a process bus. Buyers also weigh maintenance effort, since sealed and solid-insulated products need no oil sampling. Oil immersed suppliers must therefore defend share on accuracy, short-circuit withstand and cost per bay rather than on familiarity.
Oil Handling Rules and Volatile Raw Material Costs Squeeze Suppliers
Compliance and input costs compress supplier margins and slow delivery. Mineral insulating oil brings containment, spill response and fire separation obligations at the substation. Sites need bunds, oil-water separators and documented disposal routes, which add civil cost to every installation. Transport of filled units is also restricted, so many suppliers ship dry and fill on site, extending commissioning schedules and raising project risk.
Material exposure compounds the problem. Copper conductor, grain-oriented electrical steel, porcelain or composite insulators and refined insulating oil together account for most of the bill of materials. Prices for these inputs move with energy and commodity cycles that manufacturers cannot hedge fully across multi-year framework contracts. Long type-test and qualification cycles make it hard to substitute materials quickly, so cost increases are absorbed before they can be passed through to utility buyers.
Market Opportunities
Renewable Interconnection Creates New Measurement Points
Renewable connections open a fast-growing pocket of demand that did not exist at scale a decade ago. Every wind farm, solar park and battery site needs a grid connection substation with metering accurate enough for settlement and protection cores fast enough for fault clearance. Because generation is dispersed, the industry is building many small substations instead of a few large ones, which multiplies the number of current transformers installed.
Offshore wind and long interconnectors extend the opportunity further. Converter stations, cable terminations and collector platforms each require instrument transformers rated for demanding duty. Developers value suppliers that can deliver matched sets quickly and support commissioning. Oil immersed units compete well here on accuracy class and short-circuit performance at higher voltages, giving established manufacturers a route into project pipelines backed by long-term power purchase agreements.
Ester Fluids and Digital Retrofits Open New Revenue
Two upgrades let suppliers earn more from the same installed base. Natural and synthetic ester fluids raise fire point and improve biodegradability compared with mineral oil. That helps utilities satisfy site fire-safety and environmental requirements without abandoning the oil immersed format they already know. Fluid qualification and retrofill services create aftermarket work that sits outside the normal replacement cycle.
The second route is digital. Adding temperature, moisture and partial discharge sensing to oil-filled units lets operators feed condition data into asset management systems. Interface modules can convert conventional secondary outputs into digital signals for modern protection relays, bridging older switchyards into process-bus architectures. Both moves align with standards work at the International Electrotechnical Commission and the Institute of Electrical and Electronics Engineers, and both lift margin above commodity hardware supply.
Category-wise Insights
Which Voltage Class Accounts for the Largest Share?
Medium voltage leads the market with 46.5% share in 2026, because distribution networks contain far more bays than transmission networks. Utilities install large numbers of units in primary substations, ring main units and industrial intake points, where unit prices are lower but volumes are high. Extra high voltage is the fastest-growing class at a 7.6% CAGR through 2033, with high voltage holding the remaining balance of demand.
The growth gap reflects where capital is flowing. Long transmission corridors, interconnectors and converter stations operate above 220 kV, and each bay carries premium-priced instrument transformers with demanding accuracy and short-circuit ratings. Grid operators are also raising voltage on existing routes to move more power through the same right of way. For suppliers, this means volume continues to come from medium voltage while value and margin shift steadily toward the extra high voltage range.
Dead-Tank Construction Holds Share While Live-Tank Designs Gain Ground
Dead-tank hairpin and top-core designs hold 57.5% share in 2026, reflecting their long record in outdoor substations. Placing the primary winding and core assembly at ground potential simplifies maintenance access, lowers the centre of gravity and improves seismic behaviour. Many utilities have standardised on this format, and existing foundations and support structures are already dimensioned for it.
Live-tank designs grow faster at a 6.7% CAGR through 2033. Their lighter weight and smaller base footprint suit compact switchyards and sites where civil works are expensive. Shorter erection time also matters on projects with tight outage windows. The practical outcome is a split market rather than a replacement cycle: brownfield renewal work tends to repeat the installed dead-tank format, while greenfield and space-constrained projects increasingly specify live-tank units, pushing suppliers to maintain both product families.
Protection Cores Dominate Volume as Combined Units Grow Faster
Protection applications lead with 44.0% share in 2026, since every protected circuit needs current measurement for relay operation. Protection cores must stay accurate during fault conditions many times rated current, which makes them a safety-critical purchase rather than a discretionary one. Metering applications follow, serving settlement, tariff billing and energy accounting duties with tighter accuracy at normal load.
Combined metering and protection units expand fastest at a 7.1% CAGR through 2033. Housing several cores in one tank reduces the number of structures, cable runs and bay positions required, which cuts civil and installation cost on crowded sites. Modern core materials and improved design tools make it easier to deliver different accuracy classes in a single unit without interference. For buyers, the trend lowers total installed cost per bay; for suppliers, it shifts competition toward engineering capability rather than simple unit price.
Utilities Anchor Demand While Renewable Interconnection Scales Quickest
Transmission and distribution utilities account for 54.0% share in 2026, making them the anchor customer group. Their procurement runs through multi-year framework agreements, standard technical specifications and qualified vendor lists, which rewards suppliers with proven type-test records. Industrial and manufacturing plants follow, buying units for intake substations, large motor feeders and captive generation.
Renewable energy and interconnection projects grow fastest at an 8.1% CAGR through 2033. Dispersed wind, solar and storage sites each need their own connection substation, so the count of installed units rises faster than installed generating capacity. Railways and transport infrastructure add further demand through traction supply points. The broader implication is a widening customer base: suppliers that once sold mainly to national utilities now serve developers, independent power producers and engineering contractors with shorter decision cycles and tighter delivery expectations.
Geography Analysis
North America Rebuilds Decades-Old Substation Assets
North America holds 20.0% share in 2026 and is forecast to grow at a 4.9% CAGR through 2033. The United States and Canada account for most demand, with Mexico contributing through industrial and distribution investment. Growth is led by renewal rather than expansion, since much of the transmission fleet dates from the 1970s and 1980s.
Regional transmission organisations are approving reliability and resilience spending, including hardening against wildfire, storm and extreme cold events. Interconnection queues for wind, solar and battery projects are long, and each cleared project needs a new substation. Utilities generally work within rate-regulated capital plans, so orders arrive as predictable annual programmes. Domestic content preferences in public funding have also encouraged suppliers to add or expand local assembly and testing capability.
Europe Balances Grid Upgrades with Environmental Compliance
Europe holds 23.5% share in 2026 and is expected to grow at a 5.2% CAGR through 2033. Germany, France, the United Kingdom, Italy and the Nordic countries lead spending, supported by cross-border interconnection and offshore wind connection work. Grid operators are reinforcing north-south corridors to move renewable output toward industrial demand centres.
Environmental rules shape product choice more strongly here than elsewhere. Pressure to reduce fluorinated insulating gases has renewed interest in liquid-insulated alternatives, while spill containment and fire-safety requirements push buyers toward ester fluids. Harmonised technical standards allow suppliers to serve several national markets from one design family, which supports competition. Long permitting timelines for new lines moderate growth, so much of the demand comes from uprating and refurbishing existing substations.
Which Region Is Leading the Oil Immersed Current Transformer Market?
Asia Pacific leads the market with 41.0% share in 2026 and is growing at a 7.0% CAGR through 2033. China and India dominate volume, supported by Japan, South Korea, Australia and fast-growing Southeast Asian networks. The region installs more new substation bays each year than any other, which directly drives instrument transformer consumption.
The reasons are structural. Electricity demand is still rising with industrial output and urban population growth, so networks expand rather than simply renew. Both China and India are building ultra-high-voltage transmission to carry power from inland generation to coastal load. Strong local manufacturing keeps lead times short and prices competitive, and domestic suppliers compete alongside global groups. Rural electrification and distribution strengthening programmes add a steady base of medium-voltage orders.
Latin America Extends Transmission Links to Remote Generation
Latin America holds 6.0% share in 2026 and is projected to grow at a 5.6% CAGR through 2033. Brazil is the largest market, followed by Chile, Colombia, Peru and Argentina. Demand is concentrated in transmission, because hydro, wind and solar resources sit far from the main consumption centres.
Competitive transmission auctions in Brazil and Chile award long concessions that include substation construction, giving suppliers visible project pipelines. Mining operations in the Andean countries add industrial demand for intake and distribution substations. Currency volatility and financing cost remain the main constraints on project timing. Regional manufacturing and assembly capacity, particularly in Brazil, helps shorten delivery and reduces exposure to import duties on heavy electrical equipment.
Which Region Is Growing Fastest in the Oil Immersed Current Transformer Market?
Middle East & Africa is growing fastest at a 7.3% CAGR through 2033, from 9.5% share in 2026. Saudi Arabia, the United Arab Emirates, Egypt, South Africa and Nigeria account for most of the activity. Large-scale desert solar, new industrial cities and cross-border interconnection are creating substation demand from a relatively small installed base.
Growth is driven by diversification programmes in the Gulf states that pair new generation with new transmission backbone. Electrification access programmes across sub-Saharan Africa add medium-voltage distribution demand. High ambient temperature, dust and humidity push buyers toward robust outdoor equipment with proven thermal performance, which favours oil immersed designs. Projects are often delivered by international engineering contractors, so suppliers compete on turnkey delivery capability as much as on product specification.
Competitive Landscape
The market is moderately concentrated. A small group of diversified electrical equipment groups holds the largest combined share, supported by global manufacturing networks, type-test laboratories and long-standing utility framework agreements. Around them sits a substantial tier of specialist instrument transformer manufacturers that compete effectively on engineering depth, customisation and responsiveness. Regional producers in Asia Pacific have steadily gained ground by serving domestic grid programmes at competitive cost. The structure signals a mature market where entry is limited less by capital than by qualification: utilities require documented type approvals and long reference lists, so share shifts slowly and tends to follow plant investment and approval wins rather than pricing moves.
Competition centres on technical and commercial fundamentals rather than novelty. Vendors differentiate on accuracy class consistency, short-circuit withstand capability, dielectric performance, seismic rating and the ability to combine several cores in one tank. Delivery lead time has become a decisive factor as project schedules tighten, so capacity availability and local assembly matter. Environmental positioning is a growing differentiator, with ester fluid options, lower-loss core materials and recyclable components appearing on specification sheets. Suppliers of electronic and optical sensing technologies are entering adjacent positions, which pushes conventional manufacturers to offer digital interfaces alongside traditional secondary outputs.
Strategic activity concentrates on capacity, qualification and aftermarket depth. Manufacturers are expanding plants and test facilities in regions where grid spending is rising, because local presence shortens delivery and meets domestic content expectations. Investment in condition monitoring, retrofit services and fluid management extends revenue beyond the original sale. Research spending is weighted toward alternative insulating fluids, compact designs and digital integration, reflecting where utility specifications are heading. Fairfield Market Research observes that competitive direction now rests on combining proven electrical performance with shorter lead times, lower environmental impact and credible digital readiness.
Industry Leaders
- ABB Ltd.
- Hitachi Energy Ltd.
- Siemens Energy AG
- GE Vernova Inc.
- Schneider Electric SE
- Mitsubishi Electric Corporation
- Arteche Group
Companies Covered in the Report
- ABB Ltd.
- Hitachi Energy Ltd.
- Siemens Energy AG
- GE Vernova Inc.
- Schneider Electric SE
- Eaton Corporation plc
- Mitsubishi Electric Corporation
- Toshiba Energy Systems & Solutions Corporation
- Hyosung Heavy Industries Corporation
- Trench Group
- Arteche Group
- Pfiffner Group
- Ritz Instrument Transformers GmbH
- Koncar Instrument Transformers Inc.
- CG Power and Industrial Solutions Limited
- Bharat Heavy Electricals Limited
Oil Immersed Current Transformer Market Report Scope
The market is segmented by voltage rating, design, application and end use, and analysed across five regions.
| By Voltage Rating | Medium Voltage, High Voltage, Extra High Voltage |
| By Design | Dead-Tank (Hairpin and Top-Core), Live-Tank |
| By Application | Metering, Protection, Combined Metering and Protection |
| By End Use | Transmission and Distribution Utilities, Industrial and Manufacturing, Renewable Energy and Interconnection, Railways and Transport Infrastructure |
| By Region | North America, Europe, Asia Pacific, Latin America, Middle East & Africa |
1. Executive Summary
1.1 Global Oil Immersed Current Transformer Market Snapshot
1.2 Future Projections, 2026–2033
1.3 Key Industry Highlights
1.4 Regional Snapshot
2. Market Overview
2.1 Market Definition and Report Scope
2.2 Market Dynamics
2.2.1 Drivers
2.2.1.1 Grid Expansion and New Substation Capacity Lift Unit Demand
2.2.1.2 Ageing Substation Fleets in Mature Grids Drive Replacement Orders
2.2.2 Restraints
2.2.2.1 Competition from Dry-Type, Gas-Insulated and Optical Sensing Alternatives
2.2.2.2 Oil Handling Rules and Volatile Raw Material Costs Squeeze Suppliers
2.2.3 Market Opportunities
2.2.3.1 Renewable Interconnection Creates New Measurement Points
2.2.3.2 Ester Fluids and Digital Retrofits Open New Revenue
3. Global Oil Immersed Current Transformer Market Outlook, 2026–2033
3.1 Global Oil Immersed Current Transformer Market Outlook, by Voltage Rating, Value (US$ Bn), 2026–2033
3.1.1 Medium Voltage
3.1.2 High Voltage
3.1.3 Extra High Voltage
3.2 Global Oil Immersed Current Transformer Market Outlook, by Design, Value (US$ Bn), 2026–2033
3.2.1 Dead-Tank (Hairpin and Top-Core)
3.2.2 Live-Tank
3.3 Global Oil Immersed Current Transformer Market Outlook, by Application, Value (US$ Bn), 2026–2033
3.3.1 Metering
3.3.2 Protection
3.3.3 Combined Metering and Protection
3.4 Global Oil Immersed Current Transformer Market Outlook, by End Use, Value (US$ Bn), 2026–2033
3.4.1 Transmission and Distribution Utilities
3.4.2 Industrial and Manufacturing
3.4.3 Renewable Energy and Interconnection
3.4.4 Railways and Transport Infrastructure
3.5 Global Oil Immersed Current Transformer Market Outlook, by Region, Value (US$ Bn), 2026–2033
3.5.1 North America
3.5.2 Europe
3.5.3 Asia Pacific
3.5.4 Latin America
3.5.5 Middle East & Africa
4. North America Oil Immersed Current Transformer Market Outlook, 2026–2033
4.1 North America Oil Immersed Current Transformer Market Outlook, by Voltage Rating, Value (US$ Bn), 2026–2033
4.1.1 Medium Voltage
4.1.2 High Voltage
4.1.3 Extra High Voltage
4.2 North America Oil Immersed Current Transformer Market Outlook, by Design, Value (US$ Bn), 2026–2033
4.2.1 Dead-Tank (Hairpin and Top-Core)
4.2.2 Live-Tank
4.3 North America Oil Immersed Current Transformer Market Outlook, by Application, Value (US$ Bn), 2026–2033
4.3.1 Metering
4.3.2 Protection
4.3.3 Combined Metering and Protection
4.4 North America Oil Immersed Current Transformer Market Outlook, by End Use, Value (US$ Bn), 2026–2033
4.4.1 Transmission and Distribution Utilities
4.4.2 Industrial and Manufacturing
4.4.3 Renewable Energy and Interconnection
4.4.4 Railways and Transport Infrastructure
4.5 North America Oil Immersed Current Transformer Market Outlook, by Country, Value (US$ Bn), 2026–2033
4.5.1 United States Oil Immersed Current Transformer Market Outlook, by Voltage Rating, 2026–2033
4.5.2 United States Oil Immersed Current Transformer Market Outlook, by Design, 2026–2033
4.5.3 United States Oil Immersed Current Transformer Market Outlook, by Application, 2026–2033
4.5.4 United States Oil Immersed Current Transformer Market Outlook, by End Use, 2026–2033
4.5.5 Canada Oil Immersed Current Transformer Market Outlook, by Voltage Rating, 2026–2033
4.5.6 Canada Oil Immersed Current Transformer Market Outlook, by Design, 2026–2033
4.5.7 Canada Oil Immersed Current Transformer Market Outlook, by Application, 2026–2033
4.5.8 Canada Oil Immersed Current Transformer Market Outlook, by End Use, 2026–2033
4.5.9 Mexico Oil Immersed Current Transformer Market Outlook, by Voltage Rating, 2026–2033
4.5.10 Mexico Oil Immersed Current Transformer Market Outlook, by Design, 2026–2033
4.5.11 Mexico Oil Immersed Current Transformer Market Outlook, by Application, 2026–2033
4.5.12 Mexico Oil Immersed Current Transformer Market Outlook, by End Use, 2026–2033
5. Europe Oil Immersed Current Transformer Market Outlook, 2026–2033
5.1 Europe Oil Immersed Current Transformer Market Outlook, by Voltage Rating, Value (US$ Bn), 2026–2033
5.1.1 Medium Voltage
5.1.2 High Voltage
5.1.3 Extra High Voltage
5.2 Europe Oil Immersed Current Transformer Market Outlook, by Design, Value (US$ Bn), 2026–2033
5.2.1 Dead-Tank (Hairpin and Top-Core)
5.2.2 Live-Tank
5.3 Europe Oil Immersed Current Transformer Market Outlook, by Application, Value (US$ Bn), 2026–2033
5.3.1 Metering
5.3.2 Protection
5.3.3 Combined Metering and Protection
5.4 Europe Oil Immersed Current Transformer Market Outlook, by End Use, Value (US$ Bn), 2026–2033
5.4.1 Transmission and Distribution Utilities
5.4.2 Industrial and Manufacturing
5.4.3 Renewable Energy and Interconnection
5.4.4 Railways and Transport Infrastructure
5.5 Europe Oil Immersed Current Transformer Market Outlook, by Country and Subregion, Value (US$ Bn), 2026–2033
5.5.1 Germany Oil Immersed Current Transformer Market Outlook, by Voltage Rating, 2026–2033
5.5.2 Germany Oil Immersed Current Transformer Market Outlook, by Design, 2026–2033
5.5.3 Germany Oil Immersed Current Transformer Market Outlook, by Application, 2026–2033
5.5.4 Germany Oil Immersed Current Transformer Market Outlook, by End Use, 2026–2033
5.5.5 France Oil Immersed Current Transformer Market Outlook, by Voltage Rating, 2026–2033
5.5.6 France Oil Immersed Current Transformer Market Outlook, by Design, 2026–2033
5.5.7 France Oil Immersed Current Transformer Market Outlook, by Application, 2026–2033
5.5.8 France Oil Immersed Current Transformer Market Outlook, by End Use, 2026–2033
5.5.9 United Kingdom Oil Immersed Current Transformer Market Outlook, by Voltage Rating, 2026–2033
5.5.10 United Kingdom Oil Immersed Current Transformer Market Outlook, by Design, 2026–2033
5.5.11 United Kingdom Oil Immersed Current Transformer Market Outlook, by Application, 2026–2033
5.5.12 United Kingdom Oil Immersed Current Transformer Market Outlook, by End Use, 2026–2033
5.5.13 Italy Oil Immersed Current Transformer Market Outlook, by Voltage Rating, 2026–2033
5.5.14 Italy Oil Immersed Current Transformer Market Outlook, by Design, 2026–2033
5.5.15 Italy Oil Immersed Current Transformer Market Outlook, by Application, 2026–2033
5.5.16 Italy Oil Immersed Current Transformer Market Outlook, by End Use, 2026–2033
5.5.17 Nordic countries Oil Immersed Current Transformer Market Outlook, by Voltage Rating, 2026–2033
5.5.18 Nordic countries Oil Immersed Current Transformer Market Outlook, by Design, 2026–2033
5.5.19 Nordic countries Oil Immersed Current Transformer Market Outlook, by Application, 2026–2033
5.5.20 Nordic countries Oil Immersed Current Transformer Market Outlook, by End Use, 2026–2033
6. Asia Pacific Oil Immersed Current Transformer Market Outlook, 2026–2033
6.1 Asia Pacific Oil Immersed Current Transformer Market Outlook, by Voltage Rating, Value (US$ Bn), 2026–2033
6.1.1 Medium Voltage
6.1.2 High Voltage
6.1.3 Extra High Voltage
6.2 Asia Pacific Oil Immersed Current Transformer Market Outlook, by Design, Value (US$ Bn), 2026–2033
6.2.1 Dead-Tank (Hairpin and Top-Core)
6.2.2 Live-Tank
6.3 Asia Pacific Oil Immersed Current Transformer Market Outlook, by Application, Value (US$ Bn), 2026–2033
6.3.1 Metering
6.3.2 Protection
6.3.3 Combined Metering and Protection
6.4 Asia Pacific Oil Immersed Current Transformer Market Outlook, by End Use, Value (US$ Bn), 2026–2033
6.4.1 Transmission and Distribution Utilities
6.4.2 Industrial and Manufacturing
6.4.3 Renewable Energy and Interconnection
6.4.4 Railways and Transport Infrastructure
6.5 Asia Pacific Oil Immersed Current Transformer Market Outlook, by Country, Value (US$ Bn), 2026–2033
6.5.1 China Oil Immersed Current Transformer Market Outlook, by Voltage Rating, 2026–2033
6.5.2 China Oil Immersed Current Transformer Market Outlook, by Design, 2026–2033
6.5.3 China Oil Immersed Current Transformer Market Outlook, by Application, 2026–2033
6.5.4 China Oil Immersed Current Transformer Market Outlook, by End Use, 2026–2033
6.5.5 India Oil Immersed Current Transformer Market Outlook, by Voltage Rating, 2026–2033
6.5.6 India Oil Immersed Current Transformer Market Outlook, by Design, 2026–2033
6.5.7 India Oil Immersed Current Transformer Market Outlook, by Application, 2026–2033
6.5.8 India Oil Immersed Current Transformer Market Outlook, by End Use, 2026–2033
6.5.9 Japan Oil Immersed Current Transformer Market Outlook, by Voltage Rating, 2026–2033
6.5.10 Japan Oil Immersed Current Transformer Market Outlook, by Design, 2026–2033
6.5.11 Japan Oil Immersed Current Transformer Market Outlook, by Application, 2026–2033
6.5.12 Japan Oil Immersed Current Transformer Market Outlook, by End Use, 2026–2033
6.5.13 South Korea Oil Immersed Current Transformer Market Outlook, by Voltage Rating, 2026–2033
6.5.14 South Korea Oil Immersed Current Transformer Market Outlook, by Design, 2026–2033
6.5.15 South Korea Oil Immersed Current Transformer Market Outlook, by Application, 2026–2033
6.5.16 South Korea Oil Immersed Current Transformer Market Outlook, by End Use, 2026–2033
6.5.17 Australia Oil Immersed Current Transformer Market Outlook, by Voltage Rating, 2026–2033
6.5.18 Australia Oil Immersed Current Transformer Market Outlook, by Design, 2026–2033
6.5.19 Australia Oil Immersed Current Transformer Market Outlook, by Application, 2026–2033
6.5.20 Australia Oil Immersed Current Transformer Market Outlook, by End Use, 2026–2033
7. Latin America Oil Immersed Current Transformer Market Outlook, 2026–2033
7.1 Latin America Oil Immersed Current Transformer Market Outlook, by Voltage Rating, Value (US$ Bn), 2026–2033
7.1.1 Medium Voltage
7.1.2 High Voltage
7.1.3 Extra High Voltage
7.2 Latin America Oil Immersed Current Transformer Market Outlook, by Design, Value (US$ Bn), 2026–2033
7.2.1 Dead-Tank (Hairpin and Top-Core)
7.2.2 Live-Tank
7.3 Latin America Oil Immersed Current Transformer Market Outlook, by Application, Value (US$ Bn), 2026–2033
7.3.1 Metering
7.3.2 Protection
7.3.3 Combined Metering and Protection
7.4 Latin America Oil Immersed Current Transformer Market Outlook, by End Use, Value (US$ Bn), 2026–2033
7.4.1 Transmission and Distribution Utilities
7.4.2 Industrial and Manufacturing
7.4.3 Renewable Energy and Interconnection
7.4.4 Railways and Transport Infrastructure
7.5 Latin America Oil Immersed Current Transformer Market Outlook, by Country, Value (US$ Bn), 2026–2033
7.5.1 Brazil Oil Immersed Current Transformer Market Outlook, by Voltage Rating, 2026–2033
7.5.2 Brazil Oil Immersed Current Transformer Market Outlook, by Design, 2026–2033
7.5.3 Brazil Oil Immersed Current Transformer Market Outlook, by Application, 2026–2033
7.5.4 Brazil Oil Immersed Current Transformer Market Outlook, by End Use, 2026–2033
7.5.5 Chile Oil Immersed Current Transformer Market Outlook, by Voltage Rating, 2026–2033
7.5.6 Chile Oil Immersed Current Transformer Market Outlook, by Design, 2026–2033
7.5.7 Chile Oil Immersed Current Transformer Market Outlook, by Application, 2026–2033
7.5.8 Chile Oil Immersed Current Transformer Market Outlook, by End Use, 2026–2033
7.5.9 Colombia Oil Immersed Current Transformer Market Outlook, by Voltage Rating, 2026–2033
7.5.10 Colombia Oil Immersed Current Transformer Market Outlook, by Design, 2026–2033
7.5.11 Colombia Oil Immersed Current Transformer Market Outlook, by Application, 2026–2033
7.5.12 Colombia Oil Immersed Current Transformer Market Outlook, by End Use, 2026–2033
7.5.13 Peru Oil Immersed Current Transformer Market Outlook, by Voltage Rating, 2026–2033
7.5.14 Peru Oil Immersed Current Transformer Market Outlook, by Design, 2026–2033
7.5.15 Peru Oil Immersed Current Transformer Market Outlook, by Application, 2026–2033
7.5.16 Peru Oil Immersed Current Transformer Market Outlook, by End Use, 2026–2033
7.5.17 Argentina Oil Immersed Current Transformer Market Outlook, by Voltage Rating, 2026–2033
7.5.18 Argentina Oil Immersed Current Transformer Market Outlook, by Design, 2026–2033
7.5.19 Argentina Oil Immersed Current Transformer Market Outlook, by Application, 2026–2033
7.5.20 Argentina Oil Immersed Current Transformer Market Outlook, by End Use, 2026–2033
8. Middle East & Africa Oil Immersed Current Transformer Market Outlook, 2026–2033
8.1 Middle East & Africa Oil Immersed Current Transformer Market Outlook, by Voltage Rating, Value (US$ Bn), 2026–2033
8.1.1 Medium Voltage
8.1.2 High Voltage
8.1.3 Extra High Voltage
8.2 Middle East & Africa Oil Immersed Current Transformer Market Outlook, by Design, Value (US$ Bn), 2026–2033
8.2.1 Dead-Tank (Hairpin and Top-Core)
8.2.2 Live-Tank
8.3 Middle East & Africa Oil Immersed Current Transformer Market Outlook, by Application, Value (US$ Bn), 2026–2033
8.3.1 Metering
8.3.2 Protection
8.3.3 Combined Metering and Protection
8.4 Middle East & Africa Oil Immersed Current Transformer Market Outlook, by End Use, Value (US$ Bn), 2026–2033
8.4.1 Transmission and Distribution Utilities
8.4.2 Industrial and Manufacturing
8.4.3 Renewable Energy and Interconnection
8.4.4 Railways and Transport Infrastructure
8.5 Middle East & Africa Oil Immersed Current Transformer Market Outlook, by Country and Subregion, Value (US$ Bn), 2026–2033
8.5.1 Saudi Arabia Oil Immersed Current Transformer Market Outlook, by Voltage Rating, 2026–2033
8.5.2 Saudi Arabia Oil Immersed Current Transformer Market Outlook, by Design, 2026–2033
8.5.3 Saudi Arabia Oil Immersed Current Transformer Market Outlook, by Application, 2026–2033
8.5.4 Saudi Arabia Oil Immersed Current Transformer Market Outlook, by End Use, 2026–2033
8.5.5 United Arab Emirates Oil Immersed Current Transformer Market Outlook, by Voltage Rating, 2026–2033
8.5.6 United Arab Emirates Oil Immersed Current Transformer Market Outlook, by Design, 2026–2033
8.5.7 United Arab Emirates Oil Immersed Current Transformer Market Outlook, by Application, 2026–2033
8.5.8 United Arab Emirates Oil Immersed Current Transformer Market Outlook, by End Use, 2026–2033
8.5.9 Egypt Oil Immersed Current Transformer Market Outlook, by Voltage Rating, 2026–2033
8.5.10 Egypt Oil Immersed Current Transformer Market Outlook, by Design, 2026–2033
8.5.11 Egypt Oil Immersed Current Transformer Market Outlook, by Application, 2026–2033
8.5.12 Egypt Oil Immersed Current Transformer Market Outlook, by End Use, 2026–2033
8.5.13 South Africa Oil Immersed Current Transformer Market Outlook, by Voltage Rating, 2026–2033
8.5.14 South Africa Oil Immersed Current Transformer Market Outlook, by Design, 2026–2033
8.5.15 South Africa Oil Immersed Current Transformer Market Outlook, by Application, 2026–2033
8.5.16 South Africa Oil Immersed Current Transformer Market Outlook, by End Use, 2026–2033
8.5.17 Nigeria Oil Immersed Current Transformer Market Outlook, by Voltage Rating, 2026–2033
8.5.18 Nigeria Oil Immersed Current Transformer Market Outlook, by Design, 2026–2033
8.5.19 Nigeria Oil Immersed Current Transformer Market Outlook, by Application, 2026–2033
8.5.20 Nigeria Oil Immersed Current Transformer Market Outlook, by End Use, 2026–2033
8.5.21 Gulf states Oil Immersed Current Transformer Market Outlook, by Voltage Rating, 2026–2033
8.5.22 Gulf states Oil Immersed Current Transformer Market Outlook, by Design, 2026–2033
8.5.23 Gulf states Oil Immersed Current Transformer Market Outlook, by Application, 2026–2033
8.5.24 Gulf states Oil Immersed Current Transformer Market Outlook, by End Use, 2026–2033
9. Competitive Landscape
9.1 Industry Leaders
9.2 Company Profiles
9.2.1 ABB Ltd.
9.2.2 Hitachi Energy Ltd.
9.2.3 Siemens Energy AG
9.2.4 GE Vernova Inc.
9.2.5 Schneider Electric SE
9.2.6 Eaton Corporation plc
9.2.7 Mitsubishi Electric Corporation
9.2.8 Toshiba Energy Systems & Solutions Corporation
9.2.9 Hyosung Heavy Industries Corporation
9.2.10 Trench Group
9.2.11 Arteche Group
9.2.12 Pfiffner Group
9.2.13 Ritz Instrument Transformers GmbH
9.2.14 Koncar Instrument Transformers Inc.
9.2.15 CG Power and Industrial Solutions Limited
9.2.16 Bharat Heavy Electricals Limited
10. Appendix
10.1 Research Methodology
10.2 Report Assumptions
10.3 Acronyms and Abbreviations
| By Voltage Rating | Medium Voltage, High Voltage, Extra High Voltage |
| By Design | Dead-Tank (Hairpin and Top-Core), Live-Tank |
| By Application | Metering, Protection, Combined Metering and Protection |
| By End Use | Transmission and Distribution Utilities, Industrial and Manufacturing, Renewable Energy and Interconnection, Railways and Transport Infrastructure |
| By Region | North America, Europe, Asia Pacific, Latin America, Middle East & Africa |
Our Research Methodology
Considering the volatility of business today, traditional approaches to strategizing a game plan can be unfruitful if not detrimental. True ambiguity is no way to determine a forecast. A myriad of predetermined factors must be accounted for such as the degree of risk involved, the magnitude of circumstances, as well as conditions or consequences that are not known or unpredictable. To circumvent binary views that cast uncertainty, the application of market research intelligence to strategically posture, move, and enable actionable outcomes is necessary.
View Methodology
Quality Assured
Rigorous Validation Process

Confidentiality Assured
End-to-end Data Security

Custom Research Services
Tailored To Your Objectives
FAQs
The market is valued at US$ 2.4 Bn in 2026, supported by substation construction, grid replacement programmes and renewable interconnection work carried out worldwide.
The market is projected to grow at a 6.0% CAGR between 2026 and 2033, reaching US$ 3.6 Bn by the forecast year.
Protection current transformers lead with 44.0% share in 2026, while combined metering and protection units grow fastest at a 7.1% CAGR.
Asia Pacific holds 41.0% share in 2026, while Middle East & Africa expands fastest at a 7.3% CAGR through 2033 on new transmission links.
The landscape is moderately concentrated, with large electrical equipment groups competing alongside specialist instrument transformer makers on accuracy, delivery time and service support.
Related Reports
Load Forecasting Solution Market Size, Share, Insights, Competitive Landscape, and Forecast 2026 to 2033
The load forecasting solution market is projected to reach US$3.0 billion by 2033. Explore demand by forecast horizon, deployment mode, and end user.
Enhanced Oil Recovery Market Size, Share, Insights, Competitive Landscape, and Forecast 2026 to 2033
The global enhanced oil recovery market is valued at US$46.5 billion in 2026, reaching US$58.9 billion by 2033, growing at a 3.43% CAGR
Biochar Gasification Market Size, Share, Insights, Competitive Landscape, and Forecast 2026 to 2033
The global biochar gasification market is valued at US$0.6 billion in 2026, reaching US$1.4 billion by 2033, growing at a 12.87% CAGR
AC-Coupled Energy Storage Inverter Market Size, Share, Insights, Competitive Landscape, and Forecast 2026 to 2033
The AC-coupled energy storage inverter market is forecast to grow from US$ 4.2 billion in 2026 to US$ 10.5 billion by 2033 at a 13.99% CAGR.
Steam Turbine Aftermarket Size, Share, Insights, Competitive Landscape, and Forecast 2026 to 2033
The Steam Turbine Aftermarket is projected to rise from US$ 4.56 billion in 2026 to US$ 6.29 billion by 2033 at a 4.7% CAGR. Explore key service trends.
Power EPC Market Size, Share, Insights, Competitive Landscape, and Forecast 2026 to 2033
Power EPC Market is projected to rise from US$ 780.56 billion in 2026 to US$ 1,220.97 billion by 2033 at a 6.6% CAGR. Explore generation and project trends.