



Power EPC Market
Power EPC Market Size, Share, Insights, Competitive Landscape, and Forecast 2026 to 2033
How Fast Is the Power EPC Market Growing?
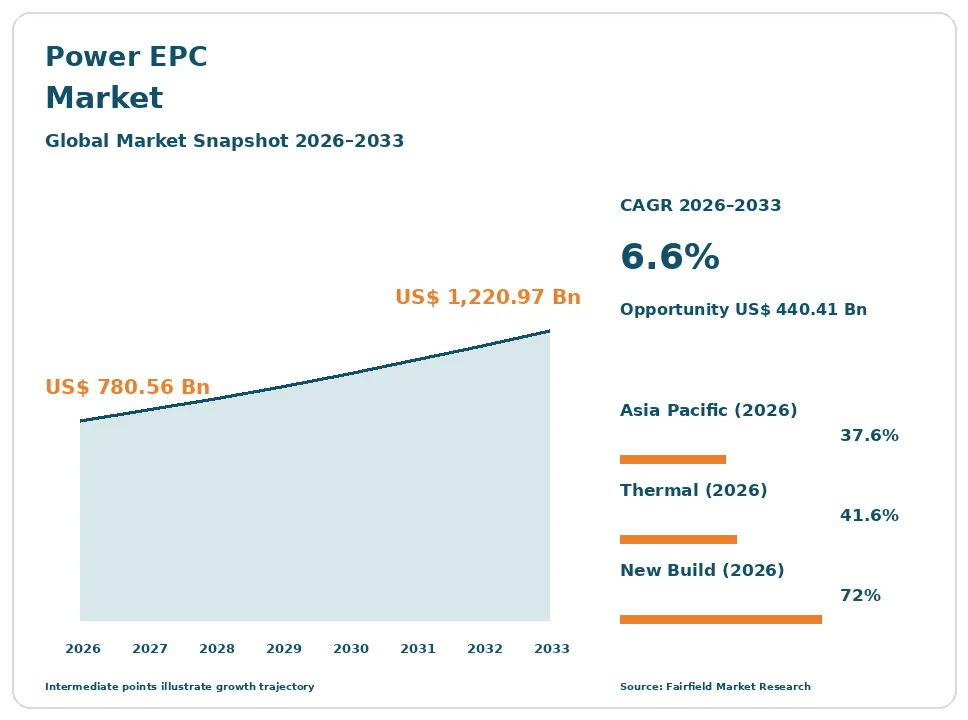
The global power EPC market size is expected to be valued at US$ 780.56 billion in 2026 and projected to reach US$ 1,220.97 billion by 2033, growing at a CAGR of 6.6% between 2026 and 2033.
Between 2020 and 2025, the market grew at a CAGR of about 5.5%, as project awards slowed during the pandemic, then recovered strongly with record renewable energy installations, new gas plants, nuclear programs, and grid investments. Power EPC refers to engineering, procurement, and construction contracts in which one contractor or consortium designs a power plant or grid project, buys turbines, panels, transformers, and other equipment, and builds and commissions the facility. Projects include coal, gas, nuclear, hydro, solar, wind, and battery storage plants, along with substations and transmission lines. These power plant construction contracts help owners control cost, schedule, and risk. Growth comes from rising electricity demand from data centers, electrification, and industrial growth, together with decarbonization targets. The market is shifting toward renewables, storage, gas plants that back up renewables, and grid expansion. In June 2026, China Energy Engineering won a US$ 1.687 billion EPC contract for the 2,600 MW Taweelah C gas plant in Abu Dhabi.
Key Report Takeaways
- By Generation Type: Thermal held 41.6% share in 2026, while Renewable is projected to expand at a 9.2% CAGR through 2033, driven by large solar, wind, and hybrid projects supported by clean energy targets and falling equipment costs.
- By Equipment: Steam Turbines held 27.7% share in 2026, while Energy Storage Systems are projected to expand at a 12.5% CAGR through 2033, driven by grid-scale batteries paired with solar and wind to stabilize supply.
- By Project Type: New Build held 72.0% share in 2026, while Retrofit & Upgrade is projected to expand at a 7.4% CAGR through 2033, driven by plant life extension, efficiency upgrades, and emissions controls on existing fleets.
- By Region: Asia Pacific held 37.6% share in 2026, while India is projected to expand at a 8.4% CAGR through 2033, driven by rising power demand, large solar and thermal additions, nuclear expansion, and transmission investments.
Global Power EPC Market Trends and Insights
Drivers Impact Analysis
Two drivers carry the strongest influence on power EPC demand during the forecast period.
Rising Electricity Demand Is Driving the Power EPC Market
Rising electricity demand and capacity additions are the strongest driver of the power EPC market. The world needs much more power.
The mechanism is fast growth in power consumption. Data centers supporting artificial intelligence and cloud computing are adding large new loads in the United States, Europe, and Asia Pacific. Electric vehicles, heat pumps, and industrial electrification shift energy use from fuels to electricity. Population and income growth in India, Indonesia, Vietnam, Nigeria, Egypt, and Saudi Arabia raise demand for air conditioning and appliances. Utilities and independent power producers must add generation, storage, and transmission quickly, and most new projects are delivered through EPC contracts. PowerChina and Lilama signed a US$ 962 million contract for a 1,612 MW LNG power plant in Vietnam in February 2026. These trends create a long pipeline of power plant construction work.
Energy Transition Is Expanding the Power EPC Market
Energy transition and renewable energy targets are expanding the power EPC market. Clean power projects need specialized contractors.
The cause is climate policy and falling clean energy costs. Governments target large increases in solar, wind, and storage capacity, and solar is now among the cheapest sources of new power in many regions. Gigawatt-scale solar parks in Saudi Arabia, the United Arab Emirates, India, and China require large EPC teams. Nuclear programs in Europe and Asia Pacific are reviving, with Hyundai E&C signing an EPC deal for two reactors in Bulgaria. Gas plants are being built to back up renewables. Hydropower and pumped storage projects in China, India, and Australia add large civil works. Offshore wind farms need foundations, cables, and substations at sea. These shifts expand the range of EPC work and favor contractors with broad technical skills.
| Driver | Impact on CAGR Forecast | Geographic Relevance | Impact Timeline |
| Rising electricity demand and capacity additions | High | Global | Long term (≥4 years) |
| Energy transition and renewable energy targets | High | Asia Pacific, Europe, Middle East & Africa | Medium term (2-4 years) |
Restraints Impact Analysis
Two restraints limit how quickly the power EPC market grows.
Equipment Shortages Slow the Power EPC Market
Equipment shortages and supply chain delays slow the power EPC market. Key equipment is in short supply.
The specific causes are surging demand and limited factory capacity. Gas turbines, large power transformers, high-voltage switchgear, and cables have long waiting times, sometimes several years, because manufacturers cannot expand quickly enough. Prices for this equipment have risen sharply. Trade tariffs and restrictions on Chinese solar panels and components affect project costs in some markets. Skilled workers such as electricians, welders, and engineers are scarce. Solar panel and battery prices have swung sharply, making fixed-price bids risky. Some equipment makers now ask for early reservation payments, which ties up developer capital. Logistics for very heavy items, such as large transformers and turbine parts, require special ships and roads. These delays push back project schedules and raise costs.
Financing and Permitting Restrict the Power EPC Market
Fixed-price risk, financing, and permitting challenges restrict the power EPC market. Projects carry significant risks.
The underlying causes are contract structures and approval processes. Under fixed-price contracts, EPC firms absorb cost overruns, and several contractors have lost money on large projects. Higher interest rates raise financing costs for developers and utilities. Permitting and grid connection queues delay projects, and some offshore wind projects, such as Ørsted’s Hornsea 4, have been cancelled due to rising costs. Local opposition to new power lines, wind farms, and plants can delay approvals for years. In some countries, power purchase agreements are renegotiated or delayed, which affects contractor payments. Currency swings and political changes raise risks for international projects in emerging markets. These factors slow project awards and make contractors more selective.
| Restraint | Impact on CAGR Forecast | Geographic Relevance | Impact Timeline |
| Equipment shortages and supply chain delays | High | Global | Medium term (2-4 years) |
| Fixed-price risk, financing, and permitting challenges | Medium | Global | Long term (≥4 years) |
Market Opportunities
Grid Expansion and Energy Storage Open a Fast-Growth Revenue Pool
Grid expansion and energy storage open a fast-growth revenue pool in the power EPC market. Clean power needs stronger grids.
EPC contractors can capture this opportunity. Transmission lines, substations, interconnectors between countries, and grid-scale battery storage are needed to connect remote solar and wind farms, balance variable supply, and serve new data centers and industrial parks. Many grids in North America and Europe are decades old and must be rebuilt, while China is expanding ultra-high-voltage lines and India is building green energy corridors. Battery storage projects are growing quickly in California, Texas, Australia, China, and Saudi Arabia, often paired with solar plants. Companies with grid, high-voltage, and storage integration expertise can win large, repeat contracts as utilities invest record sums in networks.
Nuclear and Data Center Power Create a Premium Revenue Pool
Nuclear power and data center supply create a premium revenue pool in the power EPC market. Reliable, around-the-clock power is in high demand.
Experienced contractors can capture this opportunity. New large reactors in Bulgaria, Poland, the Czech Republic, India, and China, along with small modular reactors planned in North America and Europe, require highly specialized engineering, safety-grade procurement, and complex construction. Life extension and power uprate projects at existing nuclear plants add steady work. Technology companies building large data centers are signing deals for dedicated gas, nuclear, and renewable supply, sometimes with on-site generation. These projects need fast delivery and high reliability, which supports premium pricing. Contractors with nuclear licenses, quality systems, and strong safety records face limited competition. Companies with these capabilities can earn premium margins and long-term relationships with utilities and technology firms.
Segment Analysis
By Generation Type: Thermal Leads While Renewable Grows Fastest
Thermal held 41.6% share in 2026. Coal, gas, and combined cycle plants remain the largest source of EPC spending because they are large, complex, and costly to build, and many countries in Asia Pacific and Middle East & Africa still add thermal capacity for reliable supply. Gas plants are increasingly built to support renewables and data centers, while coal additions continue mainly in India, China, and Indonesia.
Renewable is the fastest-growing generation type, expanding at a 9.2% CAGR through 2033. Utility-scale solar, onshore and offshore wind, and hybrid renewable projects are being built at record pace, and gigawatt-scale solar parks are common in the Middle East & Africa region and China. Nuclear, hydro, and transmission and distribution form other segments. For the market, renewable growth shifts EPC work toward faster, modular projects.
By Equipment: Steam Turbines Lead While Energy Storage Systems Grow Fastest
Steam Turbines held 27.7% share in 2026. Steam turbines are used in coal, nuclear, combined cycle, and biomass plants, and they are among the most expensive components in thermal and nuclear projects. Major suppliers include Siemens Energy, GE Vernova, Doosan Enerbility, and Chinese manufacturers.
Energy Storage Systems are the fastest-growing equipment, expanding at a 12.5% CAGR through 2033. Lithium-ion battery systems, and emerging long-duration storage, are being added to grids and solar plants to shift power to evening peaks and support grid stability. Gas turbines, boilers, generators, transformers, and switchgear form other equipment categories, with gas turbines and large transformers in short supply worldwide. For the market, storage growth reflects grid flexibility needs.
By Project Type: New Build Leads While Retrofit & Upgrade Grows Fastest
New Build held 72.0% share in 2026. Greenfield and expansion power plants, solar parks, wind farms, and transmission lines account for most EPC spending as countries add new capacity to meet fast demand growth and replace retiring units.
Retrofit & Upgrade is the fastest-growing project type, expanding at a 7.4% CAGR through 2033. Owners extend the operating life of existing plants, add emissions controls, convert coal plants to gas or biomass, upgrade turbines for higher output, and add storage to existing solar farms. Grid upgrades replace aging substations, cables, and protection systems, especially in North America and Europe. Digital control systems and monitoring upgrades improve plant efficiency. For the market, retrofit growth adds steady, lower-risk work for contractors.
Geography Analysis
Why Is North America Important to the Power EPC Market?
North America is important to the power EPC market because surging electricity demand from data centers, manufacturing, and electrification is driving one of the largest waves of new generation and grid investment in decades. The United States is adding gas plants, solar farms, battery storage, and transmission lines, and is planning new nuclear projects and small modular reactors. Bechtel, Kiewit, Black & Veatch, Fluor, and Burns & McDonnell are major contractors. Canada is investing in nuclear refurbishment and hydro. Key barriers include equipment shortages and permitting delays. One change shaping the region is the rapid growth of data center power projects.
Europe Advances the Power EPC Market Through Decarbonization
Europe is a major power EPC market. Germany, the United Kingdom, France, Spain, and Poland are investing in offshore wind, solar, grid interconnectors, battery storage, and new nuclear plants to meet climate goals and improve energy security. Bulgaria awarded Hyundai E&C an EPC deal for two reactors. Rising costs have led to some offshore wind cancellations, including Ørsted’s Hornsea 4 project in the United Kingdom. Siemens Energy and European contractors play leading roles in grid and wind projects. Key barriers include permitting delays and high financing costs. One opportunity is grid expansion and interconnection.
Which Region Is Leading the Power EPC Market?
Asia Pacific is leading the power EPC market with a 37.6% share in 2026. China builds more power capacity each year than any other country, including solar, wind, hydro, nuclear, coal, and ultra-high-voltage lines, and Chinese contractors such as PowerChina and China Energy Engineering also win many projects abroad. India is the fastest-growing country, expanding at a 8.4% CAGR through 2033, with large solar, thermal, nuclear, and transmission programs, and Larsen & Toubro and BHEL are major contractors. Vietnam, Indonesia, and the Philippines are adding LNG and renewable plants. Key barriers include financing in smaller markets. One change shaping the region is the rapid growth of renewables and storage.
Latin America Grows the Power EPC Market Through Renewables
Latin America is a growing power EPC market. Brazil, Chile, Mexico, Colombia, and Argentina are adding large solar and wind farms, transmission lines, and hydro upgrades, and Chile is building battery storage at scale. Brazil holds large transmission auctions that attract international contractors. Green hydrogen projects in Chile and Brazil may need dedicated renewable power, and mining companies are building their own solar and wind plants to cut costs and emissions. Chinese and European contractors compete strongly for projects. Key barriers include regulatory changes and currency risk. One opportunity is transmission expansion to connect remote renewables to cities.
Middle East & Africa Develops the Power EPC Market Through Giga-Projects
Middle East & Africa is a developing but fast-moving power EPC market. Saudi Arabia and the United Arab Emirates are building gigawatt-scale solar parks, battery storage, and gas plants, including the 2,600 MW Taweelah C plant awarded to China Energy Engineering in June 2026. Egypt, Morocco, South Africa, Namibia, and Kenya are adding renewable capacity, often with development finance from international banks. Interconnectors linking countries are also planned. Key barriers include financing in lower-income countries. One change shaping the region is the rise of solar-plus-storage giga-projects with record low tariffs.
Competitive Landscape
The power EPC market is fragmented. PowerChina, China Energy Engineering, Bechtel, Larsen & Toubro, and Doosan Enerbility are leading players, while Siemens Energy, GE Vernova, Hyundai E&C, Fluor, Black & Veatch, Kiewit, and BHEL compete strongly. Many regional and national contractors serve local markets, especially for solar and grid work, and specialist firms focus on storage, substations, or offshore wind.
Companies compete on technical expertise, track record, price, financing support, delivery speed, equipment access, and safety. Chinese contractors win many international projects through competitive pricing, strong supply chains, and links to state financing. Equipment makers such as Siemens Energy and GE Vernova offer turnkey power islands, and Korean contractors are strong in nuclear and gas. Risk management is critical because fixed-price contracts can cause large losses, so many firms now prefer shared-risk contract models.
Strategic moves show how competition is changing. In November 2024, Hyundai E&C signed a nuclear EPC deal in Bulgaria. In February 2026, PowerChina and Lilama signed an LNG power plant contract in Vietnam. In June 2026, China Energy Engineering won the Taweelah C contract in Abu Dhabi. These moves show competition shifting toward gas, nuclear, and large international projects, where Chinese and Korean contractors are especially active.
Three themes shape vendor strategy. First, companies are expanding renewable, storage, and grid capabilities. Second, they are pursuing nuclear and data center power projects. Third, they are securing equipment supply and managing contract risk.
Power EPC Market Industry Leaders
- PowerChina
- China Energy Engineering
- Bechtel
- Larsen & Toubro
- Doosan Enerbility
Recent Industry Developments
- June 2026: China Energy Engineering won a US$ 1.687 billion EPC contract for the 2,600 MW dual-fuel combined cycle Taweelah C power station in Abu Dhabi - expands gas-fired power plant construction in Middle East & Africa.
- February 2026: EVN signed a US$ 962 million EPC contract with a PowerChina and Lilama consortium for the 1,612 MW Quang Trach II LNG power plant in Vietnam - adds power EPC work in Asia Pacific.
- November 2024: Hyundai E&C signed an EPC agreement to build two 2,200 MW reactors at Kozloduy in Bulgaria, valued at about US$ 14.5 billion - strengthens nuclear energy infrastructure EPC demand in Europe.
Companies Covered in the Report
- PowerChina
- China Energy Engineering
- Bechtel
- Larsen & Toubro
- Doosan Enerbility
- Siemens Energy
- GE Vernova
- Hyundai E&C
- Fluor
- Black & Veatch
- Kiewit
- BHEL
Power EPC Market Report Scope
This report covers power engineering, procurement, and construction services for thermal, nuclear, hydro, renewable, and other power generation projects, along with transmission and distribution infrastructure, covering steam turbines, gas turbines, boilers, generators, transformers, energy storage systems, and other equipment, for new build and retrofit and upgrade projects. The base year is 2025, and the forecast period runs from 2026 to 2033. All values are expressed in US$ Billion.
Generation Type
- Thermal
- Nuclear
- Hydro
- Renewable
- Transmission & Distribution
Equipment
- Steam Turbines
- Gas Turbines
- Boilers & Generators
- Transformers & Switchgear
- Energy Storage Systems
Project Type
- New Build
- Retrofit & Upgrade
Regions
- North America
- Europe
- Asia Pacific
- Latin America
- Middle East & Africa
- 1. Executive Summary
- 1.1. Global Power EPC Market Snapshot
- 1.2. Future Projections, 2026-2033
- 1.3. Key Market Trends
- 1.4. Regional Snapshot
- 2. Market Overview
- 2.1. Market Definition and Report Scope
- 2.2. Historical Market Trends, 2020-2025
- 2.3. Market Dynamics
- 2.3.1. Drivers Impact Analysis
- 2.3.1.1. Rising Electricity Demand Is Driving the Power EPC Market
- 2.3.1.2. Energy Transition Is Expanding the Power EPC Market
- 2.3.2. Restraints Impact Analysis
- 2.3.2.1. Equipment Shortages Slow the Power EPC Market
- 2.3.2.2. Financing and Permitting Restrict the Power EPC Market
- 2.3.3. Market Opportunities
- 2.3.3.1. Grid Expansion and Energy Storage Open a Fast-Growth Revenue Pool
- 2.3.3.2. Nuclear and Data Center Power Create a Premium Revenue Pool
- 2.3.1. Drivers Impact Analysis
- 3. Global Power EPC Market Outlook, 2020-2033
- 3.1. Global Power EPC Market Outlook, by Generation Type, Value (US$ Billion), 2020-2033
- 3.1.1. Thermal
- 3.1.2. Nuclear
- 3.1.3. Hydro
- 3.1.4. Renewable
- 3.1.5. Transmission & Distribution
- 3.2. Global Power EPC Market Outlook, by Equipment, Value (US$ Billion), 2020-2033
- 3.2.1. Steam Turbines
- 3.2.2. Gas Turbines
- 3.2.3. Boilers & Generators
- 3.2.4. Transformers & Switchgear
- 3.2.5. Energy Storage Systems
- 3.3. Global Power EPC Market Outlook, by Project Type, Value (US$ Billion), 2020-2033
- 3.3.1. New Build
- 3.3.2. Retrofit & Upgrade
- 3.4. Global Power EPC Market Outlook, by Region, Value (US$ Billion), 2020-2033
- 3.4.1. North America
- 3.4.2. Europe
- 3.4.3. Asia Pacific
- 3.4.4. Latin America
- 3.4.5. Middle East & Africa
- 3.1. Global Power EPC Market Outlook, by Generation Type, Value (US$ Billion), 2020-2033
- 4. North America Power EPC Market Outlook, 2020-2033
- 4.1. North America Power EPC Market Outlook, by Generation Type, Value (US$ Billion), 2020-2033
- 4.1.1. Thermal
- 4.1.2. Nuclear
- 4.1.3. Hydro
- 4.1.4. Renewable
- 4.1.5. Transmission & Distribution
- 4.2. North America Power EPC Market Outlook, by Equipment, Value (US$ Billion), 2020-2033
- 4.2.1. Steam Turbines
- 4.2.2. Gas Turbines
- 4.2.3. Boilers & Generators
- 4.2.4. Transformers & Switchgear
- 4.2.5. Energy Storage Systems
- 4.3. North America Power EPC Market Outlook, by Project Type, Value (US$ Billion), 2020-2033
- 4.3.1. New Build
- 4.3.2. Retrofit & Upgrade
- 4.4. North America Power EPC Market Outlook, by Country, Value (US$ Billion), 2020-2033
- 4.4.1. United States Power EPC Market Outlook, by Generation Type, 2020-2033
- 4.4.2. United States Power EPC Market Outlook, by Equipment, 2020-2033
- 4.4.3. United States Power EPC Market Outlook, by Project Type, 2020-2033
- 4.4.4. Canada Power EPC Market Outlook, by Generation Type, 2020-2033
- 4.4.5. Canada Power EPC Market Outlook, by Equipment, 2020-2033
- 4.4.6. Canada Power EPC Market Outlook, by Project Type, 2020-2033
- 4.1. North America Power EPC Market Outlook, by Generation Type, Value (US$ Billion), 2020-2033
- 5. Europe Power EPC Market Outlook, 2020-2033
- 5.1. Europe Power EPC Market Outlook, by Generation Type, Value (US$ Billion), 2020-2033
- 5.1.1. Thermal
- 5.1.2. Nuclear
- 5.1.3. Hydro
- 5.1.4. Renewable
- 5.1.5. Transmission & Distribution
- 5.2. Europe Power EPC Market Outlook, by Equipment, Value (US$ Billion), 2020-2033
- 5.2.1. Steam Turbines
- 5.2.2. Gas Turbines
- 5.2.3. Boilers & Generators
- 5.2.4. Transformers & Switchgear
- 5.2.5. Energy Storage Systems
- 5.3. Europe Power EPC Market Outlook, by Project Type, Value (US$ Billion), 2020-2033
- 5.3.1. New Build
- 5.3.2. Retrofit & Upgrade
- 5.4. Europe Power EPC Market Outlook, by Country, Value (US$ Billion), 2020-2033
- 5.4.1. Germany Power EPC Market Outlook, by Generation Type, 2020-2033
- 5.4.2. Germany Power EPC Market Outlook, by Equipment, 2020-2033
- 5.4.3. Germany Power EPC Market Outlook, by Project Type, 2020-2033
- 5.4.4. United Kingdom Power EPC Market Outlook, by Generation Type, 2020-2033
- 5.4.5. United Kingdom Power EPC Market Outlook, by Equipment, 2020-2033
- 5.4.6. United Kingdom Power EPC Market Outlook, by Project Type, 2020-2033
- 5.4.7. France Power EPC Market Outlook, by Generation Type, 2020-2033
- 5.4.8. France Power EPC Market Outlook, by Equipment, 2020-2033
- 5.4.9. France Power EPC Market Outlook, by Project Type, 2020-2033
- 5.4.10. Spain Power EPC Market Outlook, by Generation Type, 2020-2033
- 5.4.11. Spain Power EPC Market Outlook, by Equipment, 2020-2033
- 5.4.12. Spain Power EPC Market Outlook, by Project Type, 2020-2033
- 5.4.13. Poland Power EPC Market Outlook, by Generation Type, 2020-2033
- 5.4.14. Poland Power EPC Market Outlook, by Equipment, 2020-2033
- 5.4.15. Poland Power EPC Market Outlook, by Project Type, 2020-2033
- 5.4.16. Bulgaria Power EPC Market Outlook, by Generation Type, 2020-2033
- 5.4.17. Bulgaria Power EPC Market Outlook, by Equipment, 2020-2033
- 5.4.18. Bulgaria Power EPC Market Outlook, by Project Type, 2020-2033
- 5.1. Europe Power EPC Market Outlook, by Generation Type, Value (US$ Billion), 2020-2033
- 6. Asia Pacific Power EPC Market Outlook, 2020-2033
- 6.1. Asia Pacific Power EPC Market Outlook, by Generation Type, Value (US$ Billion), 2020-2033
- 6.1.1. Thermal
- 6.1.2. Nuclear
- 6.1.3. Hydro
- 6.1.4. Renewable
- 6.1.5. Transmission & Distribution
- 6.2. Asia Pacific Power EPC Market Outlook, by Equipment, Value (US$ Billion), 2020-2033
- 6.2.1. Steam Turbines
- 6.2.2. Gas Turbines
- 6.2.3. Boilers & Generators
- 6.2.4. Transformers & Switchgear
- 6.2.5. Energy Storage Systems
- 6.3. Asia Pacific Power EPC Market Outlook, by Project Type, Value (US$ Billion), 2020-2033
- 6.3.1. New Build
- 6.3.2. Retrofit & Upgrade
- 6.4. Asia Pacific Power EPC Market Outlook, by Country, Value (US$ Billion), 2020-2033
- 6.4.1. China Power EPC Market Outlook, by Generation Type, 2020-2033
- 6.4.2. China Power EPC Market Outlook, by Equipment, 2020-2033
- 6.4.3. China Power EPC Market Outlook, by Project Type, 2020-2033
- 6.4.4. India Power EPC Market Outlook, by Generation Type, 2020-2033
- 6.4.5. India Power EPC Market Outlook, by Equipment, 2020-2033
- 6.4.6. India Power EPC Market Outlook, by Project Type, 2020-2033
- 6.4.7. Vietnam Power EPC Market Outlook, by Generation Type, 2020-2033
- 6.4.8. Vietnam Power EPC Market Outlook, by Equipment, 2020-2033
- 6.4.9. Vietnam Power EPC Market Outlook, by Project Type, 2020-2033
- 6.4.10. Indonesia Power EPC Market Outlook, by Generation Type, 2020-2033
- 6.4.11. Indonesia Power EPC Market Outlook, by Equipment, 2020-2033
- 6.4.12. Indonesia Power EPC Market Outlook, by Project Type, 2020-2033
- 6.4.13. Philippines Power EPC Market Outlook, by Generation Type, 2020-2033
- 6.4.14. Philippines Power EPC Market Outlook, by Equipment, 2020-2033
- 6.4.15. Philippines Power EPC Market Outlook, by Project Type, 2020-2033
- 6.1. Asia Pacific Power EPC Market Outlook, by Generation Type, Value (US$ Billion), 2020-2033
- 7. Latin America Power EPC Market Outlook, 2020-2033
- 7.1. Latin America Power EPC Market Outlook, by Generation Type, Value (US$ Billion), 2020-2033
- 7.1.1. Thermal
- 7.1.2. Nuclear
- 7.1.3. Hydro
- 7.1.4. Renewable
- 7.1.5. Transmission & Distribution
- 7.2. Latin America Power EPC Market Outlook, by Equipment, Value (US$ Billion), 2020-2033
- 7.2.1. Steam Turbines
- 7.2.2. Gas Turbines
- 7.2.3. Boilers & Generators
- 7.2.4. Transformers & Switchgear
- 7.2.5. Energy Storage Systems
- 7.3. Latin America Power EPC Market Outlook, by Project Type, Value (US$ Billion), 2020-2033
- 7.3.1. New Build
- 7.3.2. Retrofit & Upgrade
- 7.4. Latin America Power EPC Market Outlook, by Country, Value (US$ Billion), 2020-2033
- 7.4.1. Brazil Power EPC Market Outlook, by Generation Type, 2020-2033
- 7.4.2. Brazil Power EPC Market Outlook, by Equipment, 2020-2033
- 7.4.3. Brazil Power EPC Market Outlook, by Project Type, 2020-2033
- 7.4.4. Chile Power EPC Market Outlook, by Generation Type, 2020-2033
- 7.4.5. Chile Power EPC Market Outlook, by Equipment, 2020-2033
- 7.4.6. Chile Power EPC Market Outlook, by Project Type, 2020-2033
- 7.4.7. Mexico Power EPC Market Outlook, by Generation Type, 2020-2033
- 7.4.8. Mexico Power EPC Market Outlook, by Equipment, 2020-2033
- 7.4.9. Mexico Power EPC Market Outlook, by Project Type, 2020-2033
- 7.4.10. Colombia Power EPC Market Outlook, by Generation Type, 2020-2033
- 7.4.11. Colombia Power EPC Market Outlook, by Equipment, 2020-2033
- 7.4.12. Colombia Power EPC Market Outlook, by Project Type, 2020-2033
- 7.4.13. Argentina Power EPC Market Outlook, by Generation Type, 2020-2033
- 7.4.14. Argentina Power EPC Market Outlook, by Equipment, 2020-2033
- 7.4.15. Argentina Power EPC Market Outlook, by Project Type, 2020-2033
- 7.1. Latin America Power EPC Market Outlook, by Generation Type, Value (US$ Billion), 2020-2033
- 8. Middle East & Africa Power EPC Market Outlook, 2020-2033
- 8.1. Middle East & Africa Power EPC Market Outlook, by Generation Type, Value (US$ Billion), 2020-2033
- 8.1.1. Thermal
- 8.1.2. Nuclear
- 8.1.3. Hydro
- 8.1.4. Renewable
- 8.1.5. Transmission & Distribution
- 8.2. Middle East & Africa Power EPC Market Outlook, by Equipment, Value (US$ Billion), 2020-2033
- 8.2.1. Steam Turbines
- 8.2.2. Gas Turbines
- 8.2.3. Boilers & Generators
- 8.2.4. Transformers & Switchgear
- 8.2.5. Energy Storage Systems
- 8.3. Middle East & Africa Power EPC Market Outlook, by Project Type, Value (US$ Billion), 2020-2033
- 8.3.1. New Build
- 8.3.2. Retrofit & Upgrade
- 8.4. Middle East & Africa Power EPC Market Outlook, by Country, Value (US$ Billion), 2020-2033
- 8.4.1. Saudi Arabia Power EPC Market Outlook, by Generation Type, 2020-2033
- 8.4.2. Saudi Arabia Power EPC Market Outlook, by Equipment, 2020-2033
- 8.4.3. Saudi Arabia Power EPC Market Outlook, by Project Type, 2020-2033
- 8.4.4. United Arab Emirates Power EPC Market Outlook, by Generation Type, 2020-2033
- 8.4.5. United Arab Emirates Power EPC Market Outlook, by Equipment, 2020-2033
- 8.4.6. United Arab Emirates Power EPC Market Outlook, by Project Type, 2020-2033
- 8.4.7. Egypt Power EPC Market Outlook, by Generation Type, 2020-2033
- 8.4.8. Egypt Power EPC Market Outlook, by Equipment, 2020-2033
- 8.4.9. Egypt Power EPC Market Outlook, by Project Type, 2020-2033
- 8.4.10. Morocco Power EPC Market Outlook, by Generation Type, 2020-2033
- 8.4.11. Morocco Power EPC Market Outlook, by Equipment, 2020-2033
- 8.4.12. Morocco Power EPC Market Outlook, by Project Type, 2020-2033
- 8.4.13. South Africa Power EPC Market Outlook, by Generation Type, 2020-2033
- 8.4.14. South Africa Power EPC Market Outlook, by Equipment, 2020-2033
- 8.4.15. South Africa Power EPC Market Outlook, by Project Type, 2020-2033
- 8.4.16. Namibia Power EPC Market Outlook, by Generation Type, 2020-2033
- 8.4.17. Namibia Power EPC Market Outlook, by Equipment, 2020-2033
- 8.4.18. Namibia Power EPC Market Outlook, by Project Type, 2020-2033
- 8.4.19. Kenya Power EPC Market Outlook, by Generation Type, 2020-2033
- 8.4.20. Kenya Power EPC Market Outlook, by Equipment, 2020-2033
- 8.4.21. Kenya Power EPC Market Outlook, by Project Type, 2020-2033
- 8.1. Middle East & Africa Power EPC Market Outlook, by Generation Type, Value (US$ Billion), 2020-2033
- 9. Competitive Landscape
- 9.1. Market Concentration and Industry Leaders
- 9.2. Competitive Differentiation
- 9.3. Strategic Initiatives
- 9.4. Recent Industry Developments
- 9.5. Company Profiles
- 9.5.1. PowerChina
- 9.5.2. China Energy Engineering
- 9.5.3. Bechtel
- 9.5.4. Larsen & Toubro
- 9.5.5. Doosan Enerbility
- 9.5.6. Siemens Energy
- 9.5.7. GE Vernova
- 9.5.8. Hyundai E&C
- 9.5.9. Fluor
- 9.5.10. Black & Veatch
- 9.5.11. Kiewit
- 9.5.12. BHEL
- 10. Appendix
- 10.1. Research Methodology
- 10.2. Report Assumptions
- 10.3. Acronyms and Abbreviations
| Generation Type | Thermal, Nuclear, Hydro, Renewable, Transmission & Distribution |
| Equipment | Steam Turbines, Gas Turbines, Boilers & Generators, Transformers & Switchgear, Energy Storage Systems |
| Project Type | New Build, Retrofit & Upgrade |
| Regions | North America, Europe, Asia Pacific, Latin America, Middle East & Africa |
Our Research Methodology
Considering the volatility of business today, traditional approaches to strategizing a game plan can be unfruitful if not detrimental. True ambiguity is no way to determine a forecast. A myriad of predetermined factors must be accounted for such as the degree of risk involved, the magnitude of circumstances, as well as conditions or consequences that are not known or unpredictable. To circumvent binary views that cast uncertainty, the application of market research intelligence to strategically posture, move, and enable actionable outcomes is necessary.
View Methodology
Quality Assured
Rigorous Validation Process

Confidentiality Assured
End-to-end Data Security

Custom Research Services
Tailored To Your Objectives
FAQs
The power EPC market is valued at US$ 780.56 billion in 2026, led by thermal power projects and Asia Pacific.
The market is projected to reach US$ 1,220.97 billion by 2033, growing at a 6.6% CAGR and adding US$ 440.41 billion.
Renewable power is growing fastest at a 9.2% CAGR through 2033, driven by large solar, wind, and hybrid projects worldwide.
India is growing fastest at an 8.4% CAGR through 2033, driven by rising power demand, solar additions, and transmission investment.
Asia Pacific holds the largest share at 37.6% in 2026, supported by large power programs in China, India, and Vietnam.
Related Reports
Port Electrification Market Size, Share, Insights, Competitive Landscape, and Forecast 2026 to 2033
Explore the port electrification market, valued at US$ 6.8 billion in 2026 and forecast to reach US$ 16.4 billion by 2033, growing at a 13.4% CAGR.
Polycrystalline Solar Cell Market Size, Share, Insights, Competitive Landscape, and Forecast 2026 to 2033
Explore the polycrystalline solar cell market, valued at US$ 5.4 billion in 2026 and projected to reach US$ 6.6 billion by 2033, growing at 2.9% CAGR.
Synchronous Condenser Market Size, Share, Insights, Competitive Landscape, and Forecast 2026 to 2033
The global synchronous condenser market is valued at US$1.20 billion in 2026, reaching US$1.50 billion by 2033, growing at a 3.2% CAGR
Water and Wastewater Treatment Market Size, Share, Insights, Competitive Landscape, and Forecast 2026 to 2033
Water and wastewater treatment market to reach US$ 508.0 billion by 2033 from US$ 345.0 billion in 2026 at a 5.7% CAGR. Explore trends, segments and regions.
Vehicle-to-Grid Technology Market Size, Share, Insights, Competitive Landscape, and Forecast 2026 to 2033
Explore the vehicle-to-grid technology market, forecast to reach US$6.9 billion by 2033 at 28.4% CAGR, with component, application and regional insights.
Offshore Oil and Gas Equipment Market Size, Share, Insights, Competitive Landscape, and Forecast 2026 to 2033
The offshore oil and gas equipment market is projected to grow from US$94.0 billion in 2026 to US$138.0 billion by 2033, at a 5.6% CAGR. Explore trends.