



Offshore Oil and Gas Equipment Market
Offshore Oil and Gas Equipment Market Size, Share, Insights, Competitive Landscape, and Forecast 2026 to 2033
Offshore Oil and Gas Equipment Market Size and Trend Analysis
How Big Is the Offshore Oil and Gas Equipment Market?
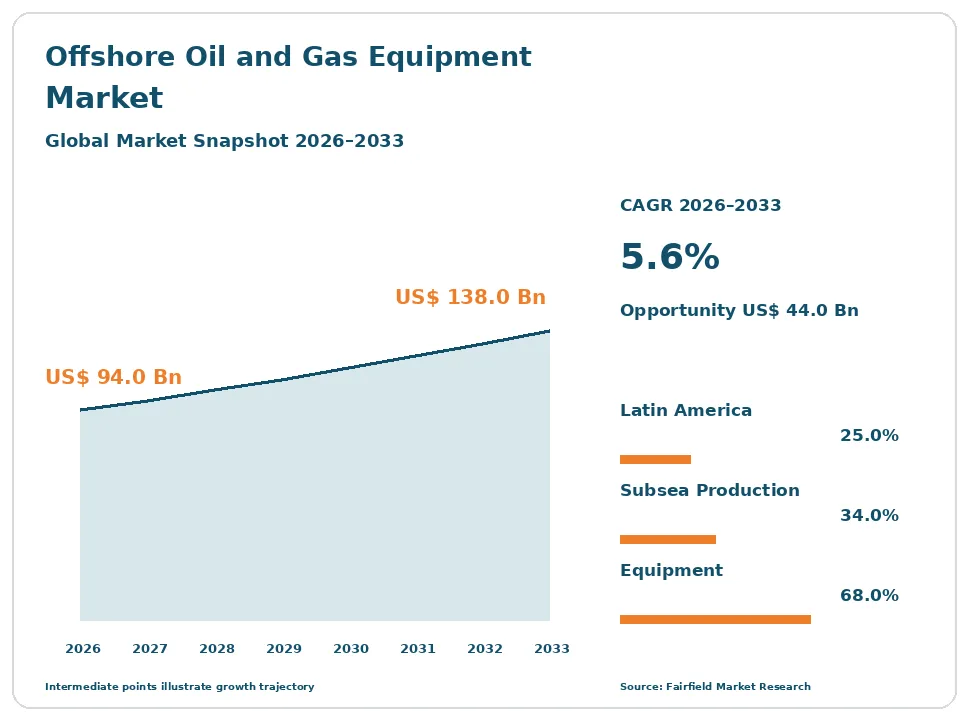
The global offshore oil and gas equipment market size is expected to be valued at US$ 94.0 billion in 2026 and projected to reach US$ 138.0 billion by 2033, growing at a CAGR of 5.6% between 2026 and 2033.
Spending recovered at a 3.8% CAGR between 2020 and 2025, reaching about US$ 89.3 billion by the end of 2025 after a deep contraction. The capital cycle, not a secular trend, sets this rate. Operators sanctioned a long queue of deepwater projects once standardised subsea hardware pushed breakevens down. The supply side never rebuilt what it cut: yard slots, specialist installation vessels, long-lead forgings and experienced engineering hours are all scarce. Prices and lead times have therefore moved further than delivered volumes. The direction of travel is a disciplined, supply-constrained upcycle in which order books lengthen, aftermarket work on an aging installed base grows steadily, and operators favour tiebacks to existing hubs over new standalone developments.
Key Report Takeaways
- By Equipment Type: Subsea production systems held 34% share in 2026, while floating production systems equipment is projected to expand at a 7.1% CAGR through 2033, driven by turret, mooring and topsides module orders for deepwater production units.
- By Water Depth: Shallow water held 42% share in 2026, while ultra-deepwater is projected to expand at a 7.8% CAGR through 2033, driven by presalt and frontier basin developments that need high-specification pressure equipment.
- By Field Life Stage: Greenfield development held 46% share in 2026, while brownfield expansion and tiebacks is projected to expand at a 7.6% CAGR through 2033, driven by step-out wells routed through installed host facilities.
- By Offering: Equipment held 68% share in 2026, while maintenance, repair and aftermarket services is projected to expand at a 6.9% CAGR through 2033, driven by the rising average age of installed offshore hardware.
- By Geography: Latin America held 25% share in 2026, while Middle East & Africa is projected to expand at a 7.3% CAGR through 2033, driven by Gulf shallow-water programmes and the return of West Africa deepwater sanctions.
Global Offshore Oil and Gas Equipment Market Trends and Insights
Drivers Impact Analysis
| Driver | Impact on CAGR Forecast | Geographic Relevance | Impact Timeline |
| Supply-side capacity shortage in yards, vessels, forgings and engineering hours | High | Global | Medium term 2–4 years |
| Standardisation and modularisation of subsea production systems | High | Latin America, Middle East & Africa, Europe | Long term ≥4 years |
Two forces explain most of the revenue added to offshore equipment order books through the forecast period.
Scarce Yard Slots, Vessels and Forgings Set the Price of Offshore Oil and Gas Equipment
Supply, not demand, sets prices across offshore equipment today. Operators hold a long list of sanctioned deepwater and shelf projects, but the yards, vessels and forges that serve them shed capacity through the last downturn and rebuilt very little of it. Delivery slots for subsea trees, large pressure forgings and heavy construction vessels are booked years ahead. Suppliers are therefore winning price and contract terms that were unavailable for most of the previous decade.
The cause is structural rather than cyclical noise. Years of weak ordering pushed fabrication yards to close lines, idled vessels to leave the fleet and experienced subsea engineers to move into other industries. Forging capacity for pressure-containing parts qualified to API 6A and API 17D sits with a small number of mills, each with long qualification cycles. Rebuilding any of this takes years, so lead times rather than volumes absorb the extra demand.
Standardised Subsea Modules Cut Engineering Hours and Unlock Deepwater Field Sanctions
Standardisation has added more revenue to offshore equipment suppliers than any single price move. Operators once specified bespoke subsea hardware for every field, which pushed engineering hours and schedule risk to levels only very large discoveries could carry. Catalogue trees, standard manifold frames and pre-qualified control modules cut that work sharply. Lower engineering content reduced deepwater breakevens enough for projects to clear investment committees under cautious long-term price assumptions.
The mechanism is repeat engineering avoided. Standard interfaces defined through the API 17 series and ISO 13628 let suppliers build to inventory, test once and reuse qualification evidence across fields. Modular subsea processing and boosting packages follow the same logic. Operators gain shorter schedules from award to first oil, while suppliers gain factory throughput in place of one-off projects. The result is more frequent, smaller sanctions, which lifts unit volumes across subsea production systems.
Restraints Impact Analysis
| Restraint | Impact on CAGR Forecast | Geographic Relevance | Impact Timeline |
| Long-term hydrocarbon demand uncertainty under energy transition policy | Medium | Europe, North America | Long term ≥4 years |
| Safety, permitting and qualification burden plus steel and forging cost inflation | Medium | Global | Short term ≤2 years |
Two constraints hold back how quickly sanctioned offshore work converts into delivered equipment revenue.
Uncertain Long-Term Demand Keeps Offshore Oil and Gas Capital Discipline Unusually Tight
Uncertainty about long-term hydrocarbon demand keeps a lid on the largest offshore orders. Energy transition policy makes revenue beyond the early 2040s hard to underwrite, yet a new deepwater hub needs that horizon to pay back. Boards respond by shortening payback tests and raising hurdle rates. The practical effect is fewer greenfield hub sanctions than the known resource base would otherwise support, and a visible tilt toward smaller, faster scopes.
This is a planning condition, not a forecast of decline. Operators cannot know which policy path will hold, so they buy optionality: tiebacks to installed infrastructure, phased topsides and equipment that can be redeployed to another field. That choice moves spend away from large fixed platforms and integrated newbuild floaters toward subsea hardware, flowlines and brownfield modifications. Suppliers of heavy structural scopes feel the constraint most, while subsea and aftermarket suppliers feel it least.
Qualification, Permitting and Forging Cost Inflation Slow Offshore Equipment Deliveries
Safety and permitting obligations add time and cost between an order and an installed, producing system. Offshore well control and production safety requirements are heavy, and the industry’s own accident history explains why. Verification bodies, witnessed factory acceptance testing and independent well examination all sit on the critical path. Suppliers absorb months of qualification before equipment can be installed, which delays revenue and limits how fast capacity converts into deliveries.
The cost sources are specific. Equipment must be designed and documented to API 6A, API 16A, API 16D, API 17D and API RP 53, then accepted under the Bureau of Safety and Environmental Enforcement well control and production safety systems rules, the United Kingdom offshore safety case regime, the European Union Offshore Safety Directive or NORSOK requirements. Classification society rules apply to mobile offshore drilling units and floating production units. Steel plate, large forgings and offshore-certified labour have all repriced upward.
Market Opportunities
Subsea Tiebacks and Brownfield Life Extension Open a Recurring Offshore Equipment Revenue Pool
Subsea tiebacks and brownfield life extension are now the most dependable recurring revenue pool in offshore equipment. Thousands of installed wells and hundreds of platforms sit close to resource pockets too small for a standalone facility but economic through an existing host. Each tieback needs trees, jumpers, flowlines, umbilicals and topside modifications. Deepwater acreage in Brazil, Guyana and off West Africa generates a steady stream of exactly this work.
Operators holding installed hubs capture the economics, and equipment suppliers capture the scope. Buyers are production organisations rather than exploration teams, so purchasing is routine and repeatable. Longer step-outs made the difference: multiphase boosting, electrically heated flowlines and improved flow assurance chemistry extended viable tieback distance far beyond earlier limits. Life extension on aging platforms adds structural strengthening, riser replacement and control system upgrades, turning the installed base into a maintained annuity.
Offshore Electrification, Carbon Storage and Decommissioning Extend the Addressable Equipment Base
Electrification, carbon dioxide storage and the end-of-life wave open an addressable base beyond conventional production. Replacing gas turbines on platforms with power from shore or from nearby generation requires cables, substations, switchgear and topside reconfiguration. Storage projects need injection wells, trees, metering skids and flow assurance packages that closely resemble oil and gas scopes. Decommissioning of early installations creates cutting, lifting, plugging and disposal work that will recur for decades.
Suppliers already holding subsea, mooring and heavy-lift capability are best placed, because the vessels and interfaces transfer directly. Demand comes from operators facing emissions rules and from storage developers backed by public funding. Fixed offshore wind competes for the same yards and vessels, which tightens supply but also supports utilisation across the cycle. Methane and flaring rules now reaching offshore facilities give operators a direct financial reason to electrify rather than defer.
Segment Analysis
By Equipment Type: Subsea Production Systems Lead While Floating Production Equipment Accelerates
Subsea production systems held 34% share in 2026, the largest of any equipment type. Trees, manifolds, wellheads, umbilicals, risers and flowlines are required on almost every modern offshore development, and standardisation has made them the default architecture for both new fields and step-outs. Subsea processing, boosting and control systems add content per well that did not exist a decade ago.
Floating production systems equipment is the fastest-growing type at a 7.1% CAGR through 2033. Turrets, mooring systems and topsides process modules for production units, floating liquefied natural gas vessels, semi-submersibles, tension leg platforms and spars are being ordered for fields where fixed structures are impossible. Hull availability is the binding constraint, so suppliers of turret and topsides packages hold pricing power.
The implication is that content is migrating from the platform to the seabed and to the floater, which favours suppliers with integrated subsea and surface portfolios over single-product vendors.
By Water Depth: Shallow Water Still Dominates While Ultra-Deepwater Grows Quickest
Shallow water held 42% share in 2026 because the installed base is enormous and the work is continuous. Shelf fields in the Gulf states, the southern North Sea, offshore India and offshore Malaysia keep generating wellhead platform, jacket and pipeline equipment orders at moderate unit value but very high frequency. Shorter cycle times also suit operators managing capital carefully.
Ultra-deepwater is the fastest-growing depth class at a 7.8% CAGR through 2033. Presalt reservoirs and frontier basins require 15,000 psi rated trees, heavier risers, higher-specification blowout preventers and more capable installation vessels, which raises equipment value per well several times over the shelf equivalent. Qualification under the API 17 series is more demanding at these depths.
Deepwater field development therefore carries the value growth while shallow water carries the volume, and suppliers need both cost-efficient standard lines and high-pressure premium product ranges.
By Field Life Stage: Greenfield Spending Leads as Brownfield Tiebacks Gain Share Fastest
Greenfield development held 46% share in 2026, still the largest slice of offshore equipment spending. New hubs in Latin America and Middle East & Africa carry complete scopes of drilling equipment, subsea hardware, floating production equipment and export pipelines, so a single sanction can book several years of supplier capacity.
Brownfield expansion and tiebacks is the fastest-growing stage at a 7.6% CAGR through 2033. Routing new wells through installed hosts avoids the cost of another facility and shortens schedules from sanction to first production, which suits boards applying tight hurdle rates. Life extension work and decommissioning preparation both expand alongside it as the installed fleet ages.
Suppliers gain from this shift because tieback scopes are repeatable, standardised and awarded more frequently, which smooths factory loading between the large, lumpy greenfield awards that still set peak revenue.
By Offering: Equipment Sales Dominate While Aftermarket Services Compound Fastest
Equipment held 68% share in 2026, reflecting the capital-goods nature of offshore supply. Drilling packages, subsea trees, control systems, risers, turrets and process modules carry high unit values, and operators still buy most hardware outright rather than through availability contracts.
Maintenance, repair and aftermarket services is the fastest-growing offering at a 6.9% CAGR through 2033. The installed base is aging, regulators demand documented inspection and recertification, and spare parts for blowout preventers, control pods and riser joints must be replaced on fixed intervals. Condition monitoring and remote diagnostics have made service contracts easier to price and extend.
Installation and commissioning services sit between the two, tied directly to vessel availability. The business implication is a gradual shift in supplier earnings quality, as recurring service revenue cushions the volatility that pure equipment ordering has always produced.
Geography Analysis
North America Offshore Equipment Demand Is Anchored in Deepwater Gulf of Mexico Infrastructure
North America held 21% share in 2026 and is forecast to grow at a 4.8% CAGR through 2033. The deepwater Gulf of Mexico is the core, with the United States supplying most of the demand and Mexico adding shelf and shallow-water work. Activity is dominated by subsea tiebacks to established hosts rather than new floating hubs, because the host infrastructure is already dense and has spare processing capacity.
Regulation is a defining feature. The Bureau of Safety and Environmental Enforcement well control and production safety systems rules set equipment, testing and documentation requirements that suppliers must design against, and financial assurance obligations have raised the profile of eventual decommissioning. The main change ahead is electrification and emissions control on existing facilities, which converts methane and flaring rules into topsides equipment orders.
Europe Combines North Sea Life Extension With the Strictest Offshore Safety Regime
Europe held 18% share in 2026 and is forecast to grow at a 4.2% CAGR, the slowest of the five regions. The North Sea carries the activity, split between Norway, where NORSOK standards and a stable fiscal regime keep subsea and tieback ordering steady, and the United Kingdom, where mature fields, the offshore safety case regime and fiscal uncertainty have slowed new sanctions.
Most spending is maintenance, modification and life extension on platforms built decades ago, with riser replacement, structural strengthening and control system upgrades recurring annually. The European Union Offshore Safety Directive sets the verification framework across member state waters. Two changes matter: platform electrification from shore, which is furthest advanced here, and carbon dioxide storage projects reusing offshore wells, pipelines and installation vessels.
Asia Pacific Builds Shelf Platforms and Gas Infrastructure at High Volume
Asia Pacific held 17% share in 2026 and is forecast to grow at a 5.1% CAGR through 2033. China, India, Malaysia, Indonesia, Australia and Vietnam drive the demand, and the mix leans toward shallow-water wellhead platforms, jackets and gas gathering infrastructure rather than ultra-deepwater hardware.
National oil companies are the dominant buyers, and local content rules push fabrication toward domestic yards, which has built substantial regional capacity in jackets, topsides modules and line pipe. Gas developments supplying domestic power and liquefaction plants account for a growing share of orders. The region also holds much of the world’s offshore fabrication and heavy-lift capability, so it supplies equipment to projects far beyond its own waters. Deepwater work off Australia and India is the main upside.
Which Region Is Leading the Offshore Oil and Gas Equipment Market?
Latin America leads the offshore oil and gas equipment market with 25% share in 2026, growing at a 6.8% CAGR through 2033. Brazil supplies most of it. The presalt basins require floating production units with large turret and mooring scopes, high-pressure subsea trees and long export flowlines, and the sanction pipeline has stayed full through the cycle. Guyana adds the fastest ramp of any new deepwater province, with successive developments ordering near-identical equipment sets that suppliers can repeat.
Argentina is building offshore activity in its Atlantic basins, and Trinidad and Tobago continues gas work. Local content requirements in Brazil shape where modules are fabricated, which has drawn international suppliers into domestic partnerships. The main barrier is yard and vessel congestion, which now limits how quickly sanctioned projects reach first oil.
Which Region Is Growing Fastest in the Offshore Oil and Gas Equipment Market?
Middle East & Africa is growing fastest in the offshore oil and gas equipment market, at a 7.3% CAGR through 2033 from 19% share in 2026. Gulf national oil companies are running large shallow-water expansion programmes, with Saudi Arabia, the United Arab Emirates and Qatar ordering wellhead platforms, jackets, pipelines and gas processing modules at scale. Low lifting costs and state balance sheets insulate these programmes from price swings.
Deepwater West Africa is the second engine. Nigeria, Angola, Namibia, Côte d’Ivoire and the Republic of the Congo are sanctioning projects again after a long pause, largely as tiebacks and redeployed floating units. Barriers remain real: fiscal terms, permitting delays, security exposure and thin local supply chains. Mozambique gas and Egypt offshore development provide the clearest further upside.
Competitive Landscape
The offshore oil and gas equipment market is moderately concentrated. A small group of integrated suppliers controls subsea production systems, where qualification barriers, installed-base familiarity and the ability to deliver trees, controls, umbilicals and risers as one package keep newcomers out. Drilling equipment is similarly concentrated around a few manufacturers of derricks, top drives, mud systems and blowout preventer stacks. Fabrication of jackets, topsides modules and floating production hulls is far more fragmented, spread across yards in Asia Pacific, Europe, Latin America and Middle East & Africa. Consolidation over the past decade combined subsea hardware with installation capability, which is now the dominant structure at the top of the market.
Vendors compete on delivery slot availability first, because lead time is the scarcest commodity in the current cycle. Beyond that, they compete on qualification depth against API and ISO 13628 requirements, on standardised catalogue ranges that cut engineering hours, on integrated engineering, procurement, construction and installation delivery, and on documented reliability in the installed base. Pricing matters less than it did when capacity was abundant. New entrants are rare in pressure-containing hardware but more common in subsea electrification, digital condition monitoring and all-electric control systems, where incumbents partner rather than build.
Strategic activity concentrates on securing capacity rather than buying revenue. Suppliers are protecting forging and fabrication slots, expanding service and recertification networks close to producing basins, and forming alliances that bundle hardware with installation vessels. Integrated contracting models, where a single party carries subsea equipment and installation risk, continue to spread because they shorten schedules.
Strategic direction is converging on three themes: standardised product ranges that trade bespoke engineering for factory throughput, aftermarket and life-extension services that stabilise earnings, and adjacent offshore work in electrification and carbon storage that reuses existing assets.
Offshore Oil and Gas Equipment Industry Leaders
- SLB
- TechnipFMC plc
- Baker Hughes Company
- Aker Solutions ASA
- Subsea 7 S.A.
Recent Industry Developments
- March 2024: The United States Environmental Protection Agency published its final methane and volatile organic compound standards for the oil and natural gas sector in the Federal Register – tightens vent, flare and leak detection equipment requirements that operators must meet on production facilities.
- April 2024: The Bureau of Ocean Energy Management finalised its risk management, financial assurance and loss prevention rule for offshore leases – raises the financial provisioning attached to eventual decommissioning and brings end-of-life equipment planning forward.
- August 2024: The European Union methane emissions regulation for the energy sector entered into force – creates measurement, reporting and verification duties that drive demand for monitoring and flare reduction equipment on offshore facilities.
- December 2023: The Oil and Gas Decarbonization Charter was launched at COP28 in Dubai, with signatories targeting near-zero upstream methane by 2030 – strengthens the business case for platform electrification and topsides emissions equipment.
Companies Covered in the Report
- SLB
- TechnipFMC plc
- Baker Hughes Company
- Aker Solutions ASA
- Subsea 7 S.A.
- Saipem S.p.A.
- NOV Inc.
- Halliburton Company
- Oceaneering International, Inc.
- SBM Offshore N.V.
- MODEC, Inc.
- McDermott International, Ltd
- Seatrium Limited
- Nexans S.A.
Offshore Oil and Gas Equipment Market Report Scope
This study covers equipment supplied to offshore exploration, development and production: drilling equipment, blowout preventers and risers, subsea production systems, floating production systems equipment, fixed platform topsides and jackets, and pipeline and flow assurance hardware. Installation, commissioning and maintenance services attached to that equipment are counted; onshore facilities, rig day rates and offshore wind structures are excluded. The base year is 2025 and the forecast period is 2026 to 2033, in US$ Billion.
Equipment Type
- Drilling equipment
- Subsea production systems
- Floating production systems equipment
- Fixed platform topsides and jackets equipment
- Pipeline and flow assurance equipment
Water Depth
- Shallow water
- Deepwater
- Ultra-deepwater
Field Life Stage
- Greenfield development
- Brownfield expansion and tiebacks
- Life extension and maintenance
- Decommissioning
Offering
- Equipment
- Installation and commissioning services
- Maintenance, repair and aftermarket services
Regions
- North America
- Europe
- Asia Pacific
- Latin America
- Middle East & Africa
Key Questions Answered in the Report
How big is the offshore oil and gas equipment market in 2026?
The market is valued at US$ 94.0 billion in 2026, covering drilling, subsea, floating production, fixed platform and pipeline equipment plus attached installation and maintenance services.
What is the offshore oil and gas equipment market forecast to 2033?
The market is projected to reach US$ 138.0 billion by 2033, a 5.6% CAGR and an absolute dollar opportunity of US$ 44.0 billion over the period.
Which equipment type holds the largest share of offshore spending?
Subsea production systems hold the largest share at 34% in 2026, because trees, manifolds, umbilicals and flowlines feature in almost every modern offshore development.
Which offshore equipment segment is growing fastest through 2033?
Ultra-deepwater equipment grows fastest at a 7.8% CAGR, as presalt and frontier basins require higher-pressure trees, heavier risers and more capable blowout preventers.
Which region leads the offshore oil and gas equipment market?
Latin America leads with 25% share in 2026, driven by Brazil presalt floating production orders and the rapid development sequence offshore Guyana.
1. Executive Summary
1.1. Global Offshore Oil and Gas Equipment Market Snapshot
1.2. Future Projections
1.3. Key Report Takeaways
1.4. Regional Snapshot
2. Market Overview
2.1. Market Definition and Report Scope
2.2. Historical Trends 2020–2025
2.3. Market Dynamics
2.3.1. Drivers
2.3.1.1. Scarce Yard Slots, Vessels and Forgings Set the Price of Offshore Oil and Gas Equipment
2.3.1.2. Standardised Subsea Modules Cut Engineering Hours and Unlock Deepwater Field Sanctions
2.3.2. Restraints
2.3.2.1. Uncertain Long-Term Demand Keeps Offshore Oil and Gas Capital Discipline Unusually Tight
2.3.2.2. Qualification, Permitting and Forging Cost Inflation Slow Offshore Equipment Deliveries
2.3.3. Market Opportunities
2.3.3.1. Subsea Tiebacks and Brownfield Life Extension Open a Recurring Offshore Equipment Revenue Pool
2.3.3.2. Offshore Electrification, Carbon Storage and Decommissioning Extend the Addressable Equipment Base
3. Global Offshore Oil and Gas Equipment Market Outlook, 2020–2033
3.1. Global Offshore Oil and Gas Equipment Market Outlook, by Equipment Type, Value (US$ Billion), 2020–2033
3.1.1. Drilling equipment
3.1.2. Subsea production systems
3.1.3. Floating production systems equipment
3.1.4. Fixed platform topsides and jackets equipment
3.1.5. Pipeline and flow assurance equipment
3.2. Global Offshore Oil and Gas Equipment Market Outlook, by Water Depth, Value (US$ Billion), 2020–2033
3.2.1. Shallow water
3.2.2. Deepwater
3.2.3. Ultra-deepwater
3.3. Global Offshore Oil and Gas Equipment Market Outlook, by Field Life Stage, Value (US$ Billion), 2020–2033
3.3.1. Greenfield development
3.3.2. Brownfield expansion and tiebacks
3.3.3. Life extension and maintenance
3.3.4. Decommissioning
3.4. Global Offshore Oil and Gas Equipment Market Outlook, by Offering, Value (US$ Billion), 2020–2033
3.4.1. Equipment
3.4.2. Installation and commissioning services
3.4.3. Maintenance, repair and aftermarket services
3.5. Global Offshore Oil and Gas Equipment Market Outlook, by Region, Value (US$ Billion), 2020–2033
3.5.1. North America
3.5.2. Europe
3.5.3. Asia Pacific
3.5.4. Latin America
3.5.5. Middle East & Africa
4. North America Offshore Oil and Gas Equipment Market Outlook, 2020–2033
4.1. North America Offshore Oil and Gas Equipment Market Outlook, by Equipment Type, Value (US$ Billion), 2020–2033
4.1.1. Drilling equipment
4.1.2. Subsea production systems
4.1.3. Floating production systems equipment
4.1.4. Fixed platform topsides and jackets equipment
4.1.5. Pipeline and flow assurance equipment
4.2. North America Offshore Oil and Gas Equipment Market Outlook, by Water Depth, Value (US$ Billion), 2020–2033
4.2.1. Shallow water
4.2.2. Deepwater
4.2.3. Ultra-deepwater
4.3. North America Offshore Oil and Gas Equipment Market Outlook, by Field Life Stage, Value (US$ Billion), 2020–2033
4.3.1. Greenfield development
4.3.2. Brownfield expansion and tiebacks
4.3.3. Life extension and maintenance
4.3.4. Decommissioning
4.4. North America Offshore Oil and Gas Equipment Market Outlook, by Offering, Value (US$ Billion), 2020–2033
4.4.1. Equipment
4.4.2. Installation and commissioning services
4.4.3. Maintenance, repair and aftermarket services
4.5. North America Offshore Oil and Gas Equipment Market Outlook, by Country, Value (US$ Billion), 2020–2033
4.5.1. United States Offshore Oil and Gas Equipment Market Outlook, by Equipment Type, 2020–2033
4.5.2. United States Offshore Oil and Gas Equipment Market Outlook, by Water Depth, 2020–2033
4.5.3. United States Offshore Oil and Gas Equipment Market Outlook, by Field Life Stage, 2020–2033
4.5.4. United States Offshore Oil and Gas Equipment Market Outlook, by Offering, 2020–2033
4.5.5. Mexico Offshore Oil and Gas Equipment Market Outlook, by Equipment Type, 2020–2033
4.5.6. Mexico Offshore Oil and Gas Equipment Market Outlook, by Water Depth, 2020–2033
4.5.7. Mexico Offshore Oil and Gas Equipment Market Outlook, by Field Life Stage, 2020–2033
4.5.8. Mexico Offshore Oil and Gas Equipment Market Outlook, by Offering, 2020–2033
5. Europe Offshore Oil and Gas Equipment Market Outlook, 2020–2033
5.1. Europe Offshore Oil and Gas Equipment Market Outlook, by Equipment Type, Value (US$ Billion), 2020–2033
5.1.1. Drilling equipment
5.1.2. Subsea production systems
5.1.3. Floating production systems equipment
5.1.4. Fixed platform topsides and jackets equipment
5.1.5. Pipeline and flow assurance equipment
5.2. Europe Offshore Oil and Gas Equipment Market Outlook, by Water Depth, Value (US$ Billion), 2020–2033
5.2.1. Shallow water
5.2.2. Deepwater
5.2.3. Ultra-deepwater
5.3. Europe Offshore Oil and Gas Equipment Market Outlook, by Field Life Stage, Value (US$ Billion), 2020–2033
5.3.1. Greenfield development
5.3.2. Brownfield expansion and tiebacks
5.3.3. Life extension and maintenance
5.3.4. Decommissioning
5.4. Europe Offshore Oil and Gas Equipment Market Outlook, by Offering, Value (US$ Billion), 2020–2033
5.4.1. Equipment
5.4.2. Installation and commissioning services
5.4.3. Maintenance, repair and aftermarket services
5.5. Europe Offshore Oil and Gas Equipment Market Outlook, by Country, Value (US$ Billion), 2020–2033
5.5.1. Norway Offshore Oil and Gas Equipment Market Outlook, by Equipment Type, 2020–2033
5.5.2. Norway Offshore Oil and Gas Equipment Market Outlook, by Water Depth, 2020–2033
5.5.3. Norway Offshore Oil and Gas Equipment Market Outlook, by Field Life Stage, 2020–2033
5.5.4. Norway Offshore Oil and Gas Equipment Market Outlook, by Offering, 2020–2033
5.5.5. United Kingdom Offshore Oil and Gas Equipment Market Outlook, by Equipment Type, 2020–2033
5.5.6. United Kingdom Offshore Oil and Gas Equipment Market Outlook, by Water Depth, 2020–2033
5.5.7. United Kingdom Offshore Oil and Gas Equipment Market Outlook, by Field Life Stage, 2020–2033
5.5.8. United Kingdom Offshore Oil and Gas Equipment Market Outlook, by Offering, 2020–2033
6. Asia Pacific Offshore Oil and Gas Equipment Market Outlook, 2020–2033
6.1. Asia Pacific Offshore Oil and Gas Equipment Market Outlook, by Equipment Type, Value (US$ Billion), 2020–2033
6.1.1. Drilling equipment
6.1.2. Subsea production systems
6.1.3. Floating production systems equipment
6.1.4. Fixed platform topsides and jackets equipment
6.1.5. Pipeline and flow assurance equipment
6.2. Asia Pacific Offshore Oil and Gas Equipment Market Outlook, by Water Depth, Value (US$ Billion), 2020–2033
6.2.1. Shallow water
6.2.2. Deepwater
6.2.3. Ultra-deepwater
6.3. Asia Pacific Offshore Oil and Gas Equipment Market Outlook, by Field Life Stage, Value (US$ Billion), 2020–2033
6.3.1. Greenfield development
6.3.2. Brownfield expansion and tiebacks
6.3.3. Life extension and maintenance
6.3.4. Decommissioning
6.4. Asia Pacific Offshore Oil and Gas Equipment Market Outlook, by Offering, Value (US$ Billion), 2020–2033
6.4.1. Equipment
6.4.2. Installation and commissioning services
6.4.3. Maintenance, repair and aftermarket services
6.5. Asia Pacific Offshore Oil and Gas Equipment Market Outlook, by Country, Value (US$ Billion), 2020–2033
6.5.1. China Offshore Oil and Gas Equipment Market Outlook, by Equipment Type, 2020–2033
6.5.2. China Offshore Oil and Gas Equipment Market Outlook, by Water Depth, 2020–2033
6.5.3. China Offshore Oil and Gas Equipment Market Outlook, by Field Life Stage, 2020–2033
6.5.4. China Offshore Oil and Gas Equipment Market Outlook, by Offering, 2020–2033
6.5.5. India Offshore Oil and Gas Equipment Market Outlook, by Equipment Type, 2020–2033
6.5.6. India Offshore Oil and Gas Equipment Market Outlook, by Water Depth, 2020–2033
6.5.7. India Offshore Oil and Gas Equipment Market Outlook, by Field Life Stage, 2020–2033
6.5.8. India Offshore Oil and Gas Equipment Market Outlook, by Offering, 2020–2033
6.5.9. Malaysia Offshore Oil and Gas Equipment Market Outlook, by Equipment Type, 2020–2033
6.5.10. Malaysia Offshore Oil and Gas Equipment Market Outlook, by Water Depth, 2020–2033
6.5.11. Malaysia Offshore Oil and Gas Equipment Market Outlook, by Field Life Stage, 2020–2033
6.5.12. Malaysia Offshore Oil and Gas Equipment Market Outlook, by Offering, 2020–2033
6.5.13. Indonesia Offshore Oil and Gas Equipment Market Outlook, by Equipment Type, 2020–2033
6.5.14. Indonesia Offshore Oil and Gas Equipment Market Outlook, by Water Depth, 2020–2033
6.5.15. Indonesia Offshore Oil and Gas Equipment Market Outlook, by Field Life Stage, 2020–2033
6.5.16. Indonesia Offshore Oil and Gas Equipment Market Outlook, by Offering, 2020–2033
6.5.17. Australia Offshore Oil and Gas Equipment Market Outlook, by Equipment Type, 2020–2033
6.5.18. Australia Offshore Oil and Gas Equipment Market Outlook, by Water Depth, 2020–2033
6.5.19. Australia Offshore Oil and Gas Equipment Market Outlook, by Field Life Stage, 2020–2033
6.5.20. Australia Offshore Oil and Gas Equipment Market Outlook, by Offering, 2020–2033
6.5.21. Vietnam Offshore Oil and Gas Equipment Market Outlook, by Equipment Type, 2020–2033
6.5.22. Vietnam Offshore Oil and Gas Equipment Market Outlook, by Water Depth, 2020–2033
6.5.23. Vietnam Offshore Oil and Gas Equipment Market Outlook, by Field Life Stage, 2020–2033
6.5.24. Vietnam Offshore Oil and Gas Equipment Market Outlook, by Offering, 2020–2033
7. Latin America Offshore Oil and Gas Equipment Market Outlook, 2020–2033
7.1. Latin America Offshore Oil and Gas Equipment Market Outlook, by Equipment Type, Value (US$ Billion), 2020–2033
7.1.1. Drilling equipment
7.1.2. Subsea production systems
7.1.3. Floating production systems equipment
7.1.4. Fixed platform topsides and jackets equipment
7.1.5. Pipeline and flow assurance equipment
7.2. Latin America Offshore Oil and Gas Equipment Market Outlook, by Water Depth, Value (US$ Billion), 2020–2033
7.2.1. Shallow water
7.2.2. Deepwater
7.2.3. Ultra-deepwater
7.3. Latin America Offshore Oil and Gas Equipment Market Outlook, by Field Life Stage, Value (US$ Billion), 2020–2033
7.3.1. Greenfield development
7.3.2. Brownfield expansion and tiebacks
7.3.3. Life extension and maintenance
7.3.4. Decommissioning
7.4. Latin America Offshore Oil and Gas Equipment Market Outlook, by Offering, Value (US$ Billion), 2020–2033
7.4.1. Equipment
7.4.2. Installation and commissioning services
7.4.3. Maintenance, repair and aftermarket services
7.5. Latin America Offshore Oil and Gas Equipment Market Outlook, by Country, Value (US$ Billion), 2020–2033
7.5.1. Brazil Offshore Oil and Gas Equipment Market Outlook, by Equipment Type, 2020–2033
7.5.2. Brazil Offshore Oil and Gas Equipment Market Outlook, by Water Depth, 2020–2033
7.5.3. Brazil Offshore Oil and Gas Equipment Market Outlook, by Field Life Stage, 2020–2033
7.5.4. Brazil Offshore Oil and Gas Equipment Market Outlook, by Offering, 2020–2033
7.5.5. Guyana Offshore Oil and Gas Equipment Market Outlook, by Equipment Type, 2020–2033
7.5.6. Guyana Offshore Oil and Gas Equipment Market Outlook, by Water Depth, 2020–2033
7.5.7. Guyana Offshore Oil and Gas Equipment Market Outlook, by Field Life Stage, 2020–2033
7.5.8. Guyana Offshore Oil and Gas Equipment Market Outlook, by Offering, 2020–2033
7.5.9. Argentina Offshore Oil and Gas Equipment Market Outlook, by Equipment Type, 2020–2033
7.5.10. Argentina Offshore Oil and Gas Equipment Market Outlook, by Water Depth, 2020–2033
7.5.11. Argentina Offshore Oil and Gas Equipment Market Outlook, by Field Life Stage, 2020–2033
7.5.12. Argentina Offshore Oil and Gas Equipment Market Outlook, by Offering, 2020–2033
7.5.13. Trinidad and Tobago Offshore Oil and Gas Equipment Market Outlook, by Equipment Type, 2020–2033
7.5.14. Trinidad and Tobago Offshore Oil and Gas Equipment Market Outlook, by Water Depth, 2020–2033
7.5.15. Trinidad and Tobago Offshore Oil and Gas Equipment Market Outlook, by Field Life Stage, 2020–2033
7.5.16. Trinidad and Tobago Offshore Oil and Gas Equipment Market Outlook, by Offering, 2020–2033
8. Middle East & Africa Offshore Oil and Gas Equipment Market Outlook, 2020–2033
8.1. Middle East & Africa Offshore Oil and Gas Equipment Market Outlook, by Equipment Type, Value (US$ Billion), 2020–2033
8.1.1. Drilling equipment
8.1.2. Subsea production systems
8.1.3. Floating production systems equipment
8.1.4. Fixed platform topsides and jackets equipment
8.1.5. Pipeline and flow assurance equipment
8.2. Middle East & Africa Offshore Oil and Gas Equipment Market Outlook, by Water Depth, Value (US$ Billion), 2020–2033
8.2.1. Shallow water
8.2.2. Deepwater
8.2.3. Ultra-deepwater
8.3. Middle East & Africa Offshore Oil and Gas Equipment Market Outlook, by Field Life Stage, Value (US$ Billion), 2020–2033
8.3.1. Greenfield development
8.3.2. Brownfield expansion and tiebacks
8.3.3. Life extension and maintenance
8.3.4. Decommissioning
8.4. Middle East & Africa Offshore Oil and Gas Equipment Market Outlook, by Offering, Value (US$ Billion), 2020–2033
8.4.1. Equipment
8.4.2. Installation and commissioning services
8.4.3. Maintenance, repair and aftermarket services
8.5. Middle East & Africa Offshore Oil and Gas Equipment Market Outlook, by Country, Value (US$ Billion), 2020–2033
8.5.1. Saudi Arabia Offshore Oil and Gas Equipment Market Outlook, by Equipment Type, 2020–2033
8.5.2. Saudi Arabia Offshore Oil and Gas Equipment Market Outlook, by Water Depth, 2020–2033
8.5.3. Saudi Arabia Offshore Oil and Gas Equipment Market Outlook, by Field Life Stage, 2020–2033
8.5.4. Saudi Arabia Offshore Oil and Gas Equipment Market Outlook, by Offering, 2020–2033
8.5.5. United Arab Emirates Offshore Oil and Gas Equipment Market Outlook, by Equipment Type, 2020–2033
8.5.6. United Arab Emirates Offshore Oil and Gas Equipment Market Outlook, by Water Depth, 2020–2033
8.5.7. United Arab Emirates Offshore Oil and Gas Equipment Market Outlook, by Field Life Stage, 2020–2033
8.5.8. United Arab Emirates Offshore Oil and Gas Equipment Market Outlook, by Offering, 2020–2033
8.5.9. Qatar Offshore Oil and Gas Equipment Market Outlook, by Equipment Type, 2020–2033
8.5.10. Qatar Offshore Oil and Gas Equipment Market Outlook, by Water Depth, 2020–2033
8.5.11. Qatar Offshore Oil and Gas Equipment Market Outlook, by Field Life Stage, 2020–2033
8.5.12. Qatar Offshore Oil and Gas Equipment Market Outlook, by Offering, 2020–2033
8.5.13. Nigeria Offshore Oil and Gas Equipment Market Outlook, by Equipment Type, 2020–2033
8.5.14. Nigeria Offshore Oil and Gas Equipment Market Outlook, by Water Depth, 2020–2033
8.5.15. Nigeria Offshore Oil and Gas Equipment Market Outlook, by Field Life Stage, 2020–2033
8.5.16. Nigeria Offshore Oil and Gas Equipment Market Outlook, by Offering, 2020–2033
8.5.17. Angola Offshore Oil and Gas Equipment Market Outlook, by Equipment Type, 2020–2033
8.5.18. Angola Offshore Oil and Gas Equipment Market Outlook, by Water Depth, 2020–2033
8.5.19. Angola Offshore Oil and Gas Equipment Market Outlook, by Field Life Stage, 2020–2033
8.5.20. Angola Offshore Oil and Gas Equipment Market Outlook, by Offering, 2020–2033
8.5.21. Namibia Offshore Oil and Gas Equipment Market Outlook, by Equipment Type, 2020–2033
8.5.22. Namibia Offshore Oil and Gas Equipment Market Outlook, by Water Depth, 2020–2033
8.5.23. Namibia Offshore Oil and Gas Equipment Market Outlook, by Field Life Stage, 2020–2033
8.5.24. Namibia Offshore Oil and Gas Equipment Market Outlook, by Offering, 2020–2033
8.5.25. Côte d'Ivoire Offshore Oil and Gas Equipment Market Outlook, by Equipment Type, 2020–2033
8.5.26. Côte d'Ivoire Offshore Oil and Gas Equipment Market Outlook, by Water Depth, 2020–2033
8.5.27. Côte d'Ivoire Offshore Oil and Gas Equipment Market Outlook, by Field Life Stage, 2020–2033
8.5.28. Côte d'Ivoire Offshore Oil and Gas Equipment Market Outlook, by Offering, 2020–2033
8.5.29. Republic of the Congo Offshore Oil and Gas Equipment Market Outlook, by Equipment Type, 2020–2033
8.5.30. Republic of the Congo Offshore Oil and Gas Equipment Market Outlook, by Water Depth, 2020–2033
8.5.31. Republic of the Congo Offshore Oil and Gas Equipment Market Outlook, by Field Life Stage, 2020–2033
8.5.32. Republic of the Congo Offshore Oil and Gas Equipment Market Outlook, by Offering, 2020–2033
8.5.33. Mozambique Offshore Oil and Gas Equipment Market Outlook, by Equipment Type, 2020–2033
8.5.34. Mozambique Offshore Oil and Gas Equipment Market Outlook, by Water Depth, 2020–2033
8.5.35. Mozambique Offshore Oil and Gas Equipment Market Outlook, by Field Life Stage, 2020–2033
8.5.36. Mozambique Offshore Oil and Gas Equipment Market Outlook, by Offering, 2020–2033
8.5.37. Egypt Offshore Oil and Gas Equipment Market Outlook, by Equipment Type, 2020–2033
8.5.38. Egypt Offshore Oil and Gas Equipment Market Outlook, by Water Depth, 2020–2033
8.5.39. Egypt Offshore Oil and Gas Equipment Market Outlook, by Field Life Stage, 2020–2033
8.5.40. Egypt Offshore Oil and Gas Equipment Market Outlook, by Offering, 2020–2033
9. Competitive Landscape
9.1. Market Concentration and Industry Leaders
9.2. Competitive Differentiation
9.3. Strategic Moves and Market Direction
9.4. Recent Industry Developments
9.5. Company Profiles
9.5.1. SLB
9.5.2. TechnipFMC plc
9.5.3. Baker Hughes Company
9.5.4. Aker Solutions ASA
9.5.5. Subsea 7 S.A.
9.5.6. Saipem S.p.A.
9.5.7. NOV Inc.
9.5.8. Halliburton Company
9.5.9. Oceaneering International, Inc.
9.5.10. SBM Offshore N.V.
9.5.11. MODEC, Inc.
9.5.12. McDermott International, Ltd
9.5.13. Seatrium Limited
9.5.14. Nexans S.A.
10. Appendix
10.1. Research Methodology
10.2. Report Assumptions
10.3. Acronyms and Abbreviations
| Equipment Type | Drilling equipment, Subsea production systems, Floating production systems equipment, Fixed platform topsides and jackets equipment, Pipeline and flow assurance equipment |
| Water Depth | Shallow water, Deepwater, Ultra-deepwater |
| Field Life Stage | Greenfield development, Brownfield expansion and tiebacks, Life extension and maintenance, Decommissioning |
| Offering | Equipment, Installation and commissioning services, Maintenance, repair and aftermarket services |
| Regions | North America, Europe, Asia Pacific, Latin America, Middle East & Africa |
Our Research Methodology
Considering the volatility of business today, traditional approaches to strategizing a game plan can be unfruitful if not detrimental. True ambiguity is no way to determine a forecast. A myriad of predetermined factors must be accounted for such as the degree of risk involved, the magnitude of circumstances, as well as conditions or consequences that are not known or unpredictable. To circumvent binary views that cast uncertainty, the application of market research intelligence to strategically posture, move, and enable actionable outcomes is necessary.
View Methodology
Quality Assured
Rigorous Validation Process

Confidentiality Assured
End-to-end Data Security

Custom Research Services
Tailored To Your Objectives
FAQs
The market is valued at US$ 94.0 billion in 2026, covering drilling, subsea, floating production, fixed platform and pipeline equipment plus attached installation and maintenance services.
The market is projected to reach US$ 138.0 billion by 2033, a 5.6% CAGR and an absolute dollar opportunity of US$ 44.0 billion over the period.
Subsea production systems hold the largest share at 34% in 2026, because trees, manifolds, umbilicals and flowlines feature in almost every modern offshore development.
Ultra-deepwater equipment grows fastest at a 7.8% CAGR, as presalt and frontier basins require higher-pressure trees, heavier risers and more capable blowout preventers.
Latin America leads with 25% share in 2026, driven by Brazil presalt floating production orders and the rapid development sequence offshore Guyana.
Related Reports
Floating Storage and Regasification Unit Market Size, Share, Insights, Competitive Landscape, and Forecast 2026 to 2033
Floating storage and regasification unit market to grow from US$8.96 Bn in 2026 to US$13.92 Bn by 2033 at 6.5% CAGR. Explore types, mooring and regions.
Floating Solar Market Size, Share, Insights, Competitive Landscape, and Forecast 2026 to 2033
Floating solar market to grow from US$1.60 Bn in 2026 to US$4.02 Bn by 2033 at 14.1% CAGR. Explore capacities, products, locations and regional trends.
Offshore Grid Connection Solutions Market Size, Share, Insights, Competitive Landscape, and Forecast 2026 to 2033
Offshore grid connection solutions market to reach US$ 5.71 billion by 2033 at a 6.7% CAGR. Explore HVDC, subsea cables, applications and regional trends.
Nickel Hydrogen Batteries Market Size, Share, Insights, Competitive Landscape, and Forecast 2026 to 2033
Nickel hydrogen batteries market to reach US$11.85 billion by 2033 at 13.7% CAGR, driven by hybrid vehicles and stationary energy storage.
Landing String Equipment Market Size, Share, Insights, Competitive Landscape, and Forecast 2026 to 2033
Explore the landing string equipment market, reaching US$ 0.80 billion by 2033 at 6.6% CAGR, with component, technology and regional insights.
Fuel Cell Market Size, Share, Insights, Competitive Landscape, and Forecast 2026 to 2033
Fuel cell market to reach US$ 21.6 billion by 2033 at 17.0% CAGR. Explore technologies, applications, regions and key companies.