



Floating Storage and Regasification Unit Market
Floating Storage and Regasification Unit Market Size, Share, Insights, Competitive Landscape, and Forecast 2026 to 2033
Floating Storage and Regasification Unit Market Size and Trend Analysis
How Fast Is the Floating Storage and Regasification Unit Market Growing?
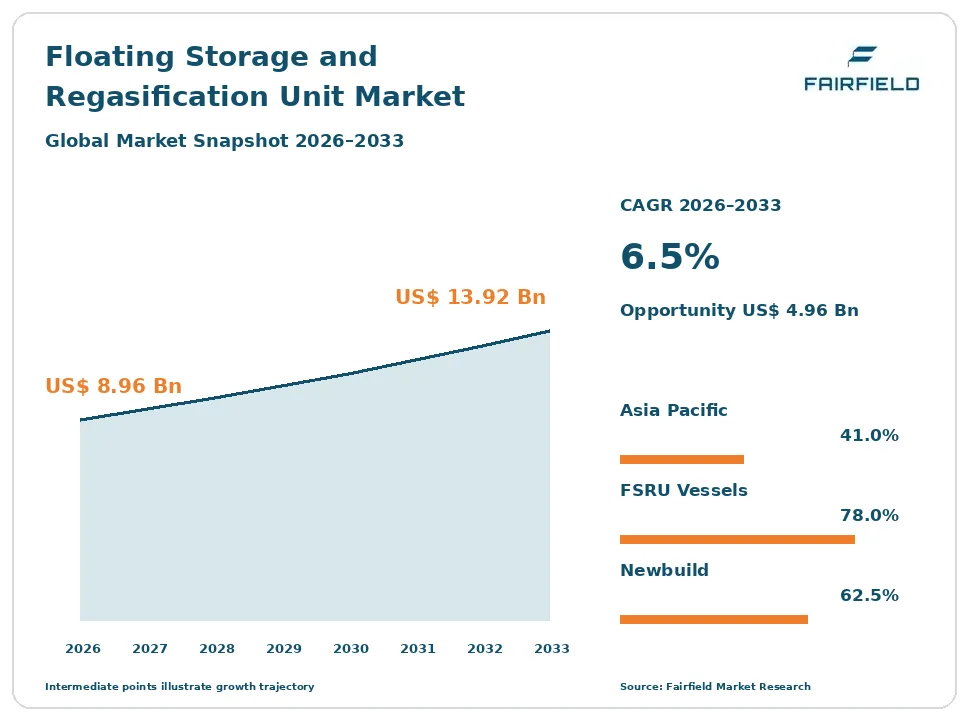
The global floating storage and regasification unit market size is expected to be valued at US$ 8.96 billion in 2026 and projected to reach US$ 13.92 billion by 2033, growing at a CAGR of 6.5% between 2026 and 2033.
Between 2020 and 2025, the market grew at a CAGR of about 7.1%, with a sharp jump in 2022 and 2023 when Europe chartered many FSRUs to replace Russian pipeline gas and Germany built its first LNG imports terminals in record time. Three factors now drive growth: concern for energy security, rising gas-to-power demand in emerging economies, and the speed and low cost of FSRUs compared with onshore terminals. The market is shifting toward long-term charters in Egypt, India, Vietnam, the Philippines, and Latin America, along with LNG carrier conversion projects that turn older ships into FSRUs at lower cost. New units offer larger regasification capacity, lower emissions, and the ability to produce power or supply bunker fuel. Growing global LNG supply from Qatar and the United States in 2026 and beyond supports new import projects.
Key Report Takeaways
- By Type: FSRU Vessels held 78.0% share in 2026, while FSU with Regasification Facility is projected to expand at an 8.4% CAGR through 2033, driven by lower-cost hybrid setups using onshore or jetty-based regas units.
- By Construction Type: Newbuild held 62.5% share in 2026, while Converted is projected to expand at an 8.1% CAGR through 2033, driven by cheaper, faster conversion of older LNG carriers.
- By Mooring System: Offshore-Moored held 57.0% share in 2026, while Jetty-Moored is projected to expand at a 7.6% CAGR through 2033, driven by port upgrades that allow simpler berthing.
- By Region: Asia Pacific held 41.0% share in 2026, while Middle East & Africa is projected to expand at an 8.3% CAGR through 2033, driven by gas import needs in Egypt, Morocco, and South Africa.
Global Floating Storage and Regasification Unit Market Trends and Insights
Drivers Impact Analysis
| Driver | Impact on CAGR Forecast | Geographic Relevance | Impact Timeline |
| Energy security and fast LNG import capacity | High | Europe, Asia Pacific, Middle East & Africa | Medium term (2-4 years) |
| Rising gas-to-power demand in emerging markets | High | Asia Pacific, Latin America, Middle East & Africa | Long term (≥4 years) |
Two drivers carry the strongest influence on floating storage and regasification unit demand during the forecast period.
Energy Security Is Driving the Floating Storage and Regasification Unit Market
Energy security and the need for fast LNG import capacity are the strongest driver of the floating storage and regasification unit market. Countries want flexible ways to bring in gas quickly.
The mechanism is the speed and flexibility of floating terminals. An FSRU can start operating within one to two years, compared with four to six years for an onshore terminal, and it can be moved if needs change. After Russia cut pipeline gas to Europe in 2022, Germany, Italy, Finland, the Netherlands, and France chartered FSRUs to secure supply. Egypt turned to FSRUs when domestic gas production fell short of demand, chartering units from Höegh Evi, New Fortress Energy, and others. Countries facing gas shortages, such as Pakistan and Bangladesh, rely on FSRUs for LNG imports. Charter contracts reduce upfront costs for governments. These factors drive steady charter demand.
Gas-to-Power Demand Is Expanding the Floating Storage and Regasification Unit Market
Rising gas-to-power demand in emerging markets is expanding the floating storage and regasification unit market. Many countries use gas to replace coal and oil in power plants.
The cause is growing electricity demand and the shift from more polluting fuels. India, Vietnam, the Philippines, Indonesia, and Bangladesh are building gas-fired plants that need LNG. Brazil, Colombia, Chile, and the Dominican Republic use FSRUs to supply power plants and industry. Gas also backs up solar and wind, which vary with the weather. FSRUs suit countries with limited funds or uncertain long-term demand because they can be chartered rather than bought. India signed a license for an FSRU-based terminal at Haldia in 2026. These trends add new markets for FSRU owners.
Restraints Impact Analysis
| Restraint | Impact on CAGR Forecast | Geographic Relevance | Impact Timeline |
| LNG price volatility and demand uncertainty | High | Global | Short term (≤2 years) |
| Energy transition and climate policy | Medium | Europe | Long term (≥4 years) |
Two restraints limit how quickly the floating storage and regasification unit market grows.
LNG Price Volatility Slows the Floating Storage and Regasification Unit Market
LNG price volatility and demand uncertainty slow the floating storage and regasification unit market. High gas prices can make LNG unaffordable for importers.
The specific causes are tight supply and competition for cargoes. LNG prices spiked in 2022, pricing poorer importers such as Pakistan and Bangladesh out of the market and leaving some FSRUs underused. Buyers in Pakistan, Bangladesh, and India cut spot purchases when prices rose and turned back to coal or fuel oil. Some planned projects were delayed or cancelled, and FSRU owners faced idle vessels or short charters at lower rates. Debt pressure at some owners and charterers, along with late payments by state utilities in a few markets, adds financial risk. Lenders demand strong credit backing before funding new units. Price spikes remain possible. These factors make charter demand uneven and slow final investment decisions.
Energy Transition Restricts the Floating Storage and Regasification Unit Market
The energy transition and climate policy restrict the floating storage and regasification unit market. Some governments want to limit new fossil fuel infrastructure.
The underlying causes are climate targets and falling gas demand in some regions. European Union gas demand has fallen since 2022 due to efficiency, renewables, and heat pumps, leaving some new FSRUs underused. Environmental groups challenge new terminals in courts. Investors face pressure to reduce fossil fuel exposure. Methane emissions from LNG supply chains attract regulatory attention. Some charters in Europe were shortened, and Germany has debated how many of its floating terminals it will still need after 2030. Carbon pricing raises the long-term cost of gas-fired power, and cheap solar plus batteries now compete with gas in some emerging markets. Owners must plan for vessels that may be redeployed several times. These factors cap long-term growth in mature markets and add redeployment risk.
Market Opportunities
Emerging Market LNG Imports Open a Long-Term Revenue Pool
New LNG import projects in emerging markets open a long-term revenue pool in the floating storage and regasification unit market. Many countries are starting LNG imports for the first time.
FSRU owners with available vessels can capture this opportunity. Egypt has chartered several units, including Höegh Evi’s Hoegh Gandria under a 10-year charter from 2026. India, Vietnam, the Philippines, Morocco, South Africa, Ghana, and Australia are developing FSRU terminals. Vopak chose Seapeak to supply an FSRU for a terminal in Victoria, Australia, in 2025. Long-term charters of 10 years or more provide stable cash flow and support financing for new vessels. Bundled offers that include LNG supply, regasification, and power generation add value for buyers that lack in-house expertise. Small-scale FSRUs for island grids in the Philippines, Jamaica, and Puerto Rico widen the customer base further.
LNG Carrier Conversions Create a Cost-Efficient Revenue Pool
LNG carrier conversion creates a cost-efficient revenue pool in the floating storage and regasification unit market. Older steam-turbine LNG carriers are being retired from trading.
Shipyards and owners with conversion expertise can capture this opportunity. Converting an existing carrier costs less and takes less time than building a new FSRU. Many older carriers are becoming uneconomic for trading as new, efficient ships enter the fleet. Shipyards in Singapore, China, and South Korea offer conversion services. This lets owners offer cheaper charters to price-sensitive buyers in Asia Pacific and Middle East & Africa. A conversion can be delivered in about two years, compared with three or more for a newbuild. Floating storage units with separate regas plants are another lower-cost option. Conversions also extend the working life of existing ships.
Segment Analysis
By Type: FSRU Vessels Lead While FSU with Regasification Facility Grows Fastest
FSRU Vessels held 78.0% share in 2026. Self-contained FSRU vessels store LNG and turn it back into gas onboard, sending it ashore through pipelines. They can also trade as LNG carriers when not used as terminals, which reduces idle-vessel risk for owners. Most units offer send-out rates of 500 to 1,000 mmscf per day. Excelerate Energy, Höegh Evi, BW LNG, Energos Infrastructure, and Mitsui O.S.K. Lines own large fleets.
FSU with Regasification Facility is the fastest-growing type, expanding at an 8.4% CAGR through 2033. A floating storage unit paired with jetty or onshore regas equipment can be cheaper and suit smaller markets. For the market, this growth widens options for new buyers.
By Construction Type: Newbuild Leads While Converted Grows Fastest
Newbuild held 62.5% share in 2026. Newbuild FSRUs from Samsung Heavy Industries, Hyundai Heavy Industries, and Hanwha Ocean offer larger capacity, modern efficiency, and long life. Owners order them for long-term charters with strong buyers, and newer designs include higher send-out rates, dual-fuel engines, and lower boil-off. Newbuilds also command higher charter rates and longer contract terms, which supports financing.
Converted is the fastest-growing construction type, expanding at an 8.1% CAGR through 2033. LNG carrier conversion lowers costs and shortens delivery time, using older steam-turbine carriers that are no longer competitive in trading. Shipyards in Singapore and China handle most of this work. For the market, conversions improve affordability for first-time importers.
By Mooring System: Offshore-Moored Leads While Jetty-Moored Grows Fastest
Offshore-Moored held 57.0% share in 2026. Offshore mooring with buoys or towers allows FSRUs to operate away from crowded ports and in deeper water. It suits locations without suitable harbors and keeps LNG operations away from busy shipping lanes and towns. Many units in Brazil, Egypt, and Bangladesh use offshore mooring, though it needs subsea pipelines and costs more to install.
Jetty-Moored is the fastest-growing mooring system, expanding at a 7.6% CAGR through 2033. Jetty mooring at ports is simpler and cheaper when suitable berths exist, and it allows easier ship-to-ship LNG transfers. Terminals in Germany, India, and Australia favor jetty setups. For the market, jetty growth lowers project costs and speeds start-up.
Geography Analysis
North America Advances the Floating Storage and Regasification Unit Market Through FSRU Owners
North America is home to major FSRU owners, though it imports little LNG itself. Excelerate Energy and New Fortress Energy are based in the United States and deploy FSRUs worldwide. Puerto Rico and Mexico use floating terminals. The United States is the world’s largest LNG exporter, supplying cargoes to FSRU terminals worldwide. American owners bundle LNG imports, vessels, and power plants in integrated deals. Key barriers include high capital needs and financing costs. Demand from Mexico and Puerto Rico supports regional charters. One change shaping the region is owner consolidation, as companies sell or combine fleets to raise cash.
Europe Builds the Floating Storage and Regasification Unit Market Through Energy Security
Europe became a major FSRU market after 2022. Germany chartered several FSRUs for terminals at Wilhelmshaven, Brunsbüttel, and Mukran, and Italy, the Netherlands, Finland, France, and Greece added units, while Poland and Croatia expanded floating import capacity. These units added large regasification capacity in a short time and helped replace Russian pipeline gas. Energy security remains a priority, but falling gas demand has left some units underused. Key barriers include climate policy and high operating costs. One opportunity is keeping FSRUs as backup capacity that can also be redeployed elsewhere if needed.
Which Region Is Leading the Floating Storage and Regasification Unit Market?
Asia Pacific is leading the floating storage and regasification unit market with a 41.0% share in 2026. India, Bangladesh, Pakistan, Indonesia, China, the Philippines, and Vietnam use or are planning FSRUs. South Korea and China build most new FSRUs. Australia is adding terminals at Port Kembla and Victoria to cover east coast gas shortfalls. Gas-to-power projects drive most new demand. Key barriers include high LNG prices for poorer importers. One change shaping the region is new terminals in India and Vietnam, along with larger charters in Bangladesh and the Philippines over the forecast period.
Latin America Grows the Floating Storage and Regasification Unit Market Through Gas-to-Power
Latin America is a significant FSRU market. Brazil has several FSRUs supplying power plants and industry. Colombia, Chile, Argentina, and the Dominican Republic use floating terminals. Demand rises during droughts, when hydropower output falls and gas plants must run more. Brazil links FSRUs to new power plants under long-term contracts. Argentina has also chartered units for winter heating demand, and Chile uses floating storage to back up its northern grid. Key barriers include demand swings and limited pipeline networks. One opportunity is gas-to-power projects in smaller markets such as Panama, Jamaica, and El Salvador.
Which Region Is Growing Fastest in the Floating Storage and Regasification Unit Market?
Middle East & Africa is growing fastest in the floating storage and regasification unit market at an 8.3% CAGR through 2033. Egypt has chartered several FSRUs to meet rising gas demand, including units from Höegh Evi and New Fortress Energy. Morocco, South Africa, Ghana, and Senegal are planning terminals. Kuwait and Jordan use FSRUs. Egypt now relies on several floating terminals to cover summer power demand, which has made it one of the fastest-growing FSRU markets. Key barriers include payment risk and limited financing. One opportunity is gas-to-power in countries with weak grids.
Competitive Landscape
The floating storage and regasification unit market is highly concentrated. Excelerate Energy, Höegh Evi, New Fortress Energy with Energos Infrastructure, BW LNG, Golar LNG, Mitsui O.S.K. Lines, Seapeak, Exmar, and Dynagas own most of the global fleet. Shipyards Samsung Heavy Industries, Hyundai Heavy Industries, and Hanwha Ocean build most new units.
Companies compete on vessel availability, capacity, reliability, charter rates, and project experience. Few vessels are available on short notice, which gives owners with spare units strong pricing power during supply crunches. Long-term charters provide stable revenue, while short-term deals offer higher rates but more risk. Owners also offer LNG supply and power plants together to win contracts from first-time buyers.
Strategic moves show how competition is changing. In May 2025, Höegh Evi signed a 10-year charter with EGAS in Egypt. In July 2025, New Fortress Energy signed a five-year charter for Energos Winter with EGAS. In September 2025, Vopak selected Seapeak for an Australian terminal. In March 2026, India’s Syama Prasad Mookerjee Port signed an FSRU terminal license at Haldia. These moves show competition shifting toward emerging markets.
Three themes shape vendor strategy. First, owners are locking in long charters with state buyers to secure financing. Second, they are converting older carriers to add capacity at lower cost. Third, they are targeting emerging markets in Asia Pacific, Latin America, and Middle East & Africa, where new import demand is growing fastest.
Floating Storage and Regasification Unit Market Industry Leaders
- Excelerate Energy
- Höegh Evi
- New Fortress Energy
- BW LNG
- Mitsui O.S.K. Lines
Recent Industry Developments
- March 2026: Syama Prasad Mookerjee Port in Kolkata signed a license agreement for an FSRU-based LNG terminal at the Haldia Dock Complex - expands India’s LNG import capacity.
- September 2025: Vopak signed an exclusive agreement with Seapeak to provide an FSRU for its Port Phillip Bay terminal in Victoria, Australia - supports gas supply on Australia’s east coast.
- July 2025: New Fortress Energy signed a five-year charter with EGAS for the Energos Winter FSRU at Damietta - adds a second NFE unit in Egypt.
- May 2025: Höegh Evi signed a 10-year charter with EGAS for Hoegh Gandria from 2026 - secures long-term regasification for Egypt.
Companies Covered in the Report
- Excelerate Energy
- Höegh Evi
- New Fortress Energy
- BW LNG
- Mitsui O.S.K. Lines
- Golar LNG
- Seapeak
- Exmar
- Energos Infrastructure
- Dynagas
- Samsung Heavy Industries
- Hanwha Ocean
Floating Storage and Regasification Unit Market Report Scope
This report covers floating storage and regasification units, including FSRU vessels and floating storage units with regasification facilities, built new or converted from LNG carriers, with offshore and jetty mooring, used for LNG imports for power generation, industry, and city gas. It includes charter and service revenues but excludes onshore LNG terminals. The base year is 2025, and the forecast period runs from 2026 to 2033. All values are expressed in US$ Billion.
Type
- FSRU Vessels
- FSU with Regasification Facility
Construction Type
- Newbuild
- Converted
Mooring System
- Offshore-Moored
- Jetty-Moored
Regions
- North America
- Europe
- Asia Pacific
- Latin America
- Middle East & Africa
Key Questions Answered in the Report
How big is the floating storage and regasification unit market in 2026?
The floating storage and regasification unit market is valued at US$ 8.96 billion in 2026, led by FSRU vessels in Asia Pacific.
What is the floating storage and regasification unit market forecast to 2033?
The market is projected to reach US$ 13.92 billion by 2033, growing at a 6.5% CAGR and adding US$ 4.96 billion.
Which construction type is growing fastest in the FSRU market?
Converted FSRUs are growing fastest at an 8.1% CAGR through 2033, driven by cheaper and faster conversion of older LNG carriers.
Which region is growing fastest in the floating storage and regasification unit market?
Middle East & Africa is growing fastest at an 8.3% CAGR through 2033, driven by gas import needs in Egypt and Morocco.
Which region holds the largest floating storage and regasification unit market share?
Asia Pacific holds the largest share at 41.0% in 2026, supported by import demand in India and Bangladesh and shipbuilding in South Korea.
1. Executive Summary
1.1. Global Floating Storage and Regasification Unit Market Snapshot
1.2. Future Projections
1.3. Key Report Takeaways
1.4. Regional Snapshot
2. Market Overview
2.1. Market Definition and Report Scope
2.2. Historical Trends 2020–2025
2.3. Market Dynamics
2.3.1. Drivers
2.3.1.1. Energy Security Is Driving the Floating Storage and Regasification Unit Market
2.3.1.2. Gas-to-Power Demand Is Expanding the Floating Storage and Regasification Unit Market
2.3.2. Restraints
2.3.2.1. LNG Price Volatility Slows the Floating Storage and Regasification Unit Market
2.3.2.2. Energy Transition Restricts the Floating Storage and Regasification Unit Market
2.3.3. Market Opportunities
2.3.3.1. Emerging Market LNG Imports Open a Long-Term Revenue Pool
2.3.3.2. LNG Carrier Conversions Create a Cost-Efficient Revenue Pool
3. Global Floating Storage and Regasification Unit Market Outlook, 2020-2033
3.1. Global Floating Storage and Regasification Unit Market Outlook, by Type, Value (US$ Billion), 2020-2033
3.1.1. FSRU Vessels
3.1.2. FSU with Regasification Facility
3.2. Global Floating Storage and Regasification Unit Market Outlook, by Construction Type, Value (US$ Billion), 2020-2033
3.2.1. Newbuild
3.2.2. Converted
3.3. Global Floating Storage and Regasification Unit Market Outlook, by Mooring System, Value (US$ Billion), 2020-2033
3.3.1. Offshore-Moored
3.3.2. Jetty-Moored
3.4. Global Floating Storage and Regasification Unit Market Outlook, by Region, Value (US$ Billion), 2020-2033
3.4.1. North America
3.4.2. Europe
3.4.3. Asia Pacific
3.4.4. Latin America
3.4.5. Middle East & Africa
4. North America Floating Storage and Regasification Unit Market Outlook, 2020-2033
4.1. North America Floating Storage and Regasification Unit Market Outlook, by Type, Value (US$ Billion), 2020-2033
4.1.1. FSRU Vessels
4.1.2. FSU with Regasification Facility
4.2. North America Floating Storage and Regasification Unit Market Outlook, by Construction Type, Value (US$ Billion), 2020-2033
4.2.1. Newbuild
4.2.2. Converted
4.3. North America Floating Storage and Regasification Unit Market Outlook, by Mooring System, Value (US$ Billion), 2020-2033
4.3.1. Offshore-Moored
4.3.2. Jetty-Moored
4.4. North America Floating Storage and Regasification Unit Market Outlook, by Country, Value (US$ Billion), 2020-2033
4.4.1. United States Floating Storage and Regasification Unit Market Outlook, by Type, 2020-2033
4.4.2. United States Floating Storage and Regasification Unit Market Outlook, by Construction Type, 2020-2033
4.4.3. United States Floating Storage and Regasification Unit Market Outlook, by Mooring System, 2020-2033
4.4.4. Puerto Rico Floating Storage and Regasification Unit Market Outlook, by Type, 2020-2033
4.4.5. Puerto Rico Floating Storage and Regasification Unit Market Outlook, by Construction Type, 2020-2033
4.4.6. Puerto Rico Floating Storage and Regasification Unit Market Outlook, by Mooring System, 2020-2033
4.4.7. Mexico Floating Storage and Regasification Unit Market Outlook, by Type, 2020-2033
4.4.8. Mexico Floating Storage and Regasification Unit Market Outlook, by Construction Type, 2020-2033
4.4.9. Mexico Floating Storage and Regasification Unit Market Outlook, by Mooring System, 2020-2033
5. Europe Floating Storage and Regasification Unit Market Outlook, 2020-2033
5.1. Europe Floating Storage and Regasification Unit Market Outlook, by Type, Value (US$ Billion), 2020-2033
5.1.1. FSRU Vessels
5.1.2. FSU with Regasification Facility
5.2. Europe Floating Storage and Regasification Unit Market Outlook, by Construction Type, Value (US$ Billion), 2020-2033
5.2.1. Newbuild
5.2.2. Converted
5.3. Europe Floating Storage and Regasification Unit Market Outlook, by Mooring System, Value (US$ Billion), 2020-2033
5.3.1. Offshore-Moored
5.3.2. Jetty-Moored
5.4. Europe Floating Storage and Regasification Unit Market Outlook, by Country, Value (US$ Billion), 2020-2033
5.4.1. Germany Floating Storage and Regasification Unit Market Outlook, by Type, 2020-2033
5.4.2. Germany Floating Storage and Regasification Unit Market Outlook, by Construction Type, 2020-2033
5.4.3. Germany Floating Storage and Regasification Unit Market Outlook, by Mooring System, 2020-2033
5.4.4. Italy Floating Storage and Regasification Unit Market Outlook, by Type, 2020-2033
5.4.5. Italy Floating Storage and Regasification Unit Market Outlook, by Construction Type, 2020-2033
5.4.6. Italy Floating Storage and Regasification Unit Market Outlook, by Mooring System, 2020-2033
5.4.7. Netherlands Floating Storage and Regasification Unit Market Outlook, by Type, 2020-2033
5.4.8. Netherlands Floating Storage and Regasification Unit Market Outlook, by Construction Type, 2020-2033
5.4.9. Netherlands Floating Storage and Regasification Unit Market Outlook, by Mooring System, 2020-2033
5.4.10. Finland Floating Storage and Regasification Unit Market Outlook, by Type, 2020-2033
5.4.11. Finland Floating Storage and Regasification Unit Market Outlook, by Construction Type, 2020-2033
5.4.12. Finland Floating Storage and Regasification Unit Market Outlook, by Mooring System, 2020-2033
5.4.13. France Floating Storage and Regasification Unit Market Outlook, by Type, 2020-2033
5.4.14. France Floating Storage and Regasification Unit Market Outlook, by Construction Type, 2020-2033
5.4.15. France Floating Storage and Regasification Unit Market Outlook, by Mooring System, 2020-2033
5.4.16. Greece Floating Storage and Regasification Unit Market Outlook, by Type, 2020-2033
5.4.17. Greece Floating Storage and Regasification Unit Market Outlook, by Construction Type, 2020-2033
5.4.18. Greece Floating Storage and Regasification Unit Market Outlook, by Mooring System, 2020-2033
5.4.19. Poland Floating Storage and Regasification Unit Market Outlook, by Type, 2020-2033
5.4.20. Poland Floating Storage and Regasification Unit Market Outlook, by Construction Type, 2020-2033
5.4.21. Poland Floating Storage and Regasification Unit Market Outlook, by Mooring System, 2020-2033
5.4.22. Croatia Floating Storage and Regasification Unit Market Outlook, by Type, 2020-2033
5.4.23. Croatia Floating Storage and Regasification Unit Market Outlook, by Construction Type, 2020-2033
5.4.24. Croatia Floating Storage and Regasification Unit Market Outlook, by Mooring System, 2020-2033
6. Asia Pacific Floating Storage and Regasification Unit Market Outlook, 2020-2033
6.1. Asia Pacific Floating Storage and Regasification Unit Market Outlook, by Type, Value (US$ Billion), 2020-2033
6.1.1. FSRU Vessels
6.1.2. FSU with Regasification Facility
6.2. Asia Pacific Floating Storage and Regasification Unit Market Outlook, by Construction Type, Value (US$ Billion), 2020-2033
6.2.1. Newbuild
6.2.2. Converted
6.3. Asia Pacific Floating Storage and Regasification Unit Market Outlook, by Mooring System, Value (US$ Billion), 2020-2033
6.3.1. Offshore-Moored
6.3.2. Jetty-Moored
6.4. Asia Pacific Floating Storage and Regasification Unit Market Outlook, by Country, Value (US$ Billion), 2020-2033
6.4.1. India Floating Storage and Regasification Unit Market Outlook, by Type, 2020-2033
6.4.2. India Floating Storage and Regasification Unit Market Outlook, by Construction Type, 2020-2033
6.4.3. India Floating Storage and Regasification Unit Market Outlook, by Mooring System, 2020-2033
6.4.4. Bangladesh Floating Storage and Regasification Unit Market Outlook, by Type, 2020-2033
6.4.5. Bangladesh Floating Storage and Regasification Unit Market Outlook, by Construction Type, 2020-2033
6.4.6. Bangladesh Floating Storage and Regasification Unit Market Outlook, by Mooring System, 2020-2033
6.4.7. Pakistan Floating Storage and Regasification Unit Market Outlook, by Type, 2020-2033
6.4.8. Pakistan Floating Storage and Regasification Unit Market Outlook, by Construction Type, 2020-2033
6.4.9. Pakistan Floating Storage and Regasification Unit Market Outlook, by Mooring System, 2020-2033
6.4.10. Indonesia Floating Storage and Regasification Unit Market Outlook, by Type, 2020-2033
6.4.11. Indonesia Floating Storage and Regasification Unit Market Outlook, by Construction Type, 2020-2033
6.4.12. Indonesia Floating Storage and Regasification Unit Market Outlook, by Mooring System, 2020-2033
6.4.13. China Floating Storage and Regasification Unit Market Outlook, by Type, 2020-2033
6.4.14. China Floating Storage and Regasification Unit Market Outlook, by Construction Type, 2020-2033
6.4.15. China Floating Storage and Regasification Unit Market Outlook, by Mooring System, 2020-2033
6.4.16. Philippines Floating Storage and Regasification Unit Market Outlook, by Type, 2020-2033
6.4.17. Philippines Floating Storage and Regasification Unit Market Outlook, by Construction Type, 2020-2033
6.4.18. Philippines Floating Storage and Regasification Unit Market Outlook, by Mooring System, 2020-2033
6.4.19. Vietnam Floating Storage and Regasification Unit Market Outlook, by Type, 2020-2033
6.4.20. Vietnam Floating Storage and Regasification Unit Market Outlook, by Construction Type, 2020-2033
6.4.21. Vietnam Floating Storage and Regasification Unit Market Outlook, by Mooring System, 2020-2033
6.4.22. South Korea Floating Storage and Regasification Unit Market Outlook, by Type, 2020-2033
6.4.23. South Korea Floating Storage and Regasification Unit Market Outlook, by Construction Type, 2020-2033
6.4.24. South Korea Floating Storage and Regasification Unit Market Outlook, by Mooring System, 2020-2033
6.4.25. Australia Floating Storage and Regasification Unit Market Outlook, by Type, 2020-2033
6.4.26. Australia Floating Storage and Regasification Unit Market Outlook, by Construction Type, 2020-2033
6.4.27. Australia Floating Storage and Regasification Unit Market Outlook, by Mooring System, 2020-2033
7. Latin America Floating Storage and Regasification Unit Market Outlook, 2020-2033
7.1. Latin America Floating Storage and Regasification Unit Market Outlook, by Type, Value (US$ Billion), 2020-2033
7.1.1. FSRU Vessels
7.1.2. FSU with Regasification Facility
7.2. Latin America Floating Storage and Regasification Unit Market Outlook, by Construction Type, Value (US$ Billion), 2020-2033
7.2.1. Newbuild
7.2.2. Converted
7.3. Latin America Floating Storage and Regasification Unit Market Outlook, by Mooring System, Value (US$ Billion), 2020-2033
7.3.1. Offshore-Moored
7.3.2. Jetty-Moored
7.4. Latin America Floating Storage and Regasification Unit Market Outlook, by Country, Value (US$ Billion), 2020-2033
7.4.1. Brazil Floating Storage and Regasification Unit Market Outlook, by Type, 2020-2033
7.4.2. Brazil Floating Storage and Regasification Unit Market Outlook, by Construction Type, 2020-2033
7.4.3. Brazil Floating Storage and Regasification Unit Market Outlook, by Mooring System, 2020-2033
7.4.4. Colombia Floating Storage and Regasification Unit Market Outlook, by Type, 2020-2033
7.4.5. Colombia Floating Storage and Regasification Unit Market Outlook, by Construction Type, 2020-2033
7.4.6. Colombia Floating Storage and Regasification Unit Market Outlook, by Mooring System, 2020-2033
7.4.7. Chile Floating Storage and Regasification Unit Market Outlook, by Type, 2020-2033
7.4.8. Chile Floating Storage and Regasification Unit Market Outlook, by Construction Type, 2020-2033
7.4.9. Chile Floating Storage and Regasification Unit Market Outlook, by Mooring System, 2020-2033
7.4.10. Argentina Floating Storage and Regasification Unit Market Outlook, by Type, 2020-2033
7.4.11. Argentina Floating Storage and Regasification Unit Market Outlook, by Construction Type, 2020-2033
7.4.12. Argentina Floating Storage and Regasification Unit Market Outlook, by Mooring System, 2020-2033
7.4.13. Dominican Republic Floating Storage and Regasification Unit Market Outlook, by Type, 2020-2033
7.4.14. Dominican Republic Floating Storage and Regasification Unit Market Outlook, by Construction Type, 2020-2033
7.4.15. Dominican Republic Floating Storage and Regasification Unit Market Outlook, by Mooring System, 2020-2033
7.4.16. Panama Floating Storage and Regasification Unit Market Outlook, by Type, 2020-2033
7.4.17. Panama Floating Storage and Regasification Unit Market Outlook, by Construction Type, 2020-2033
7.4.18. Panama Floating Storage and Regasification Unit Market Outlook, by Mooring System, 2020-2033
7.4.19. Jamaica Floating Storage and Regasification Unit Market Outlook, by Type, 2020-2033
7.4.20. Jamaica Floating Storage and Regasification Unit Market Outlook, by Construction Type, 2020-2033
7.4.21. Jamaica Floating Storage and Regasification Unit Market Outlook, by Mooring System, 2020-2033
7.4.22. El Salvador Floating Storage and Regasification Unit Market Outlook, by Type, 2020-2033
7.4.23. El Salvador Floating Storage and Regasification Unit Market Outlook, by Construction Type, 2020-2033
7.4.24. El Salvador Floating Storage and Regasification Unit Market Outlook, by Mooring System, 2020-2033
8. Middle East & Africa Floating Storage and Regasification Unit Market Outlook, 2020-2033
8.1. Middle East & Africa Floating Storage and Regasification Unit Market Outlook, by Type, Value (US$ Billion), 2020-2033
8.1.1. FSRU Vessels
8.1.2. FSU with Regasification Facility
8.2. Middle East & Africa Floating Storage and Regasification Unit Market Outlook, by Construction Type, Value (US$ Billion), 2020-2033
8.2.1. Newbuild
8.2.2. Converted
8.3. Middle East & Africa Floating Storage and Regasification Unit Market Outlook, by Mooring System, Value (US$ Billion), 2020-2033
8.3.1. Offshore-Moored
8.3.2. Jetty-Moored
8.4. Middle East & Africa Floating Storage and Regasification Unit Market Outlook, by Country, Value (US$ Billion), 2020-2033
8.4.1. Egypt Floating Storage and Regasification Unit Market Outlook, by Type, 2020-2033
8.4.2. Egypt Floating Storage and Regasification Unit Market Outlook, by Construction Type, 2020-2033
8.4.3. Egypt Floating Storage and Regasification Unit Market Outlook, by Mooring System, 2020-2033
8.4.4. Morocco Floating Storage and Regasification Unit Market Outlook, by Type, 2020-2033
8.4.5. Morocco Floating Storage and Regasification Unit Market Outlook, by Construction Type, 2020-2033
8.4.6. Morocco Floating Storage and Regasification Unit Market Outlook, by Mooring System, 2020-2033
8.4.7. South Africa Floating Storage and Regasification Unit Market Outlook, by Type, 2020-2033
8.4.8. South Africa Floating Storage and Regasification Unit Market Outlook, by Construction Type, 2020-2033
8.4.9. South Africa Floating Storage and Regasification Unit Market Outlook, by Mooring System, 2020-2033
8.4.10. Ghana Floating Storage and Regasification Unit Market Outlook, by Type, 2020-2033
8.4.11. Ghana Floating Storage and Regasification Unit Market Outlook, by Construction Type, 2020-2033
8.4.12. Ghana Floating Storage and Regasification Unit Market Outlook, by Mooring System, 2020-2033
8.4.13. Senegal Floating Storage and Regasification Unit Market Outlook, by Type, 2020-2033
8.4.14. Senegal Floating Storage and Regasification Unit Market Outlook, by Construction Type, 2020-2033
8.4.15. Senegal Floating Storage and Regasification Unit Market Outlook, by Mooring System, 2020-2033
8.4.16. Kuwait Floating Storage and Regasification Unit Market Outlook, by Type, 2020-2033
8.4.17. Kuwait Floating Storage and Regasification Unit Market Outlook, by Construction Type, 2020-2033
8.4.18. Kuwait Floating Storage and Regasification Unit Market Outlook, by Mooring System, 2020-2033
8.4.19. Jordan Floating Storage and Regasification Unit Market Outlook, by Type, 2020-2033
8.4.20. Jordan Floating Storage and Regasification Unit Market Outlook, by Construction Type, 2020-2033
8.4.21. Jordan Floating Storage and Regasification Unit Market Outlook, by Mooring System, 2020-2033
9. Competitive Landscape
9.1. Market Concentration and Industry Leaders
9.2. Competitive Differentiation
9.3. Strategic Moves and Market Direction
9.4. Recent Industry Developments
9.5. Company Profiles
9.5.1. Excelerate Energy
9.5.2. Höegh Evi
9.5.3. New Fortress Energy
9.5.4. BW LNG
9.5.5. Mitsui O.S.K. Lines
9.5.6. Golar LNG
9.5.7. Seapeak
9.5.8. Exmar
9.5.9. Energos Infrastructure
9.5.10. Dynagas
9.5.11. Samsung Heavy Industries
9.5.12. Hanwha Ocean
10. Appendix
10.1. Research Methodology
10.2. Report Assumptions
10.3. Acronyms and Abbreviations
| Type | FSRU Vessels, FSU with Regasification Facility |
| Construction Type | Newbuild, Converted |
| Mooring System | Offshore-Moored, Jetty-Moored |
| Regions | North America, Europe, Asia Pacific, Latin America, Middle East & Africa |
Our Research Methodology
Considering the volatility of business today, traditional approaches to strategizing a game plan can be unfruitful if not detrimental. True ambiguity is no way to determine a forecast. A myriad of predetermined factors must be accounted for such as the degree of risk involved, the magnitude of circumstances, as well as conditions or consequences that are not known or unpredictable. To circumvent binary views that cast uncertainty, the application of market research intelligence to strategically posture, move, and enable actionable outcomes is necessary.
View Methodology
Quality Assured
Rigorous Validation Process

Confidentiality Assured
End-to-end Data Security

Custom Research Services
Tailored To Your Objectives
FAQs
The floating storage and regasification unit market is valued at US$ 8.96 billion in 2026, led by FSRU vessels in Asia Pacific.
The market is projected to reach US$ 13.92 billion by 2033, growing at a 6.5% CAGR and adding US$ 4.96 billion.
Converted FSRUs are growing fastest at an 8.1% CAGR through 2033, driven by cheaper and faster conversion of older LNG carriers.
Middle East & Africa is growing fastest at an 8.3% CAGR through 2033, driven by gas import needs in Egypt and Morocco.
Asia Pacific holds the largest share at 41.0% in 2026, supported by import demand in India and Bangladesh and shipbuilding in South Korea.
Related Reports
Floating Solar Market Size, Share, Insights, Competitive Landscape, and Forecast 2026 to 2033
Floating solar market to grow from US$1.60 Bn in 2026 to US$4.02 Bn by 2033 at 14.1% CAGR. Explore capacities, products, locations and regional trends.
Offshore Grid Connection Solutions Market Size, Share, Insights, Competitive Landscape, and Forecast 2026 to 2033
Offshore grid connection solutions market to reach US$ 5.71 billion by 2033 at a 6.7% CAGR. Explore HVDC, subsea cables, applications and regional trends.
Nickel Hydrogen Batteries Market Size, Share, Insights, Competitive Landscape, and Forecast 2026 to 2033
Nickel hydrogen batteries market to reach US$11.85 billion by 2033 at 13.7% CAGR, driven by hybrid vehicles and stationary energy storage.
Landing String Equipment Market Size, Share, Insights, Competitive Landscape, and Forecast 2026 to 2033
Explore the landing string equipment market, reaching US$ 0.80 billion by 2033 at 6.6% CAGR, with component, technology and regional insights.
Fuel Cell Market Size, Share, Insights, Competitive Landscape, and Forecast 2026 to 2033
Fuel cell market to reach US$ 21.6 billion by 2033 at 17.0% CAGR. Explore technologies, applications, regions and key companies.
Solid-state Battery Market Size, Share, Insights, Competitive Landscape, and Forecast 2026 to 2033
Solid-state battery market to reach US$ 11.7 billion by 2033 at 36.9% CAGR. Explore technologies, applications, regions and key companies.