



Port Electrification Market
Port Electrification Market Size, Share, Insights, Competitive Landscape, and Forecast 2026 to 2033
Port Electrification Market Size, Share, Insights, Competitive Landscape, and Forecast 2026 to 2033
What Is Driving Port Electrification Market Growth?
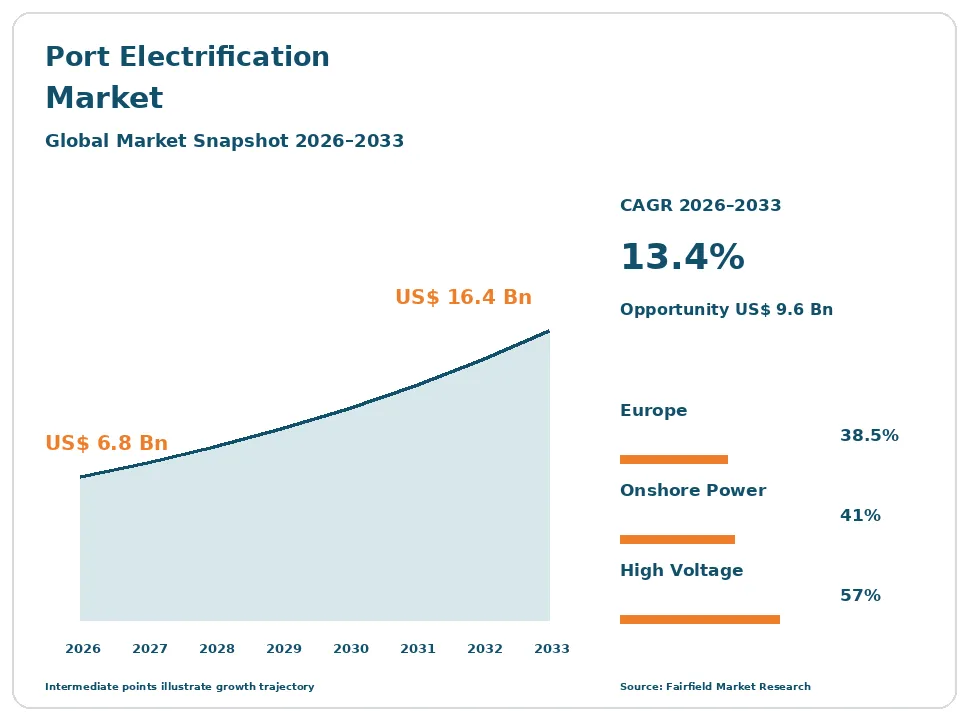
The global Port Electrification market size is expected to be valued at US$ 6.8 billion in 2026 and projected to reach US$ 16.4 billion by 2033, growing at a CAGR of 13.4% between 2026 and 2033.
Between 2020 and 2025 the market grew at roughly a 10.5% CAGR, built mainly on voluntary cold ironing projects and early crane electrification. The outlook changes because spending is no longer discretionary. Regulation now obliges many ports to provide shore-side electricity and obliges many vessels to use it at berth from a stated date, so capital plans follow a compliance deadline rather than a payback calculation. That is unusual in heavy infrastructure and it compresses a decade of work into a few budget cycles. Cargo handling equipment electrification, grid reinforcement and port energy management services add the second layer of growth through 2033.
Key Report Takeaways
- By Solution: Onshore power supply systems held 41.0% share in 2026, while electric and hybrid cargo handling equipment is projected to expand at a 15.8% CAGR through 2033, because diesel replacement in yard machinery delivers a genuine operating payback.
- By Port Type: Container terminals held 48.5% share in 2026, while roll-on roll-off and vehicle terminals are projected to expand at a 15.4% CAGR through 2033, as vessel categories subject to at-berth rules widen beyond boxships.
- By Connection Type: High voltage shore connection held 57.0% share in 2026, while mobile and barge-based power supply is projected to expand at a 16.4% CAGR through 2033, serving berths that cannot obtain a fixed grid connection in time.
- By End User: Port authorities held 44.0% share in 2026, while energy utilities and independent power providers are projected to expand at a 16.8% CAGR through 2033, as ports outsource generation, storage and peak management.
- By Geography: Europe held 38.5% share in 2026, while Asia Pacific is projected to expand at a 15.9% CAGR through 2033, driven by new terminal construction and provincial air quality rules.
Global Port Electrification Market Trends and Insights
Drivers Impact Analysis
| Driver | Impact on CAGR Forecast | Geographic Relevance | Impact Timeline |
| Shore power mandates with fixed compliance dates | High | Europe, North America | Medium term (2–4 years) |
| Local air quality rules in port cities | Medium | Global, strongest in Asia Pacific | Long term (≥4 years) |
Two forces account for most committed port electrification spending through the forecast period.
Fixed Compliance Dates for Shore Power Convert Port Electrification into Non-Discretionary Capital Spending
Ports are electrifying mainly because the law requires it by a date, not because the numbers work. The European Union Alternative Fuels Infrastructure Regulation, Regulation (EU) 2023/1804, requires shore-side electricity supply at maritime ports on the trans-European network, and FuelEU Maritime requires containerships and passenger ships to connect at berth from the start of 2030. That reverses the normal logic of infrastructure investment, because the decision is a deadline, not a business case.
The mechanism matters for suppliers. Once a date is fixed, procurement moves from feasibility studies to tendering, and the binding question becomes delivery lead time rather than return on capital. Port authorities must specify systems compliant with the IEC/IEEE 80005 series, order frequency converters and cable management, and secure a grid connection. Each of those has a multi-year lead time, which pulls orders forward well ahead of the compliance date.
Local Air Quality Regulation in Port Cities Expands Electrification Beyond the Quayside
Air quality rules in port cities push electrification into the terminal yard, not just the berth. Communities next to ports carry a measurable burden of nitrogen oxides and particulates from auxiliary engines, yard tractors and diesel cranes. Where regulators act on that burden, terminal operators face emission limits and equipment replacement schedules that cover the whole site, widening the addressable market well beyond cold ironing hardware.
The California Air Resources Board At-Berth Regulation is the clearest example, applying phased requirements by vessel category and holding operators accountable for emissions control at the berth. Similar pressure appears in European port cities and in Chinese coastal provinces with emission control requirements. Because yard equipment turns over every eight to twelve years, each replacement cycle becomes a decision point, and an electric rubber-tyred gantry or terminal tractor is often the compliant option.
Restraints Impact Analysis
| Restraint | Impact on CAGR Forecast | Geographic Relevance | Impact Timeline |
| Grid connection capacity and substation lead times | High | Europe, North America | Short term (≤2 years) |
| Electricity pricing and taxation against bunker fuel | Medium | Global | Medium term (2–4 years) |
Two constraints determine how much of the mandated work can actually be delivered on time.
Grid Capacity Is the Binding Constraint on Port Electrification Delivery
Grid capacity, not money or technology, decides how fast ports can electrify. A single large container ship at berth draws power comparable to a small town, and a terminal serving several berths simultaneously needs a connection on the scale of an industrial estate. Many ports simply cannot obtain that capacity within the time the compliance date allows, which caps deliverable volume regardless of budget approval.
The cause lies upstream. Distribution and transmission operators run multi-year connection queues, transformer and high-voltage switchgear lead times have lengthened, and new substations require land, consents and cable routes through dense urban areas. Ports sit at the end of radial networks that were never designed for this load. Peak demand is also spiky, since vessels connect and disconnect, which forces network operators to size assets for a load factor that looks uneconomic on paper.
Electricity Taxation and Berth Economics Undermine the Case for Shore Power Use
Shore power can cost a vessel more than burning fuel at berth, which blunts the regulation it is meant to serve. Electricity delivered at a quay carries energy taxes, network charges and capacity fees that marine fuel does not, while bunker fuel is untaxed in international shipping. Where that gap persists, operators connect only when compelled, utilisation of installed systems stays low, and the investment case for the next berth weakens.
The underlying causes are fiscal and structural. Energy tax exemptions for shore-side electricity exist in some jurisdictions but not all, and demand charges penalise the short, high-magnitude draws that vessel connection creates. The chicken-and-egg problem compounds this: port authorities hesitate to build until enough vessels are retrofitted, and shipowners hesitate to retrofit until enough berths are equipped. Neither side captures the emissions benefit that justifies the spending.
Market Opportunities
Cargo Handling Equipment Electrification Opens the One Port Electrification Pool With Real Payback
Yard equipment is where port electrification earns money rather than merely complies. Electric rubber-tyred gantry cranes, straddle carriers, reach stackers, terminal tractors and automated guided vehicles replace diesel consumption with electricity at a lower cost per move, and they cut maintenance on engines, filters and hydraulics. Unlike cold ironing, this pool has a commercial case that terminal operators will fund from their own budgets.
Terminal operators are the buyers, and container and bulk terminals with high move counts create the demand. The supporting development is battery and charging maturity: opportunity charging at the stack, battery swapping for tractors, and cable reel or busbar supply for gantries now handle full shift duty. Depot-scale charging infrastructure, fleet energy management software and ship-to-shore crane electrification packages all attach to the same procurement, widening the revenue per site for equipment suppliers.
Port Microgrids and Storage Create a Services Revenue Pool Around Peak Demand Charges
Port microgrids turn an electrification problem into a recurring services business. Batteries, local solar generation and controllable loads let a terminal shave the demand peaks created by vessel connection and crane hoisting, reducing capacity charges and deferring a costly grid upgrade. That converts a one-off hardware sale into long-term energy management contracts, performance guarantees and operations services.
Energy utilities, independent power providers and integration contractors are positioned to capture this, and the demand comes from ports facing connection queues that cannot be shortened. Storage can supply a berth for a few hours while the grid connection recharges it between calls, which makes a smaller connection workable. The European Union Emissions Trading System extension to maritime transport reinforces the case, because it gives at-berth emissions a direct financial cost that energy management can measurably reduce.
Segment Analysis
By Solution: Onshore Power Supply Leads While Electric Cargo Handling Equipment Advances Faster
Onshore power supply systems held 41.0% of the port electrification market in 2026, because they are the element regulation explicitly requires. The scope covers shoreside connection equipment, frequency converters that bridge grid and vessel frequencies, cable management systems and vessel-side retrofit packages, all built to the IEC/IEEE 80005 series. Electric and hybrid cargo handling equipment grows fastest at a 15.8% CAGR to 2033, because it saves money rather than merely satisfying a rule. Charging infrastructure and battery systems attach directly to that equipment, while grid reinforcement, substations, microgrids and storage form the enabling layer beneath both. Engineering, integration and energy management services wrap the whole package and are increasingly sold on multi-year terms. Vessel propulsion systems and the ships themselves fall outside this scope. The implication is that suppliers who can deliver both compliance hardware and payback equipment hold the strongest position.
By Port Type: Container Terminals Dominate While Vehicle Terminals Electrify Quickest
Container terminals held 48.5% share in 2026, because they combine the largest at-berth power demand with the densest yard equipment fleets. A boxship hotel load is among the highest of any vessel class, and container operations run continuous crane and tractor cycles that reward electrification twice over. Roll-on roll-off and vehicle terminals are the fastest-growing port type at a 15.4% CAGR, as at-berth requirements widen to vessel categories beyond containerships and passenger ships, and as car carriers call at a predictable set of berths that justify fixed infrastructure. Cruise and passenger terminals remain an early adopter group because their hotel loads are large and their city-centre berths attract the most public scrutiny. Bulk and general cargo terminals lag, since calls are less frequent and equipment is more varied. Investment therefore concentrates where vessel calls are regular and predictable.
By Connection Type: High Voltage Connections Lead as Mobile and Barge Supply Grows Fastest
High voltage shore connection held 57.0% share in 2026, because the power levels required by container, cruise and tanker vessels exceed what low voltage systems can practically deliver. The IEC/IEEE 80005-1 high-voltage specification governs these installations and has become the default reference in tender documents. Low voltage connection remains relevant for smaller craft, fishing vessels, tugs and inland barges, covered by the low-voltage part of the same standard series. Mobile and barge-based power supply is the fastest-growing connection type at a 16.4% CAGR, because it sidesteps the grid problem: a containerised or floating power unit can serve a berth where a fixed connection cannot be built within the compliance window. That flexibility carries higher operating cost, so it functions as a bridge rather than a destination for most ports.
By End User: Port Authorities Carry the Spending While Utilities Expand Their Role Fastest
Port authorities held 44.0% share of port electrification spending in 2026, because they own the quay, the land and usually the grid connection point, and because compliance obligations land on them. Terminal operators follow, funding yard equipment and charging infrastructure where the operating saving is theirs to keep. Energy utilities and independent power providers are the fastest-growing end user group at a 16.8% CAGR, as ports shift from owning energy assets to buying energy as a service, transferring capital cost and performance risk. Shipping lines contribute mainly through vessel-side retrofit and through long-term berth agreements that underwrite shoreside investment. The structural tension is that the authority paying for cold ironing does not capture the emissions benefit, which pushes more projects toward concession, grant and utility-funded structures rather than direct capital budgets.
Geography Analysis
North America Pairs Air Quality Enforcement With Slow Grid Connection
North America held 21.0% of the port electrification market in 2026, led by the United States and Canada. The region’s distinguishing feature is that electrification was driven first by local air quality enforcement rather than climate policy, with the California Air Resources Board At-Berth Regulation setting phased requirements by vessel category. Major container and cruise gateways on the west coast are the most advanced, while gulf and east coast ports move more slowly. Federal and state grant programmes have funded a meaningful share of equipment purchases, which makes order timing sensitive to funding cycles. The binding constraint is interconnection: utility connection queues and transformer lead times routinely exceed project schedules. The clearest opportunity is drayage and yard tractor electrification, where depot charging can be built behind an existing meter.
Which Region Is Leading the Port Electrification Market?
Europe leads the port electrification market with 38.5% share in 2026, because its regulation is the most specific and the most dated. The Alternative Fuels Infrastructure Regulation, Regulation (EU) 2023/1804, requires shore-side electricity provision at trans-European network maritime ports, and FuelEU Maritime obliges containerships and passenger ships to use onshore power at berth from the start of 2030. The European Union Emissions Trading System extension to maritime transport adds a direct cost to at-berth emissions, strengthening the business case. Germany, the Netherlands, Belgium, Spain, Italy, France and Norway account for most activity, with Norway the long-standing pioneer in shore connection. The main difficulty is grid reinforcement in dense urban port estates, where cable routes and substation sites are genuinely scarce.
Which Region Is Growing Fastest in the Port Electrification Market?
Asia Pacific is growing fastest in the port electrification market, at a 15.9% CAGR from 2026 to 2033, on a 29.0% share base. China is the principal driver, combining the world’s largest container throughput with coastal emission control requirements and a long-running programme of shore power installation at major berths. New terminal construction gives the region an advantage, because electrification designed into a greenfield terminal costs far less than retrofitting a working quay. Singapore, Japan, Korea, India and Australia add automated terminal projects, electric yard equipment fleets and grid upgrades. Domestic manufacturing of cranes, converters and switchgear lowers delivered cost relative to other regions. The constraint is uneven utilisation, since installed shore power is only valuable when calling vessels are equipped to connect and willing to pay the tariff.
Latin America Advances Port Electrification Through Concession Commitments
Latin America represented 4.5% of the market in 2026, with Brazil, Chile, Panama, Mexico and Colombia the main contributors. Progress here runs through terminal concession agreements rather than national mandates, since environmental and equipment commitments are written into contracts with port authorities when concessions are awarded or renewed. Cruise berths and container terminals serving export trades are the first candidates. Barriers are substantial: electricity tariffs are high in several countries, grid reliability varies, capital is expensive, and there is no regional at-berth obligation to force the pace. Equipment maintenance skills for electric and hybrid machinery are also scarce outside the largest terminals. The main opportunity is hybrid and electric yard equipment, which can be financed on fuel savings alone without waiting for shoreside power.
Middle East & Africa Builds Electrification Into New Terminal Capacity
Middle East & Africa accounted for 7.0% of port electrification spending in 2026, concentrated in the United Arab Emirates, Saudi Arabia, Oman, Egypt, Morocco and South Africa. The regional pattern is favourable, because heavy new terminal construction allows electrical infrastructure to be designed in from the start rather than retrofitted. Gulf states are also pairing port projects with large renewable generation programmes, which gives electrified terminals a credible low-carbon supply. Barriers include limited grid headroom outside the main industrial zones, high ambient temperatures that derate equipment, and a shortage of specialist commissioning and maintenance capability. Transhipment hubs face the additional problem that vessel dwell is short, reducing the time available to connect. Automated and electric container handling in greenfield terminals is the strongest regional opportunity.
Competitive Landscape
The port electrification market is moderately concentrated and splits into two distinct supplier groups that rarely compete directly. Electrical infrastructure is dominated by large power technology companies with the switchgear, frequency converter and substation portfolios that shore connection demands. Cargo handling equipment is supplied by a separate set of crane and terminal machinery manufacturers. A third group of specialists supplies cable management, plug and socket systems, and shore connection packages. Consolidation has been limited, but partnerships between power technology firms and crane builders are now common because a terminal tender increasingly asks for one integrated answer.
Competition turns on proven compliance with the IEC/IEEE 80005 series, delivery lead time, grid integration capability and lifecycle service coverage. Lead time has become decisive: with compliance dates fixed, a supplier who can deliver converters and switchgear inside the schedule wins work from one who quotes a lower price later. Terminal operators also weigh interoperability, because a berth must serve vessels from many owners with varying connection arrangements. New approaches are entering from outside the traditional supplier base, including containerised and barge-mounted power units, battery storage integrators and energy-as-a-service providers who finance the asset and sell power.
Strategic activity concentrates on building integration capability rather than component share. Suppliers are assembling portfolios that cover the shore connection, the substation, the storage system and the energy management layer, because port authorities prefer a single accountable contractor for a compliance-critical project. Crane manufacturers have broadened electric and hybrid ranges across gantries, straddle carriers and tractors, and have added charging and fleet management as attached offerings. Service and software revenue is becoming a larger share of lifetime contract value.
Strategic direction is set by three themes: delivering against fixed regulatory deadlines, solving the grid constraint with storage and flexible supply, and moving from equipment sales toward long-term energy service contracts.
Port Electrification Industry Leaders
- ABB Ltd.
- Siemens AG
- Cavotec SA
- Konecranes Plc
- Wärtsilä Corporation
Recent Industry Developments
- April 2024: The European Union Alternative Fuels Infrastructure Regulation, Regulation (EU) 2023/1804, became applicable, setting shore-side electricity provision requirements at trans-European network maritime ports – it converted shore power from a voluntary project into a dated obligation for port authorities.
- January 2025: FuelEU Maritime entered application, with its requirement for containerships and passenger ships to use onshore power supply at berth taking effect from the start of 2030 – it gives shipowners a firm date to plan vessel-side retrofit against.
- January 2024: The European Union Emissions Trading System was extended to maritime transport, with shipping companies surrendering allowances for a phased share of verified emissions – it places a direct price on at-berth emissions and improves shore power economics.
- January 2025: The California Air Resources Board At-Berth Regulation extended to further vessel categories, including roll-on roll-off vehicle carriers – it widens the terminal types that must install or arrange emissions control at the berth.
Companies Covered in the Report
- ABB Ltd.
- Siemens AG
- Schneider Electric SE
- Hitachi Energy Ltd.
- Cavotec SA
- Wärtsilä Corporation
- Konecranes Plc
- Kalmar Corporation
- Liebherr Group
- Shanghai Zhenhua Heavy Industries Co., Ltd.
- PowerCon A/S
- Danfoss A/S
- Royal Terberg Group
Port Electrification Market Report Scope
This report covers equipment, infrastructure and services that replace fossil-fuelled energy at ports with electricity: onshore power supply, electric and hybrid cargo handling equipment, charging and battery systems, grid reinforcement, substations, microgrids, storage, and the engineering and energy management services around them. Vessel propulsion systems and the ships themselves are not counted. The base year is 2025 and the forecast period runs from 2026 to 2033, in US$ Billion.
Solution
- Onshore Power Supply Systems
- Electric and Hybrid Cargo Handling Equipment
- Charging Infrastructure and Battery Systems
- Grid Reinforcement, Substations and Energy Storage
- Engineering, Integration and Energy Management Services
Port Type
- Container Terminals
- Cruise and Passenger Terminals
- Bulk and General Cargo Terminals
- Roll-On Roll-Off and Vehicle Terminals
Connection Type
- High Voltage Shore Connection
- Low Voltage Shore Connection
- Mobile and Barge-Based Power Supply
End User
- Port Authorities
- Terminal Operators
- Shipping Lines
- Energy Utilities and Independent Power Providers
Regions
- North America
- Europe
- Asia Pacific
- Latin America
- Middle East & Africa
Key Questions Answered in the Report
How big is the port electrification market in 2026?
The port electrification market is valued at US$ 6.8 billion in 2026, covering shore power, electric cargo handling equipment, grid infrastructure and related services.
What is the port electrification forecast through 2033?
The market is projected to reach US$ 16.4 billion by 2033, growing at a 13.4% CAGR and adding US$ 9.6 billion in value.
Which port electrification solution holds the largest share?
Onshore power supply systems lead with 41.0% share in 2026, because regulation specifically requires shore-side electricity provision at many berths.
Which port electrification segment is growing fastest?
Electric and hybrid cargo handling equipment grows fastest at a 15.8% CAGR, because replacing diesel yard machinery delivers a real operating saving.
Which region leads the port electrification market?
Europe leads with 38.5% share in 2026, because its shore power obligations carry the most specific requirements and the firmest compliance dates.
1. Executive Summary
1.1. Global Port Electrification Market Snapshot
1.2. Future Projections, 2026-2033
1.3. Key Market Trends
1.4. Regional Snapshot
2. Market Overview
2.1. Market Definition and Report Scope
2.2. Historical Market Trends, 2020-2025
2.3. Market Dynamics
2.3.1. Drivers Impact Analysis
2.3.1.1. Fixed Compliance Dates for Shore Power Convert Port Electrification into Non-Discretionary Capital Spending
2.3.1.2. Local Air Quality Regulation in Port Cities Expands Electrification Beyond the Quayside
2.3.2. Restraints Impact Analysis
2.3.2.1. Grid Capacity Is the Binding Constraint on Port Electrification Delivery
2.3.2.2. Electricity Taxation and Berth Economics Undermine the Case for Shore Power Use
2.3.3. Market Opportunities
2.3.3.1. Cargo Handling Equipment Electrification Opens the One Port Electrification Pool With Real Payback
2.3.3.2. Port Microgrids and Storage Create a Services Revenue Pool Around Peak Demand Charges
3. Global Port Electrification Market Outlook, 2020-2033
3.1. Global Port Electrification Market Outlook, by Solution, Value (US$ Billion), 2020-2033
3.1.1. Onshore Power Supply Systems
3.1.2. Electric and Hybrid Cargo Handling Equipment
3.1.3. Charging Infrastructure and Battery Systems
3.1.4. Grid Reinforcement, Substations and Energy Storage
3.1.5. Engineering, Integration and Energy Management Services
3.2. Global Port Electrification Market Outlook, by Port Type, Value (US$ Billion), 2020-2033
3.2.1. Container Terminals
3.2.2. Cruise and Passenger Terminals
3.2.3. Bulk and General Cargo Terminals
3.2.4. Roll-On Roll-Off and Vehicle Terminals
3.3. Global Port Electrification Market Outlook, by Connection Type, Value (US$ Billion), 2020-2033
3.3.1. High Voltage Shore Connection
3.3.2. Low Voltage Shore Connection
3.3.3. Mobile and Barge-Based Power Supply
3.4. Global Port Electrification Market Outlook, by End User, Value (US$ Billion), 2020-2033
3.4.1. Port Authorities
3.4.2. Terminal Operators
3.4.3. Shipping Lines
3.4.4. Energy Utilities and Independent Power Providers
3.5. Global Port Electrification Market Outlook, by Region, Value (US$ Billion), 2020-2033
3.5.1. North America
3.5.2. Europe
3.5.3. Asia Pacific
3.5.4. Latin America
3.5.5. Middle East & Africa
4. North America Port Electrification Market Outlook, 2020-2033
4.1. North America Port Electrification Market Outlook, by Solution, Value (US$ Billion), 2020-2033
4.1.1. Onshore Power Supply Systems
4.1.2. Electric and Hybrid Cargo Handling Equipment
4.1.3. Charging Infrastructure and Battery Systems
4.1.4. Grid Reinforcement, Substations and Energy Storage
4.1.5. Engineering, Integration and Energy Management Services
4.2. North America Port Electrification Market Outlook, by Port Type, Value (US$ Billion), 2020-2033
4.2.1. Container Terminals
4.2.2. Cruise and Passenger Terminals
4.2.3. Bulk and General Cargo Terminals
4.2.4. Roll-On Roll-Off and Vehicle Terminals
4.3. North America Port Electrification Market Outlook, by Connection Type, Value (US$ Billion), 2020-2033
4.3.1. High Voltage Shore Connection
4.3.2. Low Voltage Shore Connection
4.3.3. Mobile and Barge-Based Power Supply
4.4. North America Port Electrification Market Outlook, by End User, Value (US$ Billion), 2020-2033
4.4.1. Port Authorities
4.4.2. Terminal Operators
4.4.3. Shipping Lines
4.4.4. Energy Utilities and Independent Power Providers
4.5. North America Port Electrification Market Outlook, by Country, Value (US$ Billion), 2020-2033
4.5.1. United States Port Electrification Market Outlook, by Solution, 2020-2033
4.5.2. United States Port Electrification Market Outlook, by Port Type, 2020-2033
4.5.3. United States Port Electrification Market Outlook, by Connection Type, 2020-2033
4.5.4. United States Port Electrification Market Outlook, by End User, 2020-2033
4.5.5. Canada Port Electrification Market Outlook, by Solution, 2020-2033
4.5.6. Canada Port Electrification Market Outlook, by Port Type, 2020-2033
4.5.7. Canada Port Electrification Market Outlook, by Connection Type, 2020-2033
4.5.8. Canada Port Electrification Market Outlook, by End User, 2020-2033
5. Europe Port Electrification Market Outlook, 2020-2033
5.1. Europe Port Electrification Market Outlook, by Solution, Value (US$ Billion), 2020-2033
5.1.1. Onshore Power Supply Systems
5.1.2. Electric and Hybrid Cargo Handling Equipment
5.1.3. Charging Infrastructure and Battery Systems
5.1.4. Grid Reinforcement, Substations and Energy Storage
5.1.5. Engineering, Integration and Energy Management Services
5.2. Europe Port Electrification Market Outlook, by Port Type, Value (US$ Billion), 2020-2033
5.2.1. Container Terminals
5.2.2. Cruise and Passenger Terminals
5.2.3. Bulk and General Cargo Terminals
5.2.4. Roll-On Roll-Off and Vehicle Terminals
5.3. Europe Port Electrification Market Outlook, by Connection Type, Value (US$ Billion), 2020-2033
5.3.1. High Voltage Shore Connection
5.3.2. Low Voltage Shore Connection
5.3.3. Mobile and Barge-Based Power Supply
5.4. Europe Port Electrification Market Outlook, by End User, Value (US$ Billion), 2020-2033
5.4.1. Port Authorities
5.4.2. Terminal Operators
5.4.3. Shipping Lines
5.4.4. Energy Utilities and Independent Power Providers
5.5. Europe Port Electrification Market Outlook, by Country, Value (US$ Billion), 2020-2033
5.5.1. Germany Port Electrification Market Outlook, by Solution, 2020-2033
5.5.2. Germany Port Electrification Market Outlook, by Port Type, 2020-2033
5.5.3. Germany Port Electrification Market Outlook, by Connection Type, 2020-2033
5.5.4. Germany Port Electrification Market Outlook, by End User, 2020-2033
5.5.5. Netherlands Port Electrification Market Outlook, by Solution, 2020-2033
5.5.6. Netherlands Port Electrification Market Outlook, by Port Type, 2020-2033
5.5.7. Netherlands Port Electrification Market Outlook, by Connection Type, 2020-2033
5.5.8. Netherlands Port Electrification Market Outlook, by End User, 2020-2033
5.5.9. Belgium Port Electrification Market Outlook, by Solution, 2020-2033
5.5.10. Belgium Port Electrification Market Outlook, by Port Type, 2020-2033
5.5.11. Belgium Port Electrification Market Outlook, by Connection Type, 2020-2033
5.5.12. Belgium Port Electrification Market Outlook, by End User, 2020-2033
5.5.13. Spain Port Electrification Market Outlook, by Solution, 2020-2033
5.5.14. Spain Port Electrification Market Outlook, by Port Type, 2020-2033
5.5.15. Spain Port Electrification Market Outlook, by Connection Type, 2020-2033
5.5.16. Spain Port Electrification Market Outlook, by End User, 2020-2033
5.5.17. Italy Port Electrification Market Outlook, by Solution, 2020-2033
5.5.18. Italy Port Electrification Market Outlook, by Port Type, 2020-2033
5.5.19. Italy Port Electrification Market Outlook, by Connection Type, 2020-2033
5.5.20. Italy Port Electrification Market Outlook, by End User, 2020-2033
5.5.21. France Port Electrification Market Outlook, by Solution, 2020-2033
5.5.22. France Port Electrification Market Outlook, by Port Type, 2020-2033
5.5.23. France Port Electrification Market Outlook, by Connection Type, 2020-2033
5.5.24. France Port Electrification Market Outlook, by End User, 2020-2033
5.5.25. Norway Port Electrification Market Outlook, by Solution, 2020-2033
5.5.26. Norway Port Electrification Market Outlook, by Port Type, 2020-2033
5.5.27. Norway Port Electrification Market Outlook, by Connection Type, 2020-2033
5.5.28. Norway Port Electrification Market Outlook, by End User, 2020-2033
6. Asia Pacific Port Electrification Market Outlook, 2020-2033
6.1. Asia Pacific Port Electrification Market Outlook, by Solution, Value (US$ Billion), 2020-2033
6.1.1. Onshore Power Supply Systems
6.1.2. Electric and Hybrid Cargo Handling Equipment
6.1.3. Charging Infrastructure and Battery Systems
6.1.4. Grid Reinforcement, Substations and Energy Storage
6.1.5. Engineering, Integration and Energy Management Services
6.2. Asia Pacific Port Electrification Market Outlook, by Port Type, Value (US$ Billion), 2020-2033
6.2.1. Container Terminals
6.2.2. Cruise and Passenger Terminals
6.2.3. Bulk and General Cargo Terminals
6.2.4. Roll-On Roll-Off and Vehicle Terminals
6.3. Asia Pacific Port Electrification Market Outlook, by Connection Type, Value (US$ Billion), 2020-2033
6.3.1. High Voltage Shore Connection
6.3.2. Low Voltage Shore Connection
6.3.3. Mobile and Barge-Based Power Supply
6.4. Asia Pacific Port Electrification Market Outlook, by End User, Value (US$ Billion), 2020-2033
6.4.1. Port Authorities
6.4.2. Terminal Operators
6.4.3. Shipping Lines
6.4.4. Energy Utilities and Independent Power Providers
6.5. Asia Pacific Port Electrification Market Outlook, by Country, Value (US$ Billion), 2020-2033
6.5.1. China Port Electrification Market Outlook, by Solution, 2020-2033
6.5.2. China Port Electrification Market Outlook, by Port Type, 2020-2033
6.5.3. China Port Electrification Market Outlook, by Connection Type, 2020-2033
6.5.4. China Port Electrification Market Outlook, by End User, 2020-2033
6.5.5. Singapore Port Electrification Market Outlook, by Solution, 2020-2033
6.5.6. Singapore Port Electrification Market Outlook, by Port Type, 2020-2033
6.5.7. Singapore Port Electrification Market Outlook, by Connection Type, 2020-2033
6.5.8. Singapore Port Electrification Market Outlook, by End User, 2020-2033
6.5.9. Japan Port Electrification Market Outlook, by Solution, 2020-2033
6.5.10. Japan Port Electrification Market Outlook, by Port Type, 2020-2033
6.5.11. Japan Port Electrification Market Outlook, by Connection Type, 2020-2033
6.5.12. Japan Port Electrification Market Outlook, by End User, 2020-2033
6.5.13. Korea Port Electrification Market Outlook, by Solution, 2020-2033
6.5.14. Korea Port Electrification Market Outlook, by Port Type, 2020-2033
6.5.15. Korea Port Electrification Market Outlook, by Connection Type, 2020-2033
6.5.16. Korea Port Electrification Market Outlook, by End User, 2020-2033
6.5.17. India Port Electrification Market Outlook, by Solution, 2020-2033
6.5.18. India Port Electrification Market Outlook, by Port Type, 2020-2033
6.5.19. India Port Electrification Market Outlook, by Connection Type, 2020-2033
6.5.20. India Port Electrification Market Outlook, by End User, 2020-2033
6.5.21. Australia Port Electrification Market Outlook, by Solution, 2020-2033
6.5.22. Australia Port Electrification Market Outlook, by Port Type, 2020-2033
6.5.23. Australia Port Electrification Market Outlook, by Connection Type, 2020-2033
6.5.24. Australia Port Electrification Market Outlook, by End User, 2020-2033
7. Latin America Port Electrification Market Outlook, 2020-2033
7.1. Latin America Port Electrification Market Outlook, by Solution, Value (US$ Billion), 2020-2033
7.1.1. Onshore Power Supply Systems
7.1.2. Electric and Hybrid Cargo Handling Equipment
7.1.3. Charging Infrastructure and Battery Systems
7.1.4. Grid Reinforcement, Substations and Energy Storage
7.1.5. Engineering, Integration and Energy Management Services
7.2. Latin America Port Electrification Market Outlook, by Port Type, Value (US$ Billion), 2020-2033
7.2.1. Container Terminals
7.2.2. Cruise and Passenger Terminals
7.2.3. Bulk and General Cargo Terminals
7.2.4. Roll-On Roll-Off and Vehicle Terminals
7.3. Latin America Port Electrification Market Outlook, by Connection Type, Value (US$ Billion), 2020-2033
7.3.1. High Voltage Shore Connection
7.3.2. Low Voltage Shore Connection
7.3.3. Mobile and Barge-Based Power Supply
7.4. Latin America Port Electrification Market Outlook, by End User, Value (US$ Billion), 2020-2033
7.4.1. Port Authorities
7.4.2. Terminal Operators
7.4.3. Shipping Lines
7.4.4. Energy Utilities and Independent Power Providers
7.5. Latin America Port Electrification Market Outlook, by Country, Value (US$ Billion), 2020-2033
7.5.1. Brazil Port Electrification Market Outlook, by Solution, 2020-2033
7.5.2. Brazil Port Electrification Market Outlook, by Port Type, 2020-2033
7.5.3. Brazil Port Electrification Market Outlook, by Connection Type, 2020-2033
7.5.4. Brazil Port Electrification Market Outlook, by End User, 2020-2033
7.5.5. Chile Port Electrification Market Outlook, by Solution, 2020-2033
7.5.6. Chile Port Electrification Market Outlook, by Port Type, 2020-2033
7.5.7. Chile Port Electrification Market Outlook, by Connection Type, 2020-2033
7.5.8. Chile Port Electrification Market Outlook, by End User, 2020-2033
7.5.9. Panama Port Electrification Market Outlook, by Solution, 2020-2033
7.5.10. Panama Port Electrification Market Outlook, by Port Type, 2020-2033
7.5.11. Panama Port Electrification Market Outlook, by Connection Type, 2020-2033
7.5.12. Panama Port Electrification Market Outlook, by End User, 2020-2033
7.5.13. Mexico Port Electrification Market Outlook, by Solution, 2020-2033
7.5.14. Mexico Port Electrification Market Outlook, by Port Type, 2020-2033
7.5.15. Mexico Port Electrification Market Outlook, by Connection Type, 2020-2033
7.5.16. Mexico Port Electrification Market Outlook, by End User, 2020-2033
7.5.17. Colombia Port Electrification Market Outlook, by Solution, 2020-2033
7.5.18. Colombia Port Electrification Market Outlook, by Port Type, 2020-2033
7.5.19. Colombia Port Electrification Market Outlook, by Connection Type, 2020-2033
7.5.20. Colombia Port Electrification Market Outlook, by End User, 2020-2033
8. Middle East & Africa Port Electrification Market Outlook, 2020-2033
8.1. Middle East & Africa Port Electrification Market Outlook, by Solution, Value (US$ Billion), 2020-2033
8.1.1. Onshore Power Supply Systems
8.1.2. Electric and Hybrid Cargo Handling Equipment
8.1.3. Charging Infrastructure and Battery Systems
8.1.4. Grid Reinforcement, Substations and Energy Storage
8.1.5. Engineering, Integration and Energy Management Services
8.2. Middle East & Africa Port Electrification Market Outlook, by Port Type, Value (US$ Billion), 2020-2033
8.2.1. Container Terminals
8.2.2. Cruise and Passenger Terminals
8.2.3. Bulk and General Cargo Terminals
8.2.4. Roll-On Roll-Off and Vehicle Terminals
8.3. Middle East & Africa Port Electrification Market Outlook, by Connection Type, Value (US$ Billion), 2020-2033
8.3.1. High Voltage Shore Connection
8.3.2. Low Voltage Shore Connection
8.3.3. Mobile and Barge-Based Power Supply
8.4. Middle East & Africa Port Electrification Market Outlook, by End User, Value (US$ Billion), 2020-2033
8.4.1. Port Authorities
8.4.2. Terminal Operators
8.4.3. Shipping Lines
8.4.4. Energy Utilities and Independent Power Providers
8.5. Middle East & Africa Port Electrification Market Outlook, by Country, Value (US$ Billion), 2020-2033
8.5.1. United Arab Emirates Port Electrification Market Outlook, by Solution, 2020-2033
8.5.2. United Arab Emirates Port Electrification Market Outlook, by Port Type, 2020-2033
8.5.3. United Arab Emirates Port Electrification Market Outlook, by Connection Type, 2020-2033
8.5.4. United Arab Emirates Port Electrification Market Outlook, by End User, 2020-2033
8.5.5. Saudi Arabia Port Electrification Market Outlook, by Solution, 2020-2033
8.5.6. Saudi Arabia Port Electrification Market Outlook, by Port Type, 2020-2033
8.5.7. Saudi Arabia Port Electrification Market Outlook, by Connection Type, 2020-2033
8.5.8. Saudi Arabia Port Electrification Market Outlook, by End User, 2020-2033
8.5.9. Oman Port Electrification Market Outlook, by Solution, 2020-2033
8.5.10. Oman Port Electrification Market Outlook, by Port Type, 2020-2033
8.5.11. Oman Port Electrification Market Outlook, by Connection Type, 2020-2033
8.5.12. Oman Port Electrification Market Outlook, by End User, 2020-2033
8.5.13. Egypt Port Electrification Market Outlook, by Solution, 2020-2033
8.5.14. Egypt Port Electrification Market Outlook, by Port Type, 2020-2033
8.5.15. Egypt Port Electrification Market Outlook, by Connection Type, 2020-2033
8.5.16. Egypt Port Electrification Market Outlook, by End User, 2020-2033
8.5.17. Morocco Port Electrification Market Outlook, by Solution, 2020-2033
8.5.18. Morocco Port Electrification Market Outlook, by Port Type, 2020-2033
8.5.19. Morocco Port Electrification Market Outlook, by Connection Type, 2020-2033
8.5.20. Morocco Port Electrification Market Outlook, by End User, 2020-2033
8.5.21. South Africa Port Electrification Market Outlook, by Solution, 2020-2033
8.5.22. South Africa Port Electrification Market Outlook, by Port Type, 2020-2033
8.5.23. South Africa Port Electrification Market Outlook, by Connection Type, 2020-2033
8.5.24. South Africa Port Electrification Market Outlook, by End User, 2020-2033
9. Competitive Landscape
9.1. Market Concentration and Industry Leaders
9.2. Competitive Differentiation
9.3. Strategic Initiatives
9.4. Recent Industry Developments
9.5. Company Profiles
9.5.1. ABB Ltd.
9.5.2. Siemens AG
9.5.3. Schneider Electric SE
9.5.4. Hitachi Energy Ltd.
9.5.5. Cavotec SA
9.5.6. Wärtsilä Corporation
9.5.7. Konecranes Plc
9.5.8. Kalmar Corporation
9.5.9. Liebherr Group
9.5.10. Shanghai Zhenhua Heavy Industries Co., Ltd.
9.5.11. PowerCon A/S
9.5.12. Danfoss A/S
9.5.13. Royal Terberg Group
10. Appendix
10.1. Research Methodology
10.2. Report Assumptions
10.3. Acronyms and Abbreviations
| Solution | Onshore Power Supply Systems, Electric and Hybrid Cargo Handling Equipment, Charging Infrastructure and Battery Systems, Grid Reinforcement, Substations and Energy Storage, Engineering, Integration and Energy Management Services |
| Port Type | Container Terminals, Cruise and Passenger Terminals, Bulk and General Cargo Terminals, Roll-On Roll-Off and Vehicle Terminals |
| Connection Type | High Voltage Shore Connection, Low Voltage Shore Connection, Mobile and Barge-Based Power Supply |
| End User | Port Authorities, Terminal Operators, Shipping Lines, Energy Utilities and Independent Power Providers |
| Regions | North America, Europe, Asia Pacific, Latin America, Middle East & Africa |
Our Research Methodology
Considering the volatility of business today, traditional approaches to strategizing a game plan can be unfruitful if not detrimental. True ambiguity is no way to determine a forecast. A myriad of predetermined factors must be accounted for such as the degree of risk involved, the magnitude of circumstances, as well as conditions or consequences that are not known or unpredictable. To circumvent binary views that cast uncertainty, the application of market research intelligence to strategically posture, move, and enable actionable outcomes is necessary.
View Methodology
Quality Assured
Rigorous Validation Process

Confidentiality Assured
End-to-end Data Security

Custom Research Services
Tailored To Your Objectives
FAQs
The port electrification market is valued at US$ 6.8 billion in 2026, covering shore power, electric cargo handling equipment, grid infrastructure and related services.
The market is projected to reach US$ 16.4 billion by 2033, growing at a 13.4% CAGR and adding US$ 9.6 billion in value.
Onshore power supply systems lead with 41.0% share in 2026, because regulation specifically requires shore-side electricity provision at many berths.
Electric and hybrid cargo handling equipment grows fastest at a 15.8% CAGR, because replacing diesel yard machinery delivers a real operating saving.
Europe leads with 38.5% share in 2026, because its shore power obligations carry the most specific requirements and the firmest compliance dates.
Related Reports
Polycrystalline Solar Cell Market Size, Share, Insights, Competitive Landscape, and Forecast 2026 to 2033
Explore the polycrystalline solar cell market, valued at US$ 5.4 billion in 2026 and projected to reach US$ 6.6 billion by 2033, growing at 2.9% CAGR.
Synchronous Condenser Market Size, Share, Insights, Competitive Landscape, and Forecast 2026 to 2033
The global synchronous condenser market is valued at US$1.20 billion in 2026, reaching US$1.50 billion by 2033, growing at a 3.2% CAGR
Water and Wastewater Treatment Market Size, Share, Insights, Competitive Landscape, and Forecast 2026 to 2033
Water and wastewater treatment market to reach US$ 508.0 billion by 2033 from US$ 345.0 billion in 2026 at a 5.7% CAGR. Explore trends, segments and regions.
Vehicle-to-Grid Technology Market Size, Share, Insights, Competitive Landscape, and Forecast 2026 to 2033
Explore the vehicle-to-grid technology market, forecast to reach US$6.9 billion by 2033 at 28.4% CAGR, with component, application and regional insights.
Offshore Oil and Gas Equipment Market Size, Share, Insights, Competitive Landscape, and Forecast 2026 to 2033
The offshore oil and gas equipment market is projected to grow from US$94.0 billion in 2026 to US$138.0 billion by 2033, at a 5.6% CAGR. Explore trends.
Floating Storage and Regasification Unit Market Size, Share, Insights, Competitive Landscape, and Forecast 2026 to 2033
Floating storage and regasification unit market to grow from US$8.96 Bn in 2026 to US$13.92 Bn by 2033 at 6.5% CAGR. Explore types, mooring and regions.