



Polycrystalline Solar Cell Market
Polycrystalline Solar Cell Market Size, Share, Insights, Competitive Landscape, and Forecast 2026 to 2033
Polycrystalline Solar Cell Market Size, Share, Insights, Competitive Landscape, and Forecast 2026 to 2033
Is the Polycrystalline Solar Cell Market Still Growing?
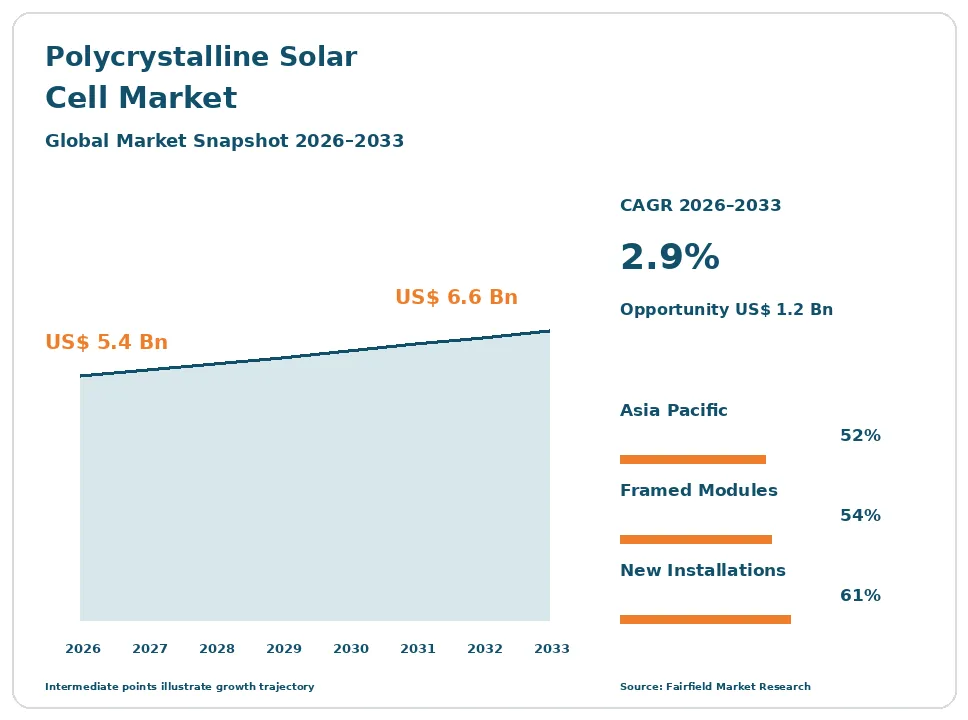
The global Polycrystalline Solar Cell market size is expected to be valued at US$ 5.4 billion in 2026 and projected to reach US$ 6.6 billion by 2033, growing at a CAGR of 2.9% between 2026 and 2033.
This is not a growth story. Multicrystalline silicon has been displaced by monocrystalline across mainstream photovoltaics, and its share of global module shipments has fallen from dominant to marginal. Diamond wire sawing cut monocrystalline wafer cost, and monocrystalline PERC, TOPCon and heterojunction cells reach efficiencies multicrystalline cannot match. Between 2020 and 2025 the segment contracted sharply in share while total photovoltaic installation grew at double-digit rates. What remains is residual manufacturing, price-sensitive off-grid demand, and a very large replacement aftermarket. Value is therefore roughly flat to slightly up, while share of the industry keeps falling steeply.
Key Report Takeaways
- By Product Type: Framed multicrystalline modules held 54.0% share in 2026, while replacement and spare modules are projected to expand at a 5.1% CAGR through 2033, because warranty and repair obligations outlive the technology that created them.
- By Power Output: The 251–350 W range held 44.0% share in 2026, while modules up to 150 W are projected to expand at a 4.8% CAGR through 2033, serving solar home systems and small standalone installations.
- By Application: Off-grid and rural electrification held 33.0% share in 2026, while consumer and small-scale products are projected to expand at a 5.3% CAGR through 2033, where absolute cost per watt outweighs area efficiency.
- By Demand Channel: New installations held 61.0% share in 2026, while replacement and aftermarket modules are projected to expand at a 5.6% CAGR through 2033, serving a very large installed base still under long warranties.
- By Geography: Asia Pacific held 52.0% share in 2026, while Middle East & Africa is projected to expand at a 4.6% CAGR through 2033, on rural electrification and small standalone systems.
Global Polycrystalline Solar Cell Market Trends and Insights
Drivers Impact Analysis
| Driver | Impact on CAGR Forecast | Geographic Relevance | Impact Timeline |
| Replacement demand from a large ageing installed base | Medium | Global, largest in Asia Pacific and Europe | Long term (≥4 years) |
| Absolute cost per watt in off-grid and small systems | Medium | Middle East & Africa, Latin America | Medium term (2–4 years) |
Only two forces still add value to this market, and neither resembles mainstream solar growth.
Warranty-Backed Replacement of an Ageing Installed Base Sustains Polycrystalline Solar Cell Demand
Replacement demand is now the most dependable source of revenue in multicrystalline photovoltaics. Hundreds of gigawatts of polycrystalline modules were installed during the technology’s dominant decade, and most carry product and performance warranties running twenty-five years. Arrays lose modules to glass breakage, hail, delamination, junction box failure and hotspots, and each failure requires a replacement that physically and electrically matches the string.
The mechanism is technical, not commercial. A string’s voltage and current must stay within inverter limits, and mixing a modern high-efficiency module into a legacy multicrystalline string creates mismatch losses and can void warranties. Operations and maintenance contractors therefore source like-for-like multicrystalline modules, often in the original power class and cell count. Qualification against IEC 61215 and IEC 61730 remains the baseline requirement, which keeps a small, specialised production and inventory business alive.
Absolute Cost Per Watt Keeps Polycrystalline Solar Cells Viable in Off-Grid and Small-Scale Systems
Where land and roof area are not constrained, buyers optimise for the lowest total price, not the highest efficiency. Off-grid households, rural clinics, water pumping sites, telecom shelters and small standalone systems typically have ample space and very tight budgets. In those applications a lower-efficiency multicrystalline module that costs less per unit can still be the rational purchase, which preserves a genuine residual demand pool.
The causal mechanism is the structure of off-grid system cost. The module is only part of a package that includes a battery, charge controller, wiring and often the installer’s travel to a remote site. Shaving module cost matters more than shaving array area when the array sits on open ground. National rural electrification and off-grid solar programmes fund much of this demand, and procurement rules in those programmes usually specify IEC 61215 qualification rather than a minimum efficiency.
Restraints Impact Analysis
| Restraint | Impact on CAGR Forecast | Geographic Relevance | Impact Timeline |
| Efficiency and land-use penalty against monocrystalline cells | High | Global | Short term (≤2 years) |
| Manufacturer exit, narrowing supply and weak bankability | High | Global, acute in Asia Pacific | Medium term (2–4 years) |
The constraints on this market are structural and are not expected to reverse.
The Efficiency and Land-Use Penalty Excludes Polycrystalline Solar Cells From Utility-Scale Projects
The efficiency gap has removed multicrystalline technology from the projects that drive photovoltaic volume. Utility-scale tenders are judged on levelised cost of electricity, which rewards more watts per module, per mounting structure and per hectare. A lower-efficiency module raises the count of racking posts, cables, labour hours and land area needed for the same capacity, so balance-of-system cost rises even if the module is cheaper.
The cause lies in the wafer. Multicrystalline ingots contain grain boundaries and higher defect densities that limit carrier lifetime, capping practical cell efficiency several points below monocrystalline PERC and further below TOPCon and heterojunction designs. Diamond wire sawing, which once favoured multicrystalline, was adopted across monocrystalline production and removed the cost advantage entirely. With cheaper wafers and better physics on the other side, there is no remaining technical argument for new utility deployment.
Manufacturer Exit and Weak Bankability Narrow Polycrystalline Solar Cell Supply and Resale Value
Supply is contracting faster than demand, which creates its own constraints. Cell and module makers have converted or closed multicrystalline lines, so the number of qualified suppliers keeps falling, lead times for legacy power classes lengthen, and buyers face limited sourcing choice. Resale and salvage values for used multicrystalline modules have fallen toward scrap levels, weakening the residual value assumptions in older project financing models.
The underlying causes are capital allocation and risk assessment. A multicrystalline line cannot be upgraded cheaply to produce TOPCon cells, so owners either convert at significant cost or exit. Financiers and insurers favour mainstream technology with long bankability track records and active manufacturer support, and they discount projects whose replacement modules may become unavailable. WEEE Directive obligations in the European Union further raise end-of-life handling costs for module owners.
Market Opportunities
Replacement Modules and Repair Inventory Open a Durable Polycrystalline Solar Cell Aftermarket
The aftermarket is the clearest remaining revenue pool, and it is long-lived. A very large installed base of multicrystalline arrays will need matched replacement modules for another fifteen to twenty years, and supply of those modules is shrinking while need persists. Suppliers who hold qualified inventory in legacy power classes and cell counts can command a premium well above commodity module pricing.
Asset owners, operations and maintenance contractors and insurers create this demand, because performance guarantees and insurance settlements require like-for-like restoration. Independent power producers with multi-site portfolios are the most systematic buyers, since they plan spares strategically rather than reactively. Supporting this are the durability test standards that define acceptable replacements, including IEC 61701 salt mist testing for coastal arrays and IEC 62804 potential induced degradation testing, which let buyers verify a legacy-format module against modern expectations.
Recycling the Retiring Polycrystalline Installed Base Creates a Material Recovery Revenue Pool
End-of-life recovery is the second genuine opportunity, and policy is already creating it. The multicrystalline fleet installed during the technology’s peak is entering retirement, and each module contains recoverable aluminium frame, glass, copper, silver and silicon. Recyclers who can separate those fractions economically gain a feedstock stream that is predictable in volume and increasingly mandated in handling.
Module owners, decommissioning contractors and recyclers share this pool, with demand created by repowering projects that remove working-but-obsolete arrays to install higher-efficiency equipment on the same land. The supporting development is regulatory: the European Union WEEE Directive places photovoltaic modules within producer responsibility obligations for collection, treatment and recycling, and ecodesign and energy labelling work on photovoltaic modules in the European Union is extending attention to durability and recyclability across the product’s whole life.
Segment Analysis
By Product Type: Framed Modules Hold the Bulk While Replacement Modules Grow Fastest
Framed multicrystalline modules held 54.0% share in 2026, because the market sells finished modules rather than bare cells to almost every end customer. Standard aluminium-framed laminates qualified to IEC 61215 and IEC 61730 remain the practical unit of trade for installers and procurement programmes. Multicrystalline solar cells sold as components form a smaller block, serving module assemblers in markets with local content rules. Replacement and spare modules grow fastest at a 5.1% CAGR to 2033, because repair of existing arrays does not depend on new technology decisions and because matched spares become scarcer each year. Small-format and custom modules serve consumer products, signage, telemetry and marine applications. The commercial implication is that value is migrating away from volume production toward specification-matched supply, where scarcity rather than scale sets the price.
By Power Output: Mid-Range Modules Lead While Small Modules Expand Quickest
The 251–350 W range held 44.0% share in 2026, because it covers the bulk of the multicrystalline modules installed during the technology’s peak and therefore dominates replacement demand. The 151–250 W band follows, concentrated in older rooftop and small commercial arrays. Modules up to 150 W grow fastest at a 4.8% CAGR, serving solar home systems, street lighting, water pumping and telecom sites where a complete system is specified around one small panel. Above 350 W the multicrystalline offering is thin, because reaching those ratings requires either very large formats or efficiencies the technology cannot deliver, which is precisely where monocrystalline alternatives take the business. The pattern confirms the market’s shape: the installed base defines the mid-range, while genuinely new demand sits at the small end.
By Application: Off-Grid Electrification Leads While Consumer Products Grow Fastest
Off-grid and rural electrification held 33.0% share in 2026, the largest single application, because absolute cost per watt matters more there than efficiency per square metre. Village mini-grids, water pumping, clinics, schools and telecom shelters all prioritise delivered system price. Consumer and small-scale products grow fastest at a 5.3% CAGR, covering garden lighting, portable panels, signage, battery maintenance and monitoring equipment, where modest wattage and low price define the specification. Residential rooftop demand is now mostly replacement, since new installations specify monocrystalline. Commercial and industrial rooftops follow the same pattern. Utility-scale solar is effectively closed to multicrystalline technology for new build, because tenders are decided on levelised cost of electricity, which punishes low efficiency through land, racking and labour. Demand has migrated to the margins of the industry.
By Demand Channel: New Installations Still Lead While the Aftermarket Grows Fastest
New installations held 61.0% share in 2026, concentrated almost entirely in off-grid programmes, small systems and regional markets where legacy lines and low-cost supply persist. That share is falling every year as manufacturing capacity converts or closes. Replacement and aftermarket modules grow fastest at a 5.6% CAGR to 2033, backed by a very large installed base carrying twenty-five-year performance warranties and by the mismatch problem that prevents owners from substituting modern high-efficiency modules into legacy strings. Second-hand and refurbished modules form a smaller third channel, supplying budget buyers and repair work, though falling salvage values squeeze its economics. The strategic implication is clear: the centre of gravity in this market is shifting from production and sale toward inventory, qualification and service around equipment that is already on roofs and in fields.
Geography Analysis
North America Retains Polycrystalline Demand Almost Entirely as Replacement Supply
North America held 9.0% of the market in 2026, with the United States, Canada and Mexico contributing. Essentially no new utility or commercial project here specifies multicrystalline technology, so demand is replacement, repair and small off-grid equipment. The region holds a substantial installed base from the technology’s peak, particularly in early utility and commercial rooftop portfolios, and asset owners must keep matched spares to preserve warranties and insurance cover. Trade measures shape supply: the United States extended its safeguard tariff on imported crystalline silicon cells and modules, and anti-dumping and countervailing duties apply to several supplying countries. Those measures raise landed cost on a product already losing commercial logic. The main regional opportunity is structured spares inventory for independent power producers managing ageing portfolios.
Europe Drives Polycrystalline Solar Cell Recycling Through End-of-Life Rules
Europe accounted for 11.5% of the market in 2026, led by Germany, Italy, Spain and France, all of which deployed multicrystalline heavily during the feed-in tariff era. New demand is minimal, and the region’s significance now lies at the end of life rather than the beginning. The WEEE Directive brings photovoltaic modules into producer responsibility obligations for collection, treatment and recycling, which has created organised take-back schemes and a measurable recycling industry. Ecodesign and energy labelling work on photovoltaic modules extends regulatory attention toward durability, carbon footprint and recyclability. Repowering is the defining regional activity: owners strip working multicrystalline arrays to install higher-efficiency equipment on the same connection. Barriers include high labour costs for module handling and limited residual value for recovered equipment.
Which Region Is Leading the Polycrystalline Solar Cell Market?
Asia Pacific leads the polycrystalline solar cell market with 52.0% share in 2026, because it holds both the residual manufacturing capacity and the largest replacement base. China retains the remaining multicrystalline cell and module lines, though most capacity has converted to monocrystalline TOPCon production, and it supplies legacy formats to the rest of the world. India sustains demand through rural electrification, agricultural pumping programmes and domestic module assembly, supported by customs duties introduced on imported photovoltaic cells and modules that favour local supply. Indonesia, Vietnam, Bangladesh and the Philippines add off-grid and solar home system volume. The structural risk is supply concentration: as the last multicrystalline lines convert, availability of matched replacement modules globally depends on decisions taken by a shrinking group of manufacturers in this region.
Latin America Sustains Polycrystalline Use in Rural and Agricultural Systems
Latin America represented 10.5% of the market in 2026, with Brazil, Mexico, Peru, Bolivia and Colombia the main contributors. Demand here is dominated by rural electrification, agricultural water pumping, livestock watering and remote telecom power, where budgets are tight and land is not scarce. Government and development-funded programmes account for a large share of purchases, and their procurement rules often reference IEC 61215 qualification rather than minimum efficiency, which keeps multicrystalline modules eligible. Barriers are significant: currency volatility raises import costs, distribution networks for spares are thin outside major cities, and maintenance capability in remote areas is limited. Falling monocrystalline prices increasingly undercut the cost argument even in these applications. The clearest opportunity is bundled small system supply, where the module is one line in a packaged offering.
Which Region Is Growing Fastest in the Polycrystalline Solar Cell Market?
Middle East & Africa is growing fastest in the polycrystalline solar cell market, at a 4.6% CAGR from 2026 to 2033, though from the smallest base of any region at 17.0% share. National rural electrification and off-grid solar programmes across Nigeria, Kenya, Ethiopia, Tanzania and Morocco are the engine, funding solar home systems, mini-grids, clinic power and water pumping in areas the grid will not reach soon. Absolute affordability governs those purchases, which is the one condition that still favours multicrystalline supply. Barriers are serious: import duties, weak distribution, counterfeit and substandard modules, and almost no local repair or recycling capability. Quality assurance is the main regional opportunity, since programme funders increasingly demand verified IEC 61215 and IEC 61730 certification before releasing payment.
Competitive Landscape
The polycrystalline solar cell market is moderately concentrated and consolidating for an unusual reason: suppliers are leaving rather than merging. The companies that once led multicrystalline production have converted the bulk of their capacity to monocrystalline TOPCon and heterojunction lines, keeping multicrystalline output as a residual activity rather than a strategy. What remains is a mix of large integrated manufacturers running legacy lines at low utilisation, regional assemblers in markets with local content requirements or import duties, and specialist traders holding inventory for replacement supply. Concentration is therefore rising while total volume falls, which is the signature of a declining technology rather than a maturing one.
Competition is fought almost entirely on price per watt, supply availability and certification. Area efficiency, which decides mainstream module tenders, is not a competitive lever here, because customers choosing multicrystalline have already decided efficiency is not their constraint. What matters instead is whether a supplier can deliver a specific legacy power class and cell count, whether the module carries valid IEC 61215 and IEC 61730 certification, and whether warranty support will outlast the sale. New entrants are rare in manufacturing; the genuinely new participants are spares distributors, repowering contractors and module recyclers who monetise the installed base rather than new production.
Strategic activity across the industry runs in one direction: capacity conversion away from multicrystalline, consolidation of remaining lines into fewer sites, and the redeployment of engineering effort toward higher-efficiency architectures. Regional assemblers in duty-protected markets have taken a larger share of what remains, while traders have built inventory positions in discontinued formats. Recyclers and repowering specialists are building capability against a retirement wave that is only beginning.
Strategic direction is shaped by three themes: managing an orderly exit from multicrystalline production, serving warranty and replacement obligations that outlive the product, and capturing value from the installed base through repowering and material recovery.
Polycrystalline Solar Cell Industry Leaders
- Trina Solar Co., Ltd.
- JA Solar Technology Co., Ltd.
- Canadian Solar Inc.
- Vikram Solar Limited
- Hanwha Qcells Co., Ltd.
Recent Industry Developments
- August 2018: The European Union WEEE Directive moved to open scope, confirming photovoltaic modules as covered electrical equipment subject to collection, treatment and recycling obligations – it created the organised end-of-life infrastructure the retiring multicrystalline fleet now depends on.
- February 2022: The United States extended its safeguard tariff on imported crystalline silicon photovoltaic cells and modules for a further four years – it reshaped landed cost and sourcing routes for all crystalline silicon supply into the market.
- April 2022: India brought into effect basic customs duty on imported photovoltaic cells and modules – it shifted demand toward domestic assembly and preserved a role for locally produced multicrystalline capacity.
- July 2024: The European Union Ecodesign for Sustainable Products Regulation entered into force, with photovoltaic modules remaining under preparatory work for ecodesign and energy labelling requirements – it points future competition toward durability, carbon footprint and recyclability.
Companies Covered in the Report
- Trina Solar Co., Ltd.
- JA Solar Technology Co., Ltd.
- JinkoSolar Holding Co., Ltd.
- Canadian Solar Inc.
- Risen Energy Co., Ltd.
- GCL System Integration Technology Co., Ltd.
- Zhongli Talesun Solar Co., Ltd.
- Yingli Green Energy Holding Company Limited
- Hanwha Qcells Co., Ltd.
- Vikram Solar Limited
- Waaree Energies Limited
- Websol Energy System Limited
- Emmvee Photovoltaic Power Private Limited
- Adani Solar
Polycrystalline Solar Cell Market Report Scope
This report covers photovoltaic cells made from multicrystalline silicon wafers and the modules built from them, across utility-scale, commercial and industrial, residential, and off-grid and small-scale applications. It includes residual new production, replacement and aftermarket supply, and second-hand modules. Monocrystalline, thin-film and emerging cell technologies are excluded. The base year is 2025 and the forecast period runs from 2026 to 2033, in US$ Billion.
Product Type
- Multicrystalline Solar Cells
- Framed Multicrystalline Modules
- Small-Format and Custom Modules
- Replacement and Spare Modules
Power Output
- Up to 150 W
- 151–250 W
- 251–350 W
- Above 350 W
Application
- Utility-Scale Solar
- Commercial and Industrial
- Residential Rooftop
- Off-Grid and Rural Electrification
- Consumer and Small-Scale Products
Demand Channel
- New Installations
- Replacement and Aftermarket Modules
- Second-Hand and Refurbished Modules
Regions
- North America
- Europe
- Asia Pacific
- Latin America
- Middle East & Africa
Key Questions Answered in the Report
How big is the polycrystalline solar cell market in 2026?
The polycrystalline solar cell market is valued at US$ 5.4 billion in 2026, covering multicrystalline cells, modules and replacement supply worldwide.
What is the polycrystalline solar cell forecast to 2033?
The market is projected to reach US$ 6.6 billion by 2033 at a 2.9% CAGR, roughly flat in value while falling steeply in industry share.
Which polycrystalline product type holds the largest share?
Framed multicrystalline modules lead with 54.0% share in 2026, because finished modules rather than bare cells are what customers actually buy.
Which polycrystalline segment is growing fastest?
Replacement and aftermarket modules grow fastest at a 5.6% CAGR, because legacy arrays under long warranties need matched like-for-like modules.
Which region leads the polycrystalline solar cell market?
Asia Pacific leads with 52.0% share in 2026, because it holds the remaining manufacturing lines and the largest multicrystalline installed base.
1. Executive Summary
1.1. Global Polycrystalline Solar Cell Market Snapshot
1.2. Future Projections, 2026-2033
1.3. Key Market Trends
1.4. Regional Snapshot
2. Market Overview
2.1. Market Definition and Report Scope
2.2. Historical Market Trends, 2020-2025
2.3. Market Dynamics
2.3.1. Drivers Impact Analysis
2.3.1.1. Warranty-Backed Replacement of an Ageing Installed Base Sustains Polycrystalline Solar Cell Demand
2.3.1.2. Absolute Cost Per Watt Keeps Polycrystalline Solar Cells Viable in Off-Grid and Small-Scale Systems
2.3.2. Restraints Impact Analysis
2.3.2.1. The Efficiency and Land-Use Penalty Excludes Polycrystalline Solar Cells From Utility-Scale Projects
2.3.2.2. Manufacturer Exit and Weak Bankability Narrow Polycrystalline Solar Cell Supply and Resale Value
2.3.3. Market Opportunities
2.3.3.1. Replacement Modules and Repair Inventory Open a Durable Polycrystalline Solar Cell Aftermarket
2.3.3.2. Recycling the Retiring Polycrystalline Installed Base Creates a Material Recovery Revenue Pool
3. Global Polycrystalline Solar Cell Market Outlook, 2020-2033
3.1. Global Polycrystalline Solar Cell Market Outlook, by Product Type, Value (US$ Billion), 2020-2033
3.1.1. Multicrystalline Solar Cells
3.1.2. Framed Multicrystalline Modules
3.1.3. Small-Format and Custom Modules
3.1.4. Replacement and Spare Modules
3.2. Global Polycrystalline Solar Cell Market Outlook, by Power Output, Value (US$ Billion), 2020-2033
3.2.1. Up to 150 W
3.2.2. 151–250 W
3.2.3. 251–350 W
3.2.4. Above 350 W
3.3. Global Polycrystalline Solar Cell Market Outlook, by Application, Value (US$ Billion), 2020-2033
3.3.1. Utility-Scale Solar
3.3.2. Commercial and Industrial
3.3.3. Residential Rooftop
3.3.4. Off-Grid and Rural Electrification
3.3.5. Consumer and Small-Scale Products
3.4. Global Polycrystalline Solar Cell Market Outlook, by Demand Channel, Value (US$ Billion), 2020-2033
3.4.1. New Installations
3.4.2. Replacement and Aftermarket Modules
3.4.3. Second-Hand and Refurbished Modules
3.5. Global Polycrystalline Solar Cell Market Outlook, by Region, Value (US$ Billion), 2020-2033
3.5.1. North America
3.5.2. Europe
3.5.3. Asia Pacific
3.5.4. Latin America
3.5.5. Middle East & Africa
4. North America Polycrystalline Solar Cell Market Outlook, 2020-2033
4.1. North America Polycrystalline Solar Cell Market Outlook, by Product Type, Value (US$ Billion), 2020-2033
4.1.1. Multicrystalline Solar Cells
4.1.2. Framed Multicrystalline Modules
4.1.3. Small-Format and Custom Modules
4.1.4. Replacement and Spare Modules
4.2. North America Polycrystalline Solar Cell Market Outlook, by Power Output, Value (US$ Billion), 2020-2033
4.2.1. Up to 150 W
4.2.2. 151–250 W
4.2.3. 251–350 W
4.2.4. Above 350 W
4.3. North America Polycrystalline Solar Cell Market Outlook, by Application, Value (US$ Billion), 2020-2033
4.3.1. Utility-Scale Solar
4.3.2. Commercial and Industrial
4.3.3. Residential Rooftop
4.3.4. Off-Grid and Rural Electrification
4.3.5. Consumer and Small-Scale Products
4.4. North America Polycrystalline Solar Cell Market Outlook, by Demand Channel, Value (US$ Billion), 2020-2033
4.4.1. New Installations
4.4.2. Replacement and Aftermarket Modules
4.4.3. Second-Hand and Refurbished Modules
4.5. North America Polycrystalline Solar Cell Market Outlook, by Country, Value (US$ Billion), 2020-2033
4.5.1. United States Polycrystalline Solar Cell Market Outlook, by Product Type, 2020-2033
4.5.2. United States Polycrystalline Solar Cell Market Outlook, by Power Output, 2020-2033
4.5.3. United States Polycrystalline Solar Cell Market Outlook, by Application, 2020-2033
4.5.4. United States Polycrystalline Solar Cell Market Outlook, by Demand Channel, 2020-2033
4.5.5. Canada Polycrystalline Solar Cell Market Outlook, by Product Type, 2020-2033
4.5.6. Canada Polycrystalline Solar Cell Market Outlook, by Power Output, 2020-2033
4.5.7. Canada Polycrystalline Solar Cell Market Outlook, by Application, 2020-2033
4.5.8. Canada Polycrystalline Solar Cell Market Outlook, by Demand Channel, 2020-2033
4.5.9. Mexico Polycrystalline Solar Cell Market Outlook, by Product Type, 2020-2033
4.5.10. Mexico Polycrystalline Solar Cell Market Outlook, by Power Output, 2020-2033
4.5.11. Mexico Polycrystalline Solar Cell Market Outlook, by Application, 2020-2033
4.5.12. Mexico Polycrystalline Solar Cell Market Outlook, by Demand Channel, 2020-2033
5. Europe Polycrystalline Solar Cell Market Outlook, 2020-2033
5.1. Europe Polycrystalline Solar Cell Market Outlook, by Product Type, Value (US$ Billion), 2020-2033
5.1.1. Multicrystalline Solar Cells
5.1.2. Framed Multicrystalline Modules
5.1.3. Small-Format and Custom Modules
5.1.4. Replacement and Spare Modules
5.2. Europe Polycrystalline Solar Cell Market Outlook, by Power Output, Value (US$ Billion), 2020-2033
5.2.1. Up to 150 W
5.2.2. 151–250 W
5.2.3. 251–350 W
5.2.4. Above 350 W
5.3. Europe Polycrystalline Solar Cell Market Outlook, by Application, Value (US$ Billion), 2020-2033
5.3.1. Utility-Scale Solar
5.3.2. Commercial and Industrial
5.3.3. Residential Rooftop
5.3.4. Off-Grid and Rural Electrification
5.3.5. Consumer and Small-Scale Products
5.4. Europe Polycrystalline Solar Cell Market Outlook, by Demand Channel, Value (US$ Billion), 2020-2033
5.4.1. New Installations
5.4.2. Replacement and Aftermarket Modules
5.4.3. Second-Hand and Refurbished Modules
5.5. Europe Polycrystalline Solar Cell Market Outlook, by Country, Value (US$ Billion), 2020-2033
5.5.1. Germany Polycrystalline Solar Cell Market Outlook, by Product Type, 2020-2033
5.5.2. Germany Polycrystalline Solar Cell Market Outlook, by Power Output, 2020-2033
5.5.3. Germany Polycrystalline Solar Cell Market Outlook, by Application, 2020-2033
5.5.4. Germany Polycrystalline Solar Cell Market Outlook, by Demand Channel, 2020-2033
5.5.5. Italy Polycrystalline Solar Cell Market Outlook, by Product Type, 2020-2033
5.5.6. Italy Polycrystalline Solar Cell Market Outlook, by Power Output, 2020-2033
5.5.7. Italy Polycrystalline Solar Cell Market Outlook, by Application, 2020-2033
5.5.8. Italy Polycrystalline Solar Cell Market Outlook, by Demand Channel, 2020-2033
5.5.9. Spain Polycrystalline Solar Cell Market Outlook, by Product Type, 2020-2033
5.5.10. Spain Polycrystalline Solar Cell Market Outlook, by Power Output, 2020-2033
5.5.11. Spain Polycrystalline Solar Cell Market Outlook, by Application, 2020-2033
5.5.12. Spain Polycrystalline Solar Cell Market Outlook, by Demand Channel, 2020-2033
5.5.13. France Polycrystalline Solar Cell Market Outlook, by Product Type, 2020-2033
5.5.14. France Polycrystalline Solar Cell Market Outlook, by Power Output, 2020-2033
5.5.15. France Polycrystalline Solar Cell Market Outlook, by Application, 2020-2033
5.5.16. France Polycrystalline Solar Cell Market Outlook, by Demand Channel, 2020-2033
6. Asia Pacific Polycrystalline Solar Cell Market Outlook, 2020-2033
6.1. Asia Pacific Polycrystalline Solar Cell Market Outlook, by Product Type, Value (US$ Billion), 2020-2033
6.1.1. Multicrystalline Solar Cells
6.1.2. Framed Multicrystalline Modules
6.1.3. Small-Format and Custom Modules
6.1.4. Replacement and Spare Modules
6.2. Asia Pacific Polycrystalline Solar Cell Market Outlook, by Power Output, Value (US$ Billion), 2020-2033
6.2.1. Up to 150 W
6.2.2. 151–250 W
6.2.3. 251–350 W
6.2.4. Above 350 W
6.3. Asia Pacific Polycrystalline Solar Cell Market Outlook, by Application, Value (US$ Billion), 2020-2033
6.3.1. Utility-Scale Solar
6.3.2. Commercial and Industrial
6.3.3. Residential Rooftop
6.3.4. Off-Grid and Rural Electrification
6.3.5. Consumer and Small-Scale Products
6.4. Asia Pacific Polycrystalline Solar Cell Market Outlook, by Demand Channel, Value (US$ Billion), 2020-2033
6.4.1. New Installations
6.4.2. Replacement and Aftermarket Modules
6.4.3. Second-Hand and Refurbished Modules
6.5. Asia Pacific Polycrystalline Solar Cell Market Outlook, by Country, Value (US$ Billion), 2020-2033
6.5.1. China Polycrystalline Solar Cell Market Outlook, by Product Type, 2020-2033
6.5.2. China Polycrystalline Solar Cell Market Outlook, by Power Output, 2020-2033
6.5.3. China Polycrystalline Solar Cell Market Outlook, by Application, 2020-2033
6.5.4. China Polycrystalline Solar Cell Market Outlook, by Demand Channel, 2020-2033
6.5.5. India Polycrystalline Solar Cell Market Outlook, by Product Type, 2020-2033
6.5.6. India Polycrystalline Solar Cell Market Outlook, by Power Output, 2020-2033
6.5.7. India Polycrystalline Solar Cell Market Outlook, by Application, 2020-2033
6.5.8. India Polycrystalline Solar Cell Market Outlook, by Demand Channel, 2020-2033
6.5.9. Indonesia Polycrystalline Solar Cell Market Outlook, by Product Type, 2020-2033
6.5.10. Indonesia Polycrystalline Solar Cell Market Outlook, by Power Output, 2020-2033
6.5.11. Indonesia Polycrystalline Solar Cell Market Outlook, by Application, 2020-2033
6.5.12. Indonesia Polycrystalline Solar Cell Market Outlook, by Demand Channel, 2020-2033
6.5.13. Vietnam Polycrystalline Solar Cell Market Outlook, by Product Type, 2020-2033
6.5.14. Vietnam Polycrystalline Solar Cell Market Outlook, by Power Output, 2020-2033
6.5.15. Vietnam Polycrystalline Solar Cell Market Outlook, by Application, 2020-2033
6.5.16. Vietnam Polycrystalline Solar Cell Market Outlook, by Demand Channel, 2020-2033
6.5.17. Bangladesh Polycrystalline Solar Cell Market Outlook, by Product Type, 2020-2033
6.5.18. Bangladesh Polycrystalline Solar Cell Market Outlook, by Power Output, 2020-2033
6.5.19. Bangladesh Polycrystalline Solar Cell Market Outlook, by Application, 2020-2033
6.5.20. Bangladesh Polycrystalline Solar Cell Market Outlook, by Demand Channel, 2020-2033
6.5.21. Philippines Polycrystalline Solar Cell Market Outlook, by Product Type, 2020-2033
6.5.22. Philippines Polycrystalline Solar Cell Market Outlook, by Power Output, 2020-2033
6.5.23. Philippines Polycrystalline Solar Cell Market Outlook, by Application, 2020-2033
6.5.24. Philippines Polycrystalline Solar Cell Market Outlook, by Demand Channel, 2020-2033
7. Latin America Polycrystalline Solar Cell Market Outlook, 2020-2033
7.1. Latin America Polycrystalline Solar Cell Market Outlook, by Product Type, Value (US$ Billion), 2020-2033
7.1.1. Multicrystalline Solar Cells
7.1.2. Framed Multicrystalline Modules
7.1.3. Small-Format and Custom Modules
7.1.4. Replacement and Spare Modules
7.2. Latin America Polycrystalline Solar Cell Market Outlook, by Power Output, Value (US$ Billion), 2020-2033
7.2.1. Up to 150 W
7.2.2. 151–250 W
7.2.3. 251–350 W
7.2.4. Above 350 W
7.3. Latin America Polycrystalline Solar Cell Market Outlook, by Application, Value (US$ Billion), 2020-2033
7.3.1. Utility-Scale Solar
7.3.2. Commercial and Industrial
7.3.3. Residential Rooftop
7.3.4. Off-Grid and Rural Electrification
7.3.5. Consumer and Small-Scale Products
7.4. Latin America Polycrystalline Solar Cell Market Outlook, by Demand Channel, Value (US$ Billion), 2020-2033
7.4.1. New Installations
7.4.2. Replacement and Aftermarket Modules
7.4.3. Second-Hand and Refurbished Modules
7.5. Latin America Polycrystalline Solar Cell Market Outlook, by Country, Value (US$ Billion), 2020-2033
7.5.1. Brazil Polycrystalline Solar Cell Market Outlook, by Product Type, 2020-2033
7.5.2. Brazil Polycrystalline Solar Cell Market Outlook, by Power Output, 2020-2033
7.5.3. Brazil Polycrystalline Solar Cell Market Outlook, by Application, 2020-2033
7.5.4. Brazil Polycrystalline Solar Cell Market Outlook, by Demand Channel, 2020-2033
7.5.5. Mexico Polycrystalline Solar Cell Market Outlook, by Product Type, 2020-2033
7.5.6. Mexico Polycrystalline Solar Cell Market Outlook, by Power Output, 2020-2033
7.5.7. Mexico Polycrystalline Solar Cell Market Outlook, by Application, 2020-2033
7.5.8. Mexico Polycrystalline Solar Cell Market Outlook, by Demand Channel, 2020-2033
7.5.9. Peru Polycrystalline Solar Cell Market Outlook, by Product Type, 2020-2033
7.5.10. Peru Polycrystalline Solar Cell Market Outlook, by Power Output, 2020-2033
7.5.11. Peru Polycrystalline Solar Cell Market Outlook, by Application, 2020-2033
7.5.12. Peru Polycrystalline Solar Cell Market Outlook, by Demand Channel, 2020-2033
7.5.13. Bolivia Polycrystalline Solar Cell Market Outlook, by Product Type, 2020-2033
7.5.14. Bolivia Polycrystalline Solar Cell Market Outlook, by Power Output, 2020-2033
7.5.15. Bolivia Polycrystalline Solar Cell Market Outlook, by Application, 2020-2033
7.5.16. Bolivia Polycrystalline Solar Cell Market Outlook, by Demand Channel, 2020-2033
7.5.17. Colombia Polycrystalline Solar Cell Market Outlook, by Product Type, 2020-2033
7.5.18. Colombia Polycrystalline Solar Cell Market Outlook, by Power Output, 2020-2033
7.5.19. Colombia Polycrystalline Solar Cell Market Outlook, by Application, 2020-2033
7.5.20. Colombia Polycrystalline Solar Cell Market Outlook, by Demand Channel, 2020-2033
8. Middle East & Africa Polycrystalline Solar Cell Market Outlook, 2020-2033
8.1. Middle East & Africa Polycrystalline Solar Cell Market Outlook, by Product Type, Value (US$ Billion), 2020-2033
8.1.1. Multicrystalline Solar Cells
8.1.2. Framed Multicrystalline Modules
8.1.3. Small-Format and Custom Modules
8.1.4. Replacement and Spare Modules
8.2. Middle East & Africa Polycrystalline Solar Cell Market Outlook, by Power Output, Value (US$ Billion), 2020-2033
8.2.1. Up to 150 W
8.2.2. 151–250 W
8.2.3. 251–350 W
8.2.4. Above 350 W
8.3. Middle East & Africa Polycrystalline Solar Cell Market Outlook, by Application, Value (US$ Billion), 2020-2033
8.3.1. Utility-Scale Solar
8.3.2. Commercial and Industrial
8.3.3. Residential Rooftop
8.3.4. Off-Grid and Rural Electrification
8.3.5. Consumer and Small-Scale Products
8.4. Middle East & Africa Polycrystalline Solar Cell Market Outlook, by Demand Channel, Value (US$ Billion), 2020-2033
8.4.1. New Installations
8.4.2. Replacement and Aftermarket Modules
8.4.3. Second-Hand and Refurbished Modules
8.5. Middle East & Africa Polycrystalline Solar Cell Market Outlook, by Country, Value (US$ Billion), 2020-2033
8.5.1. Nigeria Polycrystalline Solar Cell Market Outlook, by Product Type, 2020-2033
8.5.2. Nigeria Polycrystalline Solar Cell Market Outlook, by Power Output, 2020-2033
8.5.3. Nigeria Polycrystalline Solar Cell Market Outlook, by Application, 2020-2033
8.5.4. Nigeria Polycrystalline Solar Cell Market Outlook, by Demand Channel, 2020-2033
8.5.5. Kenya Polycrystalline Solar Cell Market Outlook, by Product Type, 2020-2033
8.5.6. Kenya Polycrystalline Solar Cell Market Outlook, by Power Output, 2020-2033
8.5.7. Kenya Polycrystalline Solar Cell Market Outlook, by Application, 2020-2033
8.5.8. Kenya Polycrystalline Solar Cell Market Outlook, by Demand Channel, 2020-2033
8.5.9. Ethiopia Polycrystalline Solar Cell Market Outlook, by Product Type, 2020-2033
8.5.10. Ethiopia Polycrystalline Solar Cell Market Outlook, by Power Output, 2020-2033
8.5.11. Ethiopia Polycrystalline Solar Cell Market Outlook, by Application, 2020-2033
8.5.12. Ethiopia Polycrystalline Solar Cell Market Outlook, by Demand Channel, 2020-2033
8.5.13. Tanzania Polycrystalline Solar Cell Market Outlook, by Product Type, 2020-2033
8.5.14. Tanzania Polycrystalline Solar Cell Market Outlook, by Power Output, 2020-2033
8.5.15. Tanzania Polycrystalline Solar Cell Market Outlook, by Application, 2020-2033
8.5.16. Tanzania Polycrystalline Solar Cell Market Outlook, by Demand Channel, 2020-2033
8.5.17. Morocco Polycrystalline Solar Cell Market Outlook, by Product Type, 2020-2033
8.5.18. Morocco Polycrystalline Solar Cell Market Outlook, by Power Output, 2020-2033
8.5.19. Morocco Polycrystalline Solar Cell Market Outlook, by Application, 2020-2033
8.5.20. Morocco Polycrystalline Solar Cell Market Outlook, by Demand Channel, 2020-2033
9. Competitive Landscape
9.1. Market Concentration and Industry Leaders
9.2. Competitive Differentiation
9.3. Strategic Initiatives
9.4. Recent Industry Developments
9.5. Company Profiles
9.5.1. Trina Solar Co., Ltd.
9.5.2. JA Solar Technology Co., Ltd.
9.5.3. JinkoSolar Holding Co., Ltd.
9.5.4. Canadian Solar Inc.
9.5.5. Risen Energy Co., Ltd.
9.5.6. GCL System Integration Technology Co., Ltd.
9.5.7. Zhongli Talesun Solar Co., Ltd.
9.5.8. Yingli Green Energy Holding Company Limited
9.5.9. Hanwha Qcells Co., Ltd.
9.5.10. Vikram Solar Limited
9.5.11. Waaree Energies Limited
9.5.12. Websol Energy System Limited
9.5.13. Emmvee Photovoltaic Power Private Limited
9.5.14. Adani Solar
10. Appendix
10.1. Research Methodology
10.2. Report Assumptions
10.3. Acronyms and Abbreviations
| Product Type | Multicrystalline Solar Cells, Framed Multicrystalline Modules, Small-Format and Custom Modules, Replacement and Spare Modules |
| Power Output | Up to 150 W, 151–250 W, 251–350 W, Above 350 W |
| Application | Utility-Scale Solar, Commercial and Industrial, Residential Rooftop, Off-Grid and Rural Electrification, Consumer and Small-Scale Products |
| Demand Channel | New Installations, Replacement and Aftermarket Modules, Second-Hand and Refurbished Modules |
| Regions | North America, Europe, Asia Pacific, Latin America, Middle East & Africa |
Our Research Methodology
Considering the volatility of business today, traditional approaches to strategizing a game plan can be unfruitful if not detrimental. True ambiguity is no way to determine a forecast. A myriad of predetermined factors must be accounted for such as the degree of risk involved, the magnitude of circumstances, as well as conditions or consequences that are not known or unpredictable. To circumvent binary views that cast uncertainty, the application of market research intelligence to strategically posture, move, and enable actionable outcomes is necessary.
View Methodology
Quality Assured
Rigorous Validation Process

Confidentiality Assured
End-to-end Data Security

Custom Research Services
Tailored To Your Objectives
FAQs
The polycrystalline solar cell market is valued at US$ 5.4 billion in 2026, covering multicrystalline cells, modules and replacement supply worldwide.
The market is projected to reach US$ 6.6 billion by 2033 at a 2.9% CAGR, roughly flat in value while falling steeply in industry share.
Framed multicrystalline modules lead with 54.0% share in 2026, because finished modules rather than bare cells are what customers actually buy.
Replacement and aftermarket modules grow fastest at a 5.6% CAGR, because legacy arrays under long warranties need matched like-for-like modules.
Asia Pacific leads with 52.0% share in 2026, because it holds the remaining manufacturing lines and the largest multicrystalline installed base.
Related Reports
Port Electrification Market Size, Share, Insights, Competitive Landscape, and Forecast 2026 to 2033
Explore the port electrification market, valued at US$ 6.8 billion in 2026 and forecast to reach US$ 16.4 billion by 2033, growing at a 13.4% CAGR.
Synchronous Condenser Market Size, Share, Insights, Competitive Landscape, and Forecast 2026 to 2033
The global synchronous condenser market is valued at US$1.20 billion in 2026, reaching US$1.50 billion by 2033, growing at a 3.2% CAGR
Water and Wastewater Treatment Market Size, Share, Insights, Competitive Landscape, and Forecast 2026 to 2033
Water and wastewater treatment market to reach US$ 508.0 billion by 2033 from US$ 345.0 billion in 2026 at a 5.7% CAGR. Explore trends, segments and regions.
Vehicle-to-Grid Technology Market Size, Share, Insights, Competitive Landscape, and Forecast 2026 to 2033
Explore the vehicle-to-grid technology market, forecast to reach US$6.9 billion by 2033 at 28.4% CAGR, with component, application and regional insights.
Offshore Oil and Gas Equipment Market Size, Share, Insights, Competitive Landscape, and Forecast 2026 to 2033
The offshore oil and gas equipment market is projected to grow from US$94.0 billion in 2026 to US$138.0 billion by 2033, at a 5.6% CAGR. Explore trends.
Floating Storage and Regasification Unit Market Size, Share, Insights, Competitive Landscape, and Forecast 2026 to 2033
Floating storage and regasification unit market to grow from US$8.96 Bn in 2026 to US$13.92 Bn by 2033 at 6.5% CAGR. Explore types, mooring and regions.