



Vehicle-to-Grid Technology Market
Vehicle-to-Grid Technology Market Size, Share, Insights, Competitive Landscape, and Forecast 2026 to 2033
Vehicle-to-Grid Technology Market Size and Trend Analysis
How Big Is the Vehicle-to-Grid Technology Market in 2026?
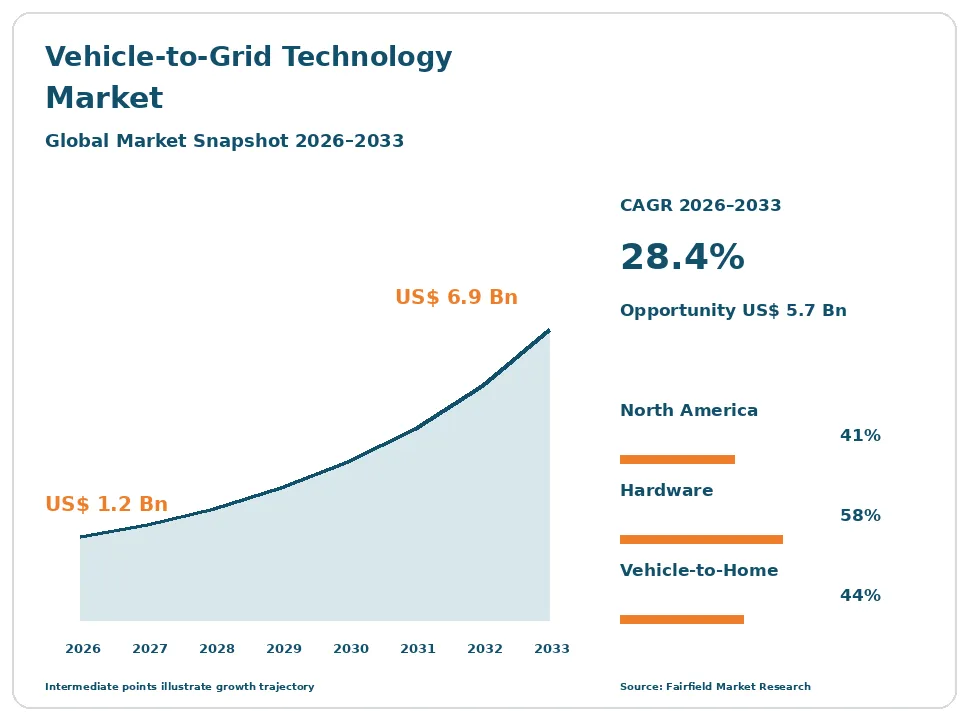
The global Vehicle-to-Grid Technology market size is expected to be valued at US$ 1.2 billion in 2026 and projected to reach US$ 6.9 billion by 2033, growing at a CAGR of 28.4% between 2026 and 2033.
Between 2020 and 2025 the sector grew at roughly a 31% CAGR from a very small base, with most revenue tied to funded pilots rather than commercial contracts. Three factors carry growth now. ISO 15118-20 gives vehicle and charger makers one way to negotiate bidirectional power transfer, which lowers integration cost. Depot-charged fleets provide predictable idle time, making dispatch commitments possible. Outage resilience is pulling vehicle-to-home hardware into houses without any utility export approval. The direction is steady rather than explosive. Few vehicles on the road support export today, so the addressable fleet stays thin, and hardware still supplies most revenue rather than energy sold back to the grid.
Key Report Takeaways
- By Component: Hardware held 58% share in 2026, while Software is projected to expand at a 33.1% CAGR through 2033, driven by aggregation platforms that pool vehicles into one dispatchable resource for utilities and balancing markets.
- By Charger Topology: DC Bidirectional Charging held 48% share in 2026, while Onboard Bidirectional Inverters are projected to grow at a 32.8% CAGR through 2033, helped by SAE J3072 interconnection provisions for vehicle-resident inverters.
- By Application: Vehicle-to-Home held 44% share in 2026, while Vehicle-to-Building is projected to expand at a 31.2% CAGR through 2033, because campus and depot projects stay behind the meter and avoid utility export review.
- By Vehicle Type: Passenger Cars held 51% share in 2026, while School Buses are projected to grow at a 34.2% CAGR through 2033, since their long parked seasons match summer peak-demand periods almost exactly.
- By Region: North America held 41% share in 2026, while Asia Pacific is projected to expand at a 32.4% CAGR through 2033, supported by residential storage habits and dense apartment charging retrofits.
Global Vehicle-to-Grid Technology Market Trends and Insights
Drivers Impact Analysis
| Driver | Impact on CAGR Forecast | Geographic Relevance | Impact Timeline |
| Standardised bidirectional communication under ISO 15118-20 | High | Europe, North America, Asia Pacific | Medium term 2–4 years |
| Household and commercial backup power demand | Medium | North America, Asia Pacific | Short term ≤2 years |
Two forces explain most of the forecast growth in bidirectional electric vehicle charging through 2033.
Common Bidirectional Signalling Under ISO 15118-20 Is Widening Vehicle Support
Standardised communication is the single clearest reason bidirectional charging is moving from demonstration to catalogue product. ISO 15118-20 defines how a vehicle and a charger agree on power flow in both directions, so a manufacturer no longer writes a bespoke integration for each charger brand. That cuts engineering cost per model and shortens validation time, which is what persuades a carmaker to enable export on a platform at all.
The mechanism is narrow but real. Earlier export capability reached the market through CHAdeMO, which carried bidirectional functions long before other connector families did, but it stayed confined to a handful of models. Work under SAE J2847/2 and SAE J3068 extends the same logic to North American and three-phase alternating current cases. Each additional supported platform enlarges the installed base that an aggregator can actually dispatch.
Outage Resilience Is Pulling Vehicle-to-Home Systems Into Residential Sales
Backup power, not grid revenue, is what households are buying today. A vehicle-to-home system turns a parked car into several days of stored electricity for essential circuits, and in storm-exposed or wildfire-exposed service territories that proposition sells without any reference to energy markets. Installers report the comparison customers make is against a stationary home battery, where the vehicle already supplies the expensive part.
The causal chain runs through permitting rather than price. A vehicle-to-home installation with a transfer switch that isolates the house from the network is treated as backup equipment, not as an exporting distributed energy resource, so it escapes the long utility study that grid export triggers. UL 1741 listings and the island-mode provisions in IEEE 1547 give inspectors a recognised basis for approval, which is why residential volumes lead commercial ones.
Restraints Impact Analysis
| Restraint | Impact on CAGR Forecast | Geographic Relevance | Impact Timeline |
| Distributed energy resource interconnection review and market rules | High | North America, Europe | Long term ≥4 years |
| Unresolved battery warranty treatment and a thin bidirectional fleet | High | Global | Medium term 2–4 years |
Two structural obstacles, both outside the hardware, explain why deployment lags the engineering.
Interconnection Review and Market Rules Keep Grid Export Commercially Marginal
Exporting to the network makes a vehicle a distributed energy resource, and that single reclassification is the biggest brake on the sector. The utility study, protection review and witness testing that follow can take longer and cost more than the charger, and the process was designed for fixed rooftop solar rather than for an asset that drives away. Many projects stall at this step.
Market design compounds it. A small, mobile, intermittently connected resource rarely qualifies on its own for wholesale energy, capacity or ancillary services, and revenue stacking across wholesale and distribution-level products is restricted in most jurisdictions. The European Union electricity market design rules and the Renewable Energy Directive give aggregators and self-consumers clearer standing, but equivalent access in other regions remains uneven, so the measurable value an operator can actually monetise stays below the engineering value.
Unsettled Warranty Treatment and a Thin Bidirectional Fleet Limit Owner Participation
Owners will not enrol a vehicle whose warranty position is unclear, and manufacturers have not converged on an answer. Some treat grid cycling as ordinary use, some count exported energy against cycle or capacity guarantees, and some stay silent. That ambiguity sits directly between an aggregator and the fleet it needs, and no amount of charger capability removes it.
Underneath sits a supply problem. Only a fraction of electric vehicles already sold support export at all, because the capability requires specific inverter hardware, a battery management strategy that tolerates extra cycling, and software the manufacturer must choose to enable. Fleet operators also price the residual-value risk of a battery with unknown extra throughput. Until warranty language and state-of-health reporting are standard, the addressable fleet stays a small share of electric vehicles on the road.
Market Opportunities
Electric School Bus and Depot Fleets Open a Contracted Capacity Revenue Pool
School buses are the clearest commercial case in bidirectional charging, and they open a revenue pool built on contracts rather than spot markets. Their duty cycle is known to the minute, they sit idle through long summer periods that coincide with peak system demand, and a single depot aggregates megawatt-hours behind one interconnection point instead of hundreds. That lets a utility negotiate firm capacity rather than hope for voluntary response.
School districts, transit authorities and logistics depots are the buyers, and they are already purchasing electric vehicles for emissions reasons, so the bidirectional increment is marginal spend. Aggregation and energy management platforms capture the recurring share, while charger vendors capture the hardware. Streamlined interconnection rules for depot-scale resources, where they exist, convert this from a demonstration into a procurable utility programme with measurable payments.
Behind-the-Meter Vehicle-to-Building Projects Open a Commercial Demand-Charge Revenue Pool
Vehicle-to-building sidesteps the export problem entirely and opens a revenue pool tied to commercial tariffs. A fleet parked at an office, warehouse or hospital can shave the site’s monthly demand peak, and demand charges often make up a large share of a commercial electricity bill. Because the energy never crosses the meter, the project avoids the distributed energy resource study that blocks grid export.
Facility owners, campus operators and logistics firms create the demand, usually alongside solar and a building management system that already measures load. Energy management software vendors are best placed to capture it, since the saving depends on forecasting and control rather than on hardware. Interoperability work under ISO 15118-20 and inverter listings under UL 1741 let integrators treat mixed vehicle fleets as one controllable asset within the building.
Segment Analysis
By Component: Hardware Leads While Software Builds the Recurring Layer
Hardware accounted for 58% of 2026 revenue because every deployment starts with a physical bidirectional charger or a vehicle-resident inverter, and those units carry the highest unit price in the chain. Bidirectional chargers cost considerably more than comparable unidirectional equipment, so even a small installed base produces most of the measurable spend. Services, covering interconnection applications, commissioning and maintenance, take the second position.
Software is the fastest-growing component at a 33.1% CAGR through 2033. Aggregation and energy management platforms turn scattered vehicles into one dispatchable resource, handle metering and settlement, and manage communication under ISO 15118-20 and OpenADR. Their value rises with fleet size rather than with unit shipments. The business implication is a gradual shift from one-time equipment margin toward subscription and performance-based revenue, which favours vendors that control the dispatch layer rather than the enclosure.
By Charger Topology: DC Bidirectional Units Lead as Onboard Inverters Accelerate
DC bidirectional charging held 48% of the 2026 market. Off-board DC units place the inverter outside the vehicle, which lets a manufacturer support export without redesigning the car, and they handle the higher power levels that depot and commercial sites need. Most early fleet projects therefore specified DC equipment, and CHAdeMO sites remain a visible part of the installed base.
Onboard bidirectional inverters are the fastest-growing topology at a 32.8% CAGR. Putting the inverter in the vehicle allows a far cheaper wall-side unit, which matters most in residential vehicle-to-home sales where total installed cost decides the purchase. SAE J3072 defines how a vehicle-resident inverter interconnects with a distribution network, giving utilities a recognised basis for approval. AC bidirectional equipment occupies the remainder. The implication is a long-run cost floor well below today’s DC-led pricing.
By Application: Vehicle-to-Home Leads While Vehicle-to-Building Scales Faster
Vehicle-to-home represented 44% of 2026 revenue and is the nearer-term commercial reality in this sector. It avoids utility export review, sells on resilience rather than on arbitrage, and competes against stationary home batteries on installed cost. Vehicle-to-grid proper, despite giving the market its name, remains the smaller commercial category because interconnection and market access restrict what an operator can earn.
Vehicle-to-building is the fastest-growing application at a 31.2% CAGR through 2033. Commercial sites combine a parked fleet, measurable demand charges and an existing building management system, so the saving is easy to verify. Vehicle-to-load, which powers tools and appliances directly from the vehicle, is widely available but carries little dedicated infrastructure spend. The implication for vendors is that behind-the-meter products will fund the sector while grid-facing revenue matures.
By Vehicle Type: Passenger Cars Lead While School Buses Grow Fastest
Passenger cars held 51% of the 2026 market, a direct reflection of the residential vehicle-to-home demand that dominates current sales. The installed base is large, the purchase decision is made by one household, and the equipment is relatively small. A growing number of pickup and crossover platforms ship with export capability as a listed feature, which widens the addressable pool each model year.
School buses are the fastest-growing vehicle type at a 34.2% CAGR through 2033. Their value rests on idle time rather than on battery size: a bus parked through summer is available precisely when grid stress peaks in much of North America. Transit buses and commercial fleet vehicles follow, supported by depot charging that concentrates capacity behind one connection. The implication is that fleet procurement cycles, not consumer preference, will set the pace of grid-facing deployment.
Geography Analysis
Which Region Is Leading the Vehicle-to-Grid Technology Market?
North America leads the vehicle-to-grid technology market with 41% share in 2026. The United States and Canada combine high residential outage exposure, strong pickup and sport utility electrification, and public funding for electric school buses, which is the clearest fleet use case anywhere. State regulators in California, New York and Massachusetts have moved furthest on rules that recognise bidirectional resources and on interconnection pathways for vehicle-resident inverters under SAE J3072. Utility pilot programmes in the region have progressed from single-bus demonstrations to multi-depot procurements with contracted availability payments. The main barrier remains the interconnection queue, where a study can outlast the funding cycle that paid for the vehicles. The clearest regional change is the shift of utility attention from passenger-car pilots toward depot-scale aggregation, where one application covers many vehicles.
Europe Converts Aggregation Rights Into Workable Market Access
Europe holds 32% of 2026 revenue and has the most developed rules for third-party aggregation of small flexible assets. The European Union electricity market design framework and the Renewable Energy Directive establish rights to self-consumption, energy sharing and participation through an independent aggregator, which gives bidirectional fleets a legal route into balancing and flexibility markets. The Netherlands, Denmark, Germany, France and the United Kingdom host the deepest activity, helped by high retail tariffs and dense distribution networks. Grid connection constraints in several countries make flexible load genuinely valuable, so network operators have reason to pay for it. Low penetration of air conditioning limits the summer peak that makes the fleet case elsewhere. The region’s opportunity sits in distribution-level flexibility tenders that accept small aggregated resources.
Which Region Is Growing Fastest in the Vehicle-to-Grid Technology Market?
Asia Pacific is growing fastest, at a 32.4% CAGR between 2026 and 2033, from a smaller base than the leading region. Japan supplies the longest operating history, since CHAdeMO carried bidirectional capability earlier than other connector families and household backup power is a familiar purchase after major seismic events. China contributes scale through the sheer volume of electric vehicles sold and through national standards work on bidirectional charging interfaces. South Korea, Australia and India are earlier, with Australia notable for high rooftop solar penetration that makes household energy shifting attractive. Grid codes and metering rules differ by country, so vendors cannot reuse one integration across the region. Apartment-block charging retrofits are the distinctive regional opportunity, because they concentrate many vehicles behind shared infrastructure.
Latin America Builds From Backup Power Rather Than Market Participation
Latin America accounts for 3% of 2026 revenue, the smallest regional share alongside the emerging markets of the Middle East and Africa. Brazil, Mexico, Chile and Colombia lead the limited activity, concentrated in commercial fleets and in premium residential installations. The practical driver is supply reliability: where distribution networks experience frequent interruptions, a bidirectional vehicle has obvious household value regardless of tariff design. Barriers are substantial. Electric vehicle penetration remains low, few locally sold models support export, import duties raise equipment cost, and distribution utilities have no established procedure for connecting a mobile distributed energy resource. Certified installer capacity is also scarce. The regional opportunity lies in commercial and industrial sites that already own backup generation and can justify replacing diesel runtime with stored vehicle energy.
Middle East & Africa Advances Through Utility-Led Pilots in a Few Markets
Middle East & Africa holds 3% of 2026 revenue, with activity concentrated in the United Arab Emirates, Saudi Arabia, Israel and South Africa. In the Gulf states, utility-led smart grid programmes and government fleet electrification create the main openings, and summer cooling peaks give stored energy a clear system value. South Africa presents a different case, where sustained load shedding has normalised household and commercial backup investment and makes a bidirectional vehicle an understandable substitute for a generator. Barriers dominate elsewhere on the continent: thin electric vehicle fleets, limited charging infrastructure, weak network capacity and no interconnection rulebook for exporting assets. Equipment certification also depends on standards written for other climates. The opportunity rests with large government and corporate fleets that charge at a single depot under one connection agreement.
Competitive Landscape
The vehicle-to-grid technology market has low concentration, which is normal for a sector where no segment has yet reached volume. Participants come from four unrelated backgrounds: electric vehicle supply equipment makers, power electronics and grid equipment groups, software-first aggregators, and vehicle manufacturers enabling export on their own platforms. No participant controls the full chain from vehicle inverter to market settlement, and the small absolute revenue pool has not yet justified large-scale consolidation. Several early specialists remain venture-funded rather than profitable, and some entrants have withdrawn from charging businesses after reassessing timelines.
Competition rests on interconnection experience, certification coverage and platform breadth rather than on charger price. Winning a utility programme depends on whether a vendor can carry an application through a distribution operator’s review, hold current listings under UL 1741 and demonstrate compliance with IEEE 1547, and support the specific vehicle models a fleet already owns. Software vendors compete on how many utility and market interfaces they already operate, since each new balancing market is a separate integration. New entrants arrive mainly from the stationary storage inverter side, where the power electronics are closely related.
Strategic activity concentrates on partnerships rather than acquisitions. Charger makers pair with aggregators to offer a complete programme to a utility, vehicle manufacturers work with energy retailers to bundle home systems with tariffs, and grid equipment groups position bidirectional charging within broader distributed energy portfolios. These arrangements matter because no single party can satisfy a utility’s technical, commercial and warranty requirements alone.
Strategic direction is converging on two themes: moving the inverter into the vehicle to cut installed cost, and building behind-the-meter products that generate revenue without waiting for market reform.
Vehicle-to-Grid Technology Industry Leaders
- Wallbox NV
- Fermata Energy
- Nuvve Holding Corp.
- The Mobility House
- Hitachi Energy
Recent Industry Developments
- April 2022: The International Organization for Standardization published ISO 15118-20, which adds bidirectional power transfer to the vehicle-to-charger communication standard – the single enabling step that lets vehicles and chargers from different makers negotiate export.
- October 2023: California enacted legislation authorising its regulators to require bidirectional capability in light-duty electric vehicles sold in the state – the first mandate-capable instrument of its kind, and the reason manufacturers now treat export as a platform decision.
- July 2024: The European Union electricity market design reform package entered into force, strengthening rights to energy sharing and to participation through independent aggregators – the clearest legal basis anywhere for pooling small vehicle batteries into a tradeable resource.
Companies Covered in the Report
- Wallbox NV
- Fermata Energy
- Nuvve Holding Corp.
- The Mobility House
- dcbel Inc.
- Hitachi Energy Ltd.
- ABB Ltd.
- Siemens AG
- Schneider Electric SE
- Nissan Motor Co., Ltd.
- Ford Motor Company
- BYD Company Limited
- Delta Electronics, Inc.
- Kempower Oyj
Vehicle-to-Grid Technology Market Report Scope
This report covers hardware, software and services that let an electric vehicle export energy as well as import it, including bidirectional chargers, vehicle-side capability, aggregation platforms, interoperability software, metering and settlement, and grid interconnection services. Unidirectional charging infrastructure is covered separately and is not counted here. The base year is 2025 and the forecast period runs from 2026 to 2033, with all values in US$ Billion.
Component
- Hardware
- Software
- Services
Charger Topology
- AC Bidirectional Charging
- DC Bidirectional Charging
- Onboard Bidirectional Inverters
Application
- Vehicle-to-Grid
- Vehicle-to-Home
- Vehicle-to-Building
- Vehicle-to-Load
Vehicle Type
- Passenger Cars
- School Buses
- Transit Buses
- Commercial and Fleet Vehicles
Regions
- North America
- Europe
- Asia Pacific
- Latin America
- Middle East & Africa
Key Questions Answered in the Report
How large is the vehicle-to-grid technology market in 2026?
The market is valued at US$ 1.2 billion in 2026, a deliberately small figure that reflects how little bidirectional capacity is commercially deployed today.
What is the forecast size and CAGR of the vehicle-to-grid technology market?
Revenue is projected to reach US$ 6.9 billion by 2033, a 28.4% CAGR and an absolute dollar opportunity of US$ 5.7 billion over seven years.
Which component segment leads the vehicle-to-grid technology market?
Hardware leads with 58% share in 2026, because bidirectional chargers and vehicle-side inverters carry the highest unit cost in every installation.
Which application is growing fastest in vehicle-to-grid technology?
Vehicle-to-building grows fastest at a 31.2% CAGR, since behind-the-meter projects cut demand charges without triggering utility export review.
Which region holds the largest vehicle-to-grid technology market share?
North America holds 41% share in 2026, supported by electric school bus funding, outage exposure and state rules recognising bidirectional resources.
1. Executive Summary
1.1. Global Vehicle-to-Grid Technology Market Snapshot
1.2. Future Projections
1.3. Key Report Takeaways
1.4. Regional Snapshot
2. Market Overview
2.1. Market Definition and Report Scope
2.2. Historical Trends 2020–2025
2.3. Market Dynamics
2.3.1. Drivers
2.3.1.1. Common Bidirectional Signalling Under ISO 15118-20 Is Widening Vehicle Support
2.3.1.2. Outage Resilience Is Pulling Vehicle-to-Home Systems Into Residential Sales
2.3.2. Restraints
2.3.2.1. Interconnection Review and Market Rules Keep Grid Export Commercially Marginal
2.3.2.2. Unsettled Warranty Treatment and a Thin Bidirectional Fleet Limit Owner Participation
2.3.3. Market Opportunities
2.3.3.1. Electric School Bus and Depot Fleets Open a Contracted Capacity Revenue Pool
2.3.3.2. Behind-the-Meter Vehicle-to-Building Projects Open a Commercial Demand-Charge Revenue Pool
3. Global Vehicle-to-Grid Technology Market Outlook, 2020–2033
3.1. Global Vehicle-to-Grid Technology Market Outlook, by Component, Value (US$ Billion), 2020–2033
3.1.1. Hardware
3.1.2. Software
3.1.3. Services
3.2. Global Vehicle-to-Grid Technology Market Outlook, by Charger Topology, Value (US$ Billion), 2020–2033
3.2.1. AC Bidirectional Charging
3.2.2. DC Bidirectional Charging
3.2.3. Onboard Bidirectional Inverters
3.3. Global Vehicle-to-Grid Technology Market Outlook, by Application, Value (US$ Billion), 2020–2033
3.3.1. Vehicle-to-Grid
3.3.2. Vehicle-to-Home
3.3.3. Vehicle-to-Building
3.3.4. Vehicle-to-Load
3.4. Global Vehicle-to-Grid Technology Market Outlook, by Vehicle Type, Value (US$ Billion), 2020–2033
3.4.1. Passenger Cars
3.4.2. School Buses
3.4.3. Transit Buses
3.4.4. Commercial and Fleet Vehicles
3.5. Global Vehicle-to-Grid Technology Market Outlook, by Region, Value (US$ Billion), 2020–2033
3.5.1. North America
3.5.2. Europe
3.5.3. Asia Pacific
3.5.4. Latin America
3.5.5. Middle East & Africa
4. North America Vehicle-to-Grid Technology Market Outlook, 2020–2033
4.1. North America Vehicle-to-Grid Technology Market Outlook, by Component, Value (US$ Billion), 2020–2033
4.1.1. Hardware
4.1.2. Software
4.1.3. Services
4.2. North America Vehicle-to-Grid Technology Market Outlook, by Charger Topology, Value (US$ Billion), 2020–2033
4.2.1. AC Bidirectional Charging
4.2.2. DC Bidirectional Charging
4.2.3. Onboard Bidirectional Inverters
4.3. North America Vehicle-to-Grid Technology Market Outlook, by Application, Value (US$ Billion), 2020–2033
4.3.1. Vehicle-to-Grid
4.3.2. Vehicle-to-Home
4.3.3. Vehicle-to-Building
4.3.4. Vehicle-to-Load
4.4. North America Vehicle-to-Grid Technology Market Outlook, by Vehicle Type, Value (US$ Billion), 2020–2033
4.4.1. Passenger Cars
4.4.2. School Buses
4.4.3. Transit Buses
4.4.4. Commercial and Fleet Vehicles
4.5. North America Vehicle-to-Grid Technology Market Outlook, by Country, Value (US$ Billion), 2020–2033
4.5.1. United States Vehicle-to-Grid Technology Market Outlook, by Component, 2020–2033
4.5.2. United States Vehicle-to-Grid Technology Market Outlook, by Charger Topology, 2020–2033
4.5.3. United States Vehicle-to-Grid Technology Market Outlook, by Application, 2020–2033
4.5.4. United States Vehicle-to-Grid Technology Market Outlook, by Vehicle Type, 2020–2033
4.5.5. Canada Vehicle-to-Grid Technology Market Outlook, by Component, 2020–2033
4.5.6. Canada Vehicle-to-Grid Technology Market Outlook, by Charger Topology, 2020–2033
4.5.7. Canada Vehicle-to-Grid Technology Market Outlook, by Application, 2020–2033
4.5.8. Canada Vehicle-to-Grid Technology Market Outlook, by Vehicle Type, 2020–2033
5. Europe Vehicle-to-Grid Technology Market Outlook, 2020–2033
5.1. Europe Vehicle-to-Grid Technology Market Outlook, by Component, Value (US$ Billion), 2020–2033
5.1.1. Hardware
5.1.2. Software
5.1.3. Services
5.2. Europe Vehicle-to-Grid Technology Market Outlook, by Charger Topology, Value (US$ Billion), 2020–2033
5.2.1. AC Bidirectional Charging
5.2.2. DC Bidirectional Charging
5.2.3. Onboard Bidirectional Inverters
5.3. Europe Vehicle-to-Grid Technology Market Outlook, by Application, Value (US$ Billion), 2020–2033
5.3.1. Vehicle-to-Grid
5.3.2. Vehicle-to-Home
5.3.3. Vehicle-to-Building
5.3.4. Vehicle-to-Load
5.4. Europe Vehicle-to-Grid Technology Market Outlook, by Vehicle Type, Value (US$ Billion), 2020–2033
5.4.1. Passenger Cars
5.4.2. School Buses
5.4.3. Transit Buses
5.4.4. Commercial and Fleet Vehicles
5.5. Europe Vehicle-to-Grid Technology Market Outlook, by Country, Value (US$ Billion), 2020–2033
5.5.1. Netherlands Vehicle-to-Grid Technology Market Outlook, by Component, 2020–2033
5.5.2. Netherlands Vehicle-to-Grid Technology Market Outlook, by Charger Topology, 2020–2033
5.5.3. Netherlands Vehicle-to-Grid Technology Market Outlook, by Application, 2020–2033
5.5.4. Netherlands Vehicle-to-Grid Technology Market Outlook, by Vehicle Type, 2020–2033
5.5.5. Denmark Vehicle-to-Grid Technology Market Outlook, by Component, 2020–2033
5.5.6. Denmark Vehicle-to-Grid Technology Market Outlook, by Charger Topology, 2020–2033
5.5.7. Denmark Vehicle-to-Grid Technology Market Outlook, by Application, 2020–2033
5.5.8. Denmark Vehicle-to-Grid Technology Market Outlook, by Vehicle Type, 2020–2033
5.5.9. Germany Vehicle-to-Grid Technology Market Outlook, by Component, 2020–2033
5.5.10. Germany Vehicle-to-Grid Technology Market Outlook, by Charger Topology, 2020–2033
5.5.11. Germany Vehicle-to-Grid Technology Market Outlook, by Application, 2020–2033
5.5.12. Germany Vehicle-to-Grid Technology Market Outlook, by Vehicle Type, 2020–2033
5.5.13. France Vehicle-to-Grid Technology Market Outlook, by Component, 2020–2033
5.5.14. France Vehicle-to-Grid Technology Market Outlook, by Charger Topology, 2020–2033
5.5.15. France Vehicle-to-Grid Technology Market Outlook, by Application, 2020–2033
5.5.16. France Vehicle-to-Grid Technology Market Outlook, by Vehicle Type, 2020–2033
5.5.17. United Kingdom Vehicle-to-Grid Technology Market Outlook, by Component, 2020–2033
5.5.18. United Kingdom Vehicle-to-Grid Technology Market Outlook, by Charger Topology, 2020–2033
5.5.19. United Kingdom Vehicle-to-Grid Technology Market Outlook, by Application, 2020–2033
5.5.20. United Kingdom Vehicle-to-Grid Technology Market Outlook, by Vehicle Type, 2020–2033
6. Asia Pacific Vehicle-to-Grid Technology Market Outlook, 2020–2033
6.1. Asia Pacific Vehicle-to-Grid Technology Market Outlook, by Component, Value (US$ Billion), 2020–2033
6.1.1. Hardware
6.1.2. Software
6.1.3. Services
6.2. Asia Pacific Vehicle-to-Grid Technology Market Outlook, by Charger Topology, Value (US$ Billion), 2020–2033
6.2.1. AC Bidirectional Charging
6.2.2. DC Bidirectional Charging
6.2.3. Onboard Bidirectional Inverters
6.3. Asia Pacific Vehicle-to-Grid Technology Market Outlook, by Application, Value (US$ Billion), 2020–2033
6.3.1. Vehicle-to-Grid
6.3.2. Vehicle-to-Home
6.3.3. Vehicle-to-Building
6.3.4. Vehicle-to-Load
6.4. Asia Pacific Vehicle-to-Grid Technology Market Outlook, by Vehicle Type, Value (US$ Billion), 2020–2033
6.4.1. Passenger Cars
6.4.2. School Buses
6.4.3. Transit Buses
6.4.4. Commercial and Fleet Vehicles
6.5. Asia Pacific Vehicle-to-Grid Technology Market Outlook, by Country, Value (US$ Billion), 2020–2033
6.5.1. Japan Vehicle-to-Grid Technology Market Outlook, by Component, 2020–2033
6.5.2. Japan Vehicle-to-Grid Technology Market Outlook, by Charger Topology, 2020–2033
6.5.3. Japan Vehicle-to-Grid Technology Market Outlook, by Application, 2020–2033
6.5.4. Japan Vehicle-to-Grid Technology Market Outlook, by Vehicle Type, 2020–2033
6.5.5. China Vehicle-to-Grid Technology Market Outlook, by Component, 2020–2033
6.5.6. China Vehicle-to-Grid Technology Market Outlook, by Charger Topology, 2020–2033
6.5.7. China Vehicle-to-Grid Technology Market Outlook, by Application, 2020–2033
6.5.8. China Vehicle-to-Grid Technology Market Outlook, by Vehicle Type, 2020–2033
6.5.9. South Korea Vehicle-to-Grid Technology Market Outlook, by Component, 2020–2033
6.5.10. South Korea Vehicle-to-Grid Technology Market Outlook, by Charger Topology, 2020–2033
6.5.11. South Korea Vehicle-to-Grid Technology Market Outlook, by Application, 2020–2033
6.5.12. South Korea Vehicle-to-Grid Technology Market Outlook, by Vehicle Type, 2020–2033
6.5.13. Australia Vehicle-to-Grid Technology Market Outlook, by Component, 2020–2033
6.5.14. Australia Vehicle-to-Grid Technology Market Outlook, by Charger Topology, 2020–2033
6.5.15. Australia Vehicle-to-Grid Technology Market Outlook, by Application, 2020–2033
6.5.16. Australia Vehicle-to-Grid Technology Market Outlook, by Vehicle Type, 2020–2033
6.5.17. India Vehicle-to-Grid Technology Market Outlook, by Component, 2020–2033
6.5.18. India Vehicle-to-Grid Technology Market Outlook, by Charger Topology, 2020–2033
6.5.19. India Vehicle-to-Grid Technology Market Outlook, by Application, 2020–2033
6.5.20. India Vehicle-to-Grid Technology Market Outlook, by Vehicle Type, 2020–2033
7. Latin America Vehicle-to-Grid Technology Market Outlook, 2020–2033
7.1. Latin America Vehicle-to-Grid Technology Market Outlook, by Component, Value (US$ Billion), 2020–2033
7.1.1. Hardware
7.1.2. Software
7.1.3. Services
7.2. Latin America Vehicle-to-Grid Technology Market Outlook, by Charger Topology, Value (US$ Billion), 2020–2033
7.2.1. AC Bidirectional Charging
7.2.2. DC Bidirectional Charging
7.2.3. Onboard Bidirectional Inverters
7.3. Latin America Vehicle-to-Grid Technology Market Outlook, by Application, Value (US$ Billion), 2020–2033
7.3.1. Vehicle-to-Grid
7.3.2. Vehicle-to-Home
7.3.3. Vehicle-to-Building
7.3.4. Vehicle-to-Load
7.4. Latin America Vehicle-to-Grid Technology Market Outlook, by Vehicle Type, Value (US$ Billion), 2020–2033
7.4.1. Passenger Cars
7.4.2. School Buses
7.4.3. Transit Buses
7.4.4. Commercial and Fleet Vehicles
7.5. Latin America Vehicle-to-Grid Technology Market Outlook, by Country, Value (US$ Billion), 2020–2033
7.5.1. Brazil Vehicle-to-Grid Technology Market Outlook, by Component, 2020–2033
7.5.2. Brazil Vehicle-to-Grid Technology Market Outlook, by Charger Topology, 2020–2033
7.5.3. Brazil Vehicle-to-Grid Technology Market Outlook, by Application, 2020–2033
7.5.4. Brazil Vehicle-to-Grid Technology Market Outlook, by Vehicle Type, 2020–2033
7.5.5. Mexico Vehicle-to-Grid Technology Market Outlook, by Component, 2020–2033
7.5.6. Mexico Vehicle-to-Grid Technology Market Outlook, by Charger Topology, 2020–2033
7.5.7. Mexico Vehicle-to-Grid Technology Market Outlook, by Application, 2020–2033
7.5.8. Mexico Vehicle-to-Grid Technology Market Outlook, by Vehicle Type, 2020–2033
7.5.9. Chile Vehicle-to-Grid Technology Market Outlook, by Component, 2020–2033
7.5.10. Chile Vehicle-to-Grid Technology Market Outlook, by Charger Topology, 2020–2033
7.5.11. Chile Vehicle-to-Grid Technology Market Outlook, by Application, 2020–2033
7.5.12. Chile Vehicle-to-Grid Technology Market Outlook, by Vehicle Type, 2020–2033
7.5.13. Colombia Vehicle-to-Grid Technology Market Outlook, by Component, 2020–2033
7.5.14. Colombia Vehicle-to-Grid Technology Market Outlook, by Charger Topology, 2020–2033
7.5.15. Colombia Vehicle-to-Grid Technology Market Outlook, by Application, 2020–2033
7.5.16. Colombia Vehicle-to-Grid Technology Market Outlook, by Vehicle Type, 2020–2033
8. Middle East & Africa Vehicle-to-Grid Technology Market Outlook, 2020–2033
8.1. Middle East & Africa Vehicle-to-Grid Technology Market Outlook, by Component, Value (US$ Billion), 2020–2033
8.1.1. Hardware
8.1.2. Software
8.1.3. Services
8.2. Middle East & Africa Vehicle-to-Grid Technology Market Outlook, by Charger Topology, Value (US$ Billion), 2020–2033
8.2.1. AC Bidirectional Charging
8.2.2. DC Bidirectional Charging
8.2.3. Onboard Bidirectional Inverters
8.3. Middle East & Africa Vehicle-to-Grid Technology Market Outlook, by Application, Value (US$ Billion), 2020–2033
8.3.1. Vehicle-to-Grid
8.3.2. Vehicle-to-Home
8.3.3. Vehicle-to-Building
8.3.4. Vehicle-to-Load
8.4. Middle East & Africa Vehicle-to-Grid Technology Market Outlook, by Vehicle Type, Value (US$ Billion), 2020–2033
8.4.1. Passenger Cars
8.4.2. School Buses
8.4.3. Transit Buses
8.4.4. Commercial and Fleet Vehicles
8.5. Middle East & Africa Vehicle-to-Grid Technology Market Outlook, by Country, Value (US$ Billion), 2020–2033
8.5.1. United Arab Emirates Vehicle-to-Grid Technology Market Outlook, by Component, 2020–2033
8.5.2. United Arab Emirates Vehicle-to-Grid Technology Market Outlook, by Charger Topology, 2020–2033
8.5.3. United Arab Emirates Vehicle-to-Grid Technology Market Outlook, by Application, 2020–2033
8.5.4. United Arab Emirates Vehicle-to-Grid Technology Market Outlook, by Vehicle Type, 2020–2033
8.5.5. Saudi Arabia Vehicle-to-Grid Technology Market Outlook, by Component, 2020–2033
8.5.6. Saudi Arabia Vehicle-to-Grid Technology Market Outlook, by Charger Topology, 2020–2033
8.5.7. Saudi Arabia Vehicle-to-Grid Technology Market Outlook, by Application, 2020–2033
8.5.8. Saudi Arabia Vehicle-to-Grid Technology Market Outlook, by Vehicle Type, 2020–2033
8.5.9. Israel Vehicle-to-Grid Technology Market Outlook, by Component, 2020–2033
8.5.10. Israel Vehicle-to-Grid Technology Market Outlook, by Charger Topology, 2020–2033
8.5.11. Israel Vehicle-to-Grid Technology Market Outlook, by Application, 2020–2033
8.5.12. Israel Vehicle-to-Grid Technology Market Outlook, by Vehicle Type, 2020–2033
8.5.13. South Africa Vehicle-to-Grid Technology Market Outlook, by Component, 2020–2033
8.5.14. South Africa Vehicle-to-Grid Technology Market Outlook, by Charger Topology, 2020–2033
8.5.15. South Africa Vehicle-to-Grid Technology Market Outlook, by Application, 2020–2033
8.5.16. South Africa Vehicle-to-Grid Technology Market Outlook, by Vehicle Type, 2020–2033
9. Competitive Landscape
9.1. Market Concentration and Industry Leaders
9.2. Competitive Differentiation
9.3. Strategic Moves and Market Direction
9.4. Recent Industry Developments
9.5. Company Profiles
9.5.1. Wallbox NV
9.5.2. Fermata Energy
9.5.3. Nuvve Holding Corp.
9.5.4. The Mobility House
9.5.5. dcbel Inc.
9.5.6. Hitachi Energy Ltd.
9.5.7. ABB Ltd.
9.5.8. Siemens AG
9.5.9. Schneider Electric SE
9.5.10. Nissan Motor Co., Ltd.
9.5.11. Ford Motor Company
9.5.12. BYD Company Limited
9.5.13. Delta Electronics, Inc.
9.5.14. Kempower Oyj
10. Appendix
10.1. Research Methodology
10.2. Report Assumptions
10.3. Acronyms and Abbreviations
| Component | Hardware, Software, Services |
| Charger Topology | AC Bidirectional Charging, DC Bidirectional Charging, Onboard Bidirectional Inverters |
| Application | Vehicle-to-Grid, Vehicle-to-Home, Vehicle-to-Building, Vehicle-to-Load |
| Vehicle Type | Passenger Cars, School Buses, Transit Buses, Commercial and Fleet Vehicles |
| Regions | North America, Europe, Asia Pacific, Latin America, Middle East & Africa |
Our Research Methodology
Considering the volatility of business today, traditional approaches to strategizing a game plan can be unfruitful if not detrimental. True ambiguity is no way to determine a forecast. A myriad of predetermined factors must be accounted for such as the degree of risk involved, the magnitude of circumstances, as well as conditions or consequences that are not known or unpredictable. To circumvent binary views that cast uncertainty, the application of market research intelligence to strategically posture, move, and enable actionable outcomes is necessary.
View Methodology
Quality Assured
Rigorous Validation Process

Confidentiality Assured
End-to-end Data Security

Custom Research Services
Tailored To Your Objectives
FAQs
The market is valued at US$ 1.2 billion in 2026, a deliberately small figure that reflects how little bidirectional capacity is commercially deployed today.
Revenue is projected to reach US$ 6.9 billion by 2033, a 28.4% CAGR and an absolute dollar opportunity of US$ 5.7 billion over seven years.
Hardware leads with 58% share in 2026, because bidirectional chargers and vehicle-side inverters carry the highest unit cost in every installation.
Vehicle-to-building grows fastest at a 31.2% CAGR, since behind-the-meter projects cut demand charges without triggering utility export review.
North America holds 41% share in 2026, supported by electric school bus funding, outage exposure and state rules recognising bidirectional resources.
Related Reports
Synchronous Condenser Market Size, Share, Insights, Competitive Landscape, and Forecast 2026 to 2033
The global synchronous condenser market is valued at US$1.20 billion in 2026, reaching US$1.50 billion by 2033, growing at a 3.2% CAGR
Water and Wastewater Treatment Market Size, Share, Insights, Competitive Landscape, and Forecast 2026 to 2033
Water and wastewater treatment market to reach US$ 508.0 billion by 2033 from US$ 345.0 billion in 2026 at a 5.7% CAGR. Explore trends, segments and regions.
Offshore Oil and Gas Equipment Market Size, Share, Insights, Competitive Landscape, and Forecast 2026 to 2033
The offshore oil and gas equipment market is projected to grow from US$94.0 billion in 2026 to US$138.0 billion by 2033, at a 5.6% CAGR. Explore trends.
Floating Storage and Regasification Unit Market Size, Share, Insights, Competitive Landscape, and Forecast 2026 to 2033
Floating storage and regasification unit market to grow from US$8.96 Bn in 2026 to US$13.92 Bn by 2033 at 6.5% CAGR. Explore types, mooring and regions.
Floating Solar Market Size, Share, Insights, Competitive Landscape, and Forecast 2026 to 2033
Floating solar market to grow from US$1.60 Bn in 2026 to US$4.02 Bn by 2033 at 14.1% CAGR. Explore capacities, products, locations and regional trends.
Offshore Grid Connection Solutions Market Size, Share, Insights, Competitive Landscape, and Forecast 2026 to 2033
Offshore grid connection solutions market to reach US$ 5.71 billion by 2033 at a 6.7% CAGR. Explore HVDC, subsea cables, applications and regional trends.