



Biochar Gasification Market
Biochar Gasification Market Size, Share, Insights, Competitive Landscape, and Forecast 2026 to 2033
Biochar Gasification Market Size and Trend Analysis
How Big Is the Biochar Gasification Market in 2026?
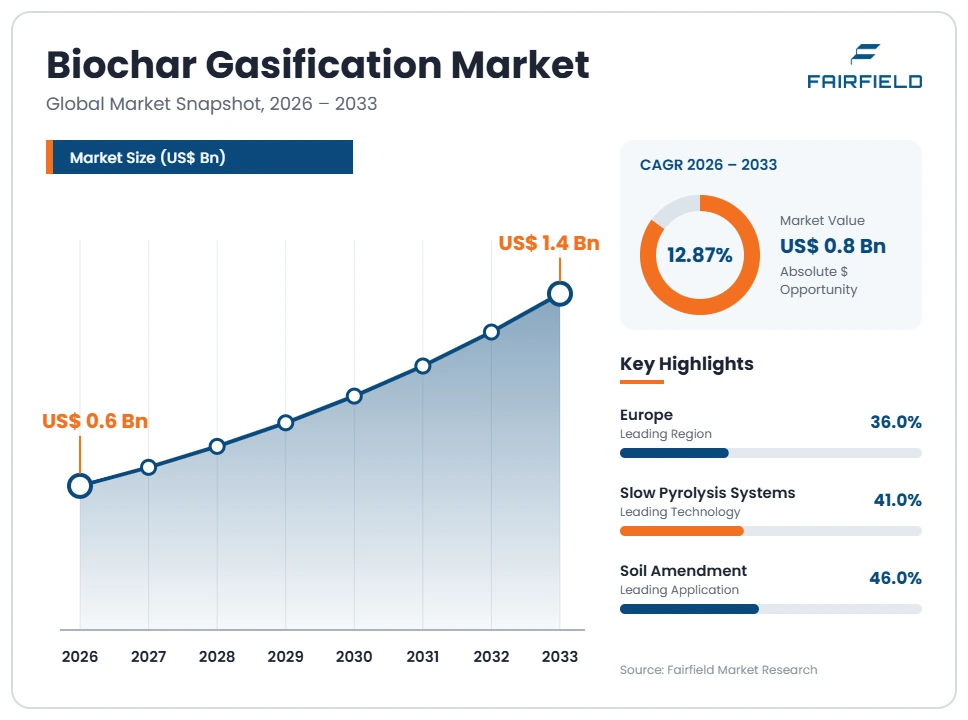
The global Biochar Gasification market size is expected to be valued at US$ 0.6 billion in 2026 and projected to reach US$ 1.4 billion by 2033, growing at a CAGR of 12.87% between 2026 and 2033.
The sector grew at roughly an 11.0% CAGR between 2020 and 2025, from a very small base of farm, sawmill and municipal installations. Three factors explain the outlook. Carbon removal purchases now pay a meaningful part of plant revenue, which turns marginal projects into financeable ones. European fertilising product rules created a legal route to sell pyrolysis and gasification char as a soil improver. Sawmills, digestate operators and food processors face rising disposal costs for residues they can instead convert on site. The market stays small in absolute terms because each plant is modest in scale, feedstock must be sourced locally, and gas cleaning remains the engineering step that most often decides whether a unit runs reliably.
Key Report Takeaways
- By Technology: Slow Pyrolysis Systems held 41.0% share in 2026, while Fluidized-Bed Gasification is projected to expand at a 16.4% CAGR through 2033, driven by better temperature control and cleaner product gas at the larger throughputs industrial hosts now want.
- By Component: Gasification & Pyrolysis Reactors held 36.0% share in 2026, while Engineering & Carbon Services is projected to expand at an 18.2% CAGR through 2033, because credit origination, sampling and third-party verification are billed continuously rather than once.
- By Feedstock: Forestry & Sawmill Residues held 44.0% share in 2026, while Manure & Digestate is projected to expand at a 16.9% CAGR through 2033, reflecting nutrient management limits that make on-farm conversion cheaper than hauling material away.
- By Application: Soil Amendment & Agriculture held 46.0% share in 2026, while Construction Materials is projected to expand at a 19.6% CAGR through 2033, supported by concrete admixture trials that lock carbon inside a product with a long service life.
- By Geography: Europe held 36.0% share in 2026, while Asia Pacific is projected to expand at a 15.5% CAGR through 2033, reflecting crop residue burning restrictions and rapid growth in small distributed conversion units.
Global Biochar Gasification Market Trends and Insights
Drivers Impact Analysis
Two commercial forces explain why biochar co-production plants now reach financial close more often than they did five years ago.
| Driver | Impact on CAGR Forecast | Geographic Relevance | Impact Timeline |
| Stacked revenue from energy, char sales and removal credits | High | Europe, North America | Medium term 2–4 years |
| Product and certification rules that make char legally sellable | Medium | Europe, Asia Pacific | Long term ≥4 years |
Stacked Energy, Product and Credit Revenue Makes Biochar Gasification Plants Financeable
Three income streams, not one, are what get these plants built. A gasifier sized for a sawmill or a dairy rarely pays back on displaced heat and power alone, and char rarely pays back on agronomic value alone at the price a farmer will accept. Combining an energy offset, a char product sale and a carbon removal credit changes the arithmetic, and the credit is frequently the margin rather than a bonus.
The mechanism is contractual. Removal buyers sign multi-year offtake agreements at fixed prices per tonne, which banks treat more like a power purchase agreement than a commodity sale. That predictability supports debt. Host sites also avoid residue disposal costs, adding a fourth, quieter saving. Because the credit price can exceed the char price per tonne, project developers now design for measurable carbon durability from the outset rather than optimising purely for gas yield.
Fertilising Product Rules and Removal Certification Open Regulated Demand for Biochar
Regulatory recognition converted biochar from an unclassified residue into a product that can be marketed, and that unlocked agricultural demand. Before harmonised rules existed, char from pyrolysis or gasification sat in an uncertain category between waste and fertiliser, and distributors avoided it. A defined component material route removed that ambiguity for European sellers and gave buyers a compliance basis for purchase.
The causal chain runs through certification and traceability. The European Biochar Certificate and the International Biochar Initiative guidelines set limits for polycyclic aromatic hydrocarbons, heavy metals and carbon content, so a buyer can specify quality rather than trust a supplier. The European Union certification framework for carbon removals and carbon farming adds durability, monitoring and verification rules on top. Together these instruments let a plant sell the same tonne of char into both an agronomic market and a credit market with documented evidence.
Restraints Impact Analysis
Two constraints have limited this sector for decades and still account for most failed installations.
| Restraint | Impact on CAGR Forecast | Geographic Relevance | Impact Timeline |
| Tar formation and gas cleaning failures at small scale | High | Global | Short term ≤2 years |
| Biomass logistics cost and carbon credit price volatility | Medium | Asia Pacific, Latin America, North America | Medium term 2–4 years |
Tar Formation and Gas Cleaning Failures Stall Small-Scale Biochar Gasification Plants
Tar is the classic engineering failure point of small gasifiers, and it has killed more projects in this sector than financing ever has. Condensable organic compounds in the product gas foul heat exchangers, block filters, coat engine valves and corrode downstream equipment. Plants that perform well during commissioning often fail on availability once feedstock moisture and particle size begin to vary in normal operation.
The cause is thermodynamic and economic at once. Complete tar cracking requires high temperature, long residence time or catalytic reforming, and each option adds capital cost that a one-megawatt plant cannot easily carry. Wet or inconsistent feedstock lowers reactor temperature and raises tar yield further. Operators then face a choice between expensive scrubbing with its own wastewater problem, frequent manual cleaning, or accepting low availability that undermines both energy revenue and continuous char output.
Biomass Logistics Cost and Credit Price Volatility Squeeze Biochar Gasification Returns
Two external cost factors compress margins in ways plant designers cannot engineer away. Biomass is bulky, wet and seasonal, so haulage distance quickly dominates delivered feedstock cost, and a plant must sit close to its residue source. Carbon credit prices then move independently of the plant’s performance, which exposes the single revenue line that often decides whether the project is profitable.
The underlying causes are density and market design. Straw, manure and sawmill residues have low bulk density, so trucks reach volume limits before weight limits, and drying consumes energy that would otherwise be sold. On the revenue side, buyer scrutiny of removal credit integrity has increased, and durability accounting rules determine how much of each tonne counts. Variable char quality compounds the problem, since properties shift with feedstock and process conditions, complicating agronomic specification and repeat sales.
Market Opportunities
Concrete Admixture and Construction Uses Lock Biochar Carbon Into Durable Products
Construction materials offer the clearest route to a biochar market that is large, price-tolerant and durable, and that combination is rare in this sector. Adding char to concrete, mortar, asphalt filler or lightweight building panels stores carbon inside an asset with a service life measured in decades. Volumes per project are far higher than agricultural sales, and the buyer is a materials producer rather than a cost-sensitive farmer.
Ready-mix producers, precast manufacturers and admixture formulators are best placed to capture this, with demand created by embodied-carbon limits in public procurement and by green building certification. The European Union certification framework for carbon removals and carbon farming supports the model by recognising storage in long-lived products. Technical work on dosage, water demand and compressive strength is advancing, which matters because construction buyers specify to standards rather than to sustainability claims.
Certified Removal Credits and Metallurgical Biocarbon Open Premium Offtake Pools
Two premium offtake pools are opening at once, and both pay more per tonne than soil amendment does. Certified removal credits let an operator sell a verified durability attribute separately from the physical char. Metallurgical biocarbon, used as a partial replacement for fossil coke and injection coal, addresses a buyer group that consumes carbon in large, contracted volumes and already has strict specifications for fixed carbon, ash and sulphur.
Silicon, ferroalloy and steel producers create the metallurgical demand, while technology companies and corporates with inventory-based climate targets buy the credits. The European Biochar Certificate carbon sink methodology and comparable voluntary market methodologies provide the measurement basis, and third-party verification supplies the audit trail. Operators able to hold consistent fixed carbon content and low ash can serve both pools from one production line.
Segment Analysis
- By Technology: Slow Pyrolysis Leads While Fluidized-Bed Gasification Scales Fastest
Slow Pyrolysis Systems held 41.0% of the market in 2026, because long residence times at moderate temperature maximise solid carbon yield, which is what a project selling char and credits actually wants. Fixed-Bed Gasification followed at 31.0%, favoured at farm and sawmill scale for its simplicity and tolerance of coarse feedstock. Fluidized-Bed Gasification accounted for 19.0% and Fast Pyrolysis & Other Thermochemical Systems for 9.0%.
Fluidized-Bed Gasification is the fastest-growing technology at a 16.4% CAGR through 2033. Uniform temperature distribution, better heat transfer and greater feedstock flexibility suit the larger throughputs that industrial hosts increasingly specify, and product gas needs less downstream conditioning. The business implication is a widening scale split: fixed-bed units remain the volume segment by unit count, while fluidized-bed systems capture the higher-value industrial installations where availability targets are contractual.
- By Component: Reactors Account for Most Capital While Carbon Services Grow Quickest
Gasification & Pyrolysis Reactors held 36.0% of spending in 2026, the single largest component block, since the conversion vessel, feed system and thermal integration dominate capital cost. Gas Cleaning & Conditioning Equipment took 21.0%, reflecting cyclones, filters, scrubbers and tar reformers. Heat & Power Generation Equipment accounted for 18.0%, Engineering & Carbon Services for 13.0%, and Biochar Handling & Activation Equipment for 12.0%.
Engineering & Carbon Services is the fastest-growing component at an 18.2% CAGR through 2033. Credit origination, continuous sampling, laboratory analysis, registry administration and third-party verification recur annually, unlike equipment bought once. Operators increasingly outsource this work because registries demand documentation discipline that small plant teams lack. For suppliers, the implication is that recurring service revenue is becoming a more reliable earnings base than reactor sales, which track a volatile project pipeline.
- By Feedstock: Forestry Residues Dominate Supply as Manure and Digestate Accelerate
Forestry & Sawmill Residues supplied 44.0% of feedstock value in 2026, because sawdust, bark and chips arrive dry, clean, size-consistent and already concentrated at one site. Agricultural Residues contributed 30.0%, chiefly straw, husks, shells and prunings. Manure & Digestate accounted for 14.0% and clean Biogenic Waste Streams, including green waste and screened food processing residues, for 12.0%.
Manure & Digestate is the fastest-growing feedstock at a 16.9% CAGR through 2033. Nutrient application limits in intensive livestock regions make hauling material off-farm expensive, so conversion on site turns a liability into a phosphorus-rich char. Drying energy remains the obstacle. The broader implication is that feedstock choice directly sets product quality, because ash content, nutrient profile and contaminant load vary widely, and that variability is what complicates standard agronomic specification.
- By Application: Soil Amendment Leads While Construction Materials Expand Fastest
Soil Amendment & Agriculture held 46.0% of biochar demand in 2026, supported by water retention, cation exchange and liming benefits in sandy and acidic soils, and by harmonised product rules in Europe. Construction Materials accounted for 16.0%, Animal Feed & Bedding for 14.0%, Filtration & Activated Carbon for 13.0%, and Metallurgical Reduction for 11.0%.
Construction Materials is the fastest-growing application at a 19.6% CAGR through 2033. Concrete admixture and lightweight aggregate uses consume large tonnages per contract and tolerate higher prices than agriculture, because the buyer is managing embodied carbon rather than yield economics. Filtration grades command the highest unit prices but need activation equipment. The implication is a diverging market: agriculture supplies volume and credibility with farmers, while construction and metallurgy supply the growth and the better margins.
Geography Analysis
- North America Builds Biochar Capacity Around Forest Residues and Voluntary Credit Demand
North America held 29.0% of the market in 2026 and is projected to grow at a 12.6% CAGR through 2033. The United States leads activity, with plants concentrated in the Pacific Northwest, the Southeast and the Upper Midwest where sawmill residue, forest thinning material and wildfire fuel reduction supply abundant low-cost biomass at predictable quality.
Voluntary carbon buyers headquartered in the region purchase a large share of global biochar removal credits, which shortens the distance between producer and offtaker. Canada adds capacity through forestry operations in British Columbia and agricultural projects on the prairies. State wildfire mitigation programmes create feedstock supply that would otherwise be burned in piles. The main change ahead is procurement, as public agencies begin specifying soil products and concrete with documented carbon content.
- Which Region Leads the Biochar Gasification Market?
Europe leads the biochar gasification market with 36.0% share in 2026 and a projected 11.8% CAGR through 2033. Leadership rests on regulation rather than feedstock advantage. Harmonised fertilising product rules created a legal route to sell pyrolysis and gasification materials as soil improvers, and the European Biochar Certificate gave buyers a quality standard that predates public regulation by more than a decade.
Germany, Austria, Switzerland, Sweden and Finland host most installed capacity, typically small units attached to district heating networks, sawmills or farms. High heat prices improve the energy leg of the revenue stack. Medium combustion plant emission limits shape gas cleaning specifications and raise capital cost per unit. The change worth watching is the carbon removals certification framework, which should move credit buying from voluntary practice toward audited compliance-grade accounting.
- Which Region Is Growing Fastest in the Biochar Gasification Market?
Asia Pacific is growing fastest in the biochar gasification market, at a 15.5% CAGR through 2033 from 24.0% share in 2026. Crop residue burning restrictions in India and China have created a disposal problem at enormous scale, and distributed conversion units offer farmers and cooperatives an alternative that produces usable gas, heat and a saleable solid.
China manufactures a large share of the world’s small gasifiers and carbonisation kilns, which keeps equipment prices low and shortens delivery times. Japan and South Korea focus on higher-specification units for waste treatment and filtration-grade carbon, while Australia links biochar to soil carbon programmes. The obstacle is verification capacity, since credit buyers require monitoring and sampling discipline that many small operators cannot yet document to registry standards.
- Latin America Links Biochar Output to Agro-Industrial Residue Streams
Latin America held 6.0% of the market in 2026, with a projected 11.5% CAGR to 2033. Brazil dominates, because sugarcane bagasse, eucalyptus plantation residue, coffee husk and rice husk are already collected at processing sites, removing the haulage cost that defeats dispersed feedstock projects elsewhere. Charcoal production for pig iron also gives the region unusual industrial familiarity with biocarbon.
Colombia, Chile and Argentina contribute smaller agricultural projects. Barriers are real: access to project finance is limited, grid connection for surplus power is slow, and domestic buyers rarely pay a premium for certified removal. Most credit revenue therefore depends on export sales to buyers in other regions. The clearest opportunity is metallurgical biocarbon, which uses existing charcoal supply chains and serves an established domestic steel industry.
- Middle East & Africa Faces Feedstock and Finance Barriers Despite Strong Soil Need
Middle East & Africa held 5.0% of the market in 2026 and is forecast to grow at a 10.8% CAGR to 2033, the slowest regional rate. Agronomic need is high, since sandy soils with low organic matter respond well to char amendment and water retention is a direct productivity constraint across much of the region.
South Africa, Kenya, Egypt and the United Arab Emirates host most documented activity, generally pilot scale. Barriers dominate the picture. Biomass is dispersed and often already used for cooking fuel, capital for small industrial plants is scarce and expensive, and verification infrastructure for removal credits is thin. The opportunity lies in cookstove and small kiln programmes that pair household energy with char collection, which suit the region’s feedstock pattern better than centralised plants.
Competitive Landscape
The biochar gasification market is fragmented, and it is likely to stay that way because plant economics favour small units sited next to their feedstock. No supplier holds a dominant global position. European equipment firms with long operating references lead in the mid-size industrial segment, specialist pyrolysis companies serve waste and biosolids applications, and a large population of regional fabricators supplies simple fixed-bed units. A separate group of carbon project developers and verification service providers has grown alongside the equipment base, and some of them influence technology selection more than the equipment vendors do.
Vendors compete mainly on demonstrated availability rather than on efficiency figures. Because tar-related downtime is the sector’s chronic problem, a buyer weighs documented operating hours, maintenance intervals and gas cleaning design far above nameplate conversion rates. Char quality consistency is the second decisive factor, since certification to recognised standards determines both the product price and the credit volume. Price competition is strongest at the small end, where imported units undercut engineered systems but frequently fail certification or emission requirements. New entrants arrive from adjacent sectors, including biogas plant builders, waste treatment engineers and activated carbon producers.
Strategic activity centres on bundling. Equipment suppliers increasingly offer plant supply together with char offtake, credit origination and registry administration, because customers lack the specialist capability to monetise carbon alone. Several firms have moved toward owning and operating plants themselves rather than selling them, capturing credit revenue directly. Partnerships between technology providers and agricultural cooperatives, district heating utilities and concrete producers are the common route to securing both feedstock and an offtake.
Strategic direction is converging on measurement. Firms are investing in continuous sampling, laboratory capability and durability documentation, because the credit buyer’s due diligence, not the plant’s thermal performance, now determines realised revenue per tonne.
Recent Industry Developments
- November 2015: The European Union adopted the Medium Combustion Plant Directive, setting emission limits for combustion plants between 1 and 50 megawatts thermal input, with compliance deadlines of 2025 for larger existing units and 2030 for smaller ones – it fixed the gas cleaning specification that syngas engines and boilers must now meet.
- July 2022: The European Union Fertilising Products Regulation became applicable across the single market, with a component material category covering pyrolysis and gasification materials – it created the first harmonised legal route to sell biochar as a fertilising product in Europe.
- December 2024: The European Union adopted its certification framework for carbon removals and carbon farming, covering durability, monitoring and verification requirements including carbon stored in products – it gives biochar projects an audited reference point that voluntary methodologies alone could not provide.
Companies Covered in the Report
- Pyreg GmbH
- SynCraft Engineering GmbH
- Burkhardt GmbH
- Spanner Re² GmbH
- VOW ASA
- Bioforcetech Corporation
- Airex Energy Inc.
- Biochar Now, LLC
- Standard Biocarbon Corporation
- Carbo Culture
- Carbofex Oy
- Wakefield Biochar
- Carbon Gold Ltd
- Carbonfuture GmbH
Biochar Gasification Market Report Scope
| Metric | Value |
| Study Period | 2020–2033 |
| Market Size 2026 | US$ 0.6 Billion |
| Market Size 2033 | US$ 1.4 Billion |
| CAGR 2026–2033 | 12.87% |
| Absolute Dollar Opportunity | US$ 0.8 Billion |
| Largest Market | Europe (36.0% share in 2026) |
| Fastest-Growing Market | Asia Pacific (15.5% CAGR) |
| Market Concentration | Low |
| Major Players | Pyreg GmbH, SynCraft Engineering GmbH, VOW ASA, Bioforcetech Corporation |
Biochar Gasification Market Segmentation
Technology
- Slow Pyrolysis Systems
- Fixed-Bed Gasification
- Fluidized-Bed Gasification
- Fast Pyrolysis & Other Thermochemical Systems
Component
- Gasification & Pyrolysis Reactors
- Gas Cleaning & Conditioning Equipment
- Heat & Power Generation Equipment
- Biochar Handling & Activation Equipment
- Engineering & Carbon Services
Feedstock
- Forestry & Sawmill Residues
- Agricultural Residues
- Manure & Digestate
- Biogenic Waste Streams
Application
- Soil Amendment & Agriculture
- Animal Feed & Bedding
- Construction Materials
- Filtration & Activated Carbon
- Metallurgical Reduction
Regions
- North America
- Europe
- Asia Pacific
- Latin America
- Middle East & Africa
- Executive Summary
- Global Biochar Gasification Market Snapshot
- Future Projections, 2026-2033
- Key Market Trends
- Regional Snapshot
- Market Overview
- Market Definition and Report Scope
- Historical Market Trends, 2020-2025
- Market Dynamics
- Drivers Impact Analysis
- Stacked Energy, Product and Credit Revenue Makes Biochar Gasification Plants Financeable
- Fertilising Product Rules and Removal Certification Open Regulated Demand for Biochar
- Restraints Impact Analysis
- Tar Formation and Gas Cleaning Failures Stall Small-Scale Biochar Gasification Plants
- Biomass Logistics Cost and Credit Price Volatility Squeeze Biochar Gasification Returns
- Market Opportunities
- Concrete Admixture and Construction Uses Lock Biochar Carbon Into Durable Products
- Certified Removal Credits and Metallurgical Biocarbon Open Premium Offtake Pools
- Drivers Impact Analysis
- Global Biochar Gasification Market Outlook, 2020-2033
- Global Biochar Gasification Market Outlook, by Technology, Value (US$ Billion), 2020-2033
- Slow Pyrolysis Systems
- Fixed-Bed Gasification
- Fluidized-Bed Gasification
- Fast Pyrolysis & Other Thermochemical Systems
- Global Biochar Gasification Market Outlook, by Component, Value (US$ Billion), 2020-2033
- Gasification & Pyrolysis Reactors
- Gas Cleaning & Conditioning Equipment
- Heat & Power Generation Equipment
- Biochar Handling & Activation Equipment
- Engineering & Carbon Services
- Global Biochar Gasification Market Outlook, by Feedstock, Value (US$ Billion), 2020-2033
- Forestry & Sawmill Residues
- Agricultural Residues
- Manure & Digestate
- Biogenic Waste Streams
- Global Biochar Gasification Market Outlook, by Application, Value (US$ Billion), 2020-2033
- Soil Amendment & Agriculture
- Animal Feed & Bedding
- Construction Materials
- Filtration & Activated Carbon
- Metallurgical Reduction
- Global Biochar Gasification Market Outlook, by Region, Value (US$ Billion), 2020-2033
- North America
- Europe
- Asia Pacific
- Latin America
- Middle East & Africa
- Global Biochar Gasification Market Outlook, by Technology, Value (US$ Billion), 2020-2033
- North America Biochar Gasification Market Outlook, 2020-2033
- North America Biochar Gasification Market Outlook, by Technology, Value (US$ Billion), 2020-2033
- Slow Pyrolysis Systems
- Fixed-Bed Gasification
- Fluidized-Bed Gasification
- Fast Pyrolysis & Other Thermochemical Systems
- North America Biochar Gasification Market Outlook, by Component, Value (US$ Billion), 2020-2033
- Gasification & Pyrolysis Reactors
- Gas Cleaning & Conditioning Equipment
- Heat & Power Generation Equipment
- Biochar Handling & Activation Equipment
- Engineering & Carbon Services
- North America Biochar Gasification Market Outlook, by Feedstock, Value (US$ Billion), 2020-2033
- Forestry & Sawmill Residues
- Agricultural Residues
- Manure & Digestate
- Biogenic Waste Streams
- North America Biochar Gasification Market Outlook, by Application, Value (US$ Billion), 2020-2033
- Soil Amendment & Agriculture
- Animal Feed & Bedding
- Construction Materials
- Filtration & Activated Carbon
- Metallurgical Reduction
- North America Biochar Gasification Market Outlook, by Country, Value (US$ Billion), 2020-2033
- United States Biochar Gasification Market Outlook, by Technology, 2020-2033
- United States Biochar Gasification Market Outlook, by Component, 2020-2033
- United States Biochar Gasification Market Outlook, by Feedstock, 2020-2033
- United States Biochar Gasification Market Outlook, by Application, 2020-2033
- Canada Biochar Gasification Market Outlook, by Technology, 2020-2033
- Canada Biochar Gasification Market Outlook, by Component, 2020-2033
- Canada Biochar Gasification Market Outlook, by Feedstock, 2020-2033
- Canada Biochar Gasification Market Outlook, by Application, 2020-2033
- North America Biochar Gasification Market Outlook, by Technology, Value (US$ Billion), 2020-2033
- Europe Biochar Gasification Market Outlook, 2020-2033
- Europe Biochar Gasification Market Outlook, by Technology, Value (US$ Billion), 2020-2033
- Slow Pyrolysis Systems
- Fixed-Bed Gasification
- Fluidized-Bed Gasification
- Fast Pyrolysis & Other Thermochemical Systems
- Europe Biochar Gasification Market Outlook, by Component, Value (US$ Billion), 2020-2033
- Gasification & Pyrolysis Reactors
- Gas Cleaning & Conditioning Equipment
- Heat & Power Generation Equipment
- Biochar Handling & Activation Equipment
- Engineering & Carbon Services
- Europe Biochar Gasification Market Outlook, by Feedstock, Value (US$ Billion), 2020-2033
- Forestry & Sawmill Residues
- Agricultural Residues
- Manure & Digestate
- Biogenic Waste Streams
- Europe Biochar Gasification Market Outlook, by Application, Value (US$ Billion), 2020-2033
- Soil Amendment & Agriculture
- Animal Feed & Bedding
- Construction Materials
- Filtration & Activated Carbon
- Metallurgical Reduction
- Europe Biochar Gasification Market Outlook, by Country, Value (US$ Billion), 2020-2033
- Germany Biochar Gasification Market Outlook, by Technology, 2020-2033
- Germany Biochar Gasification Market Outlook, by Component, 2020-2033
- Germany Biochar Gasification Market Outlook, by Feedstock, 2020-2033
- Germany Biochar Gasification Market Outlook, by Application, 2020-2033
- Austria Biochar Gasification Market Outlook, by Technology, 2020-2033
- Austria Biochar Gasification Market Outlook, by Component, 2020-2033
- Austria Biochar Gasification Market Outlook, by Feedstock, 2020-2033
- Austria Biochar Gasification Market Outlook, by Application, 2020-2033
- Switzerland Biochar Gasification Market Outlook, by Technology, 2020-2033
- Switzerland Biochar Gasification Market Outlook, by Component, 2020-2033
- Switzerland Biochar Gasification Market Outlook, by Feedstock, 2020-2033
- Switzerland Biochar Gasification Market Outlook, by Application, 2020-2033
- Sweden Biochar Gasification Market Outlook, by Technology, 2020-2033
- Sweden Biochar Gasification Market Outlook, by Component, 2020-2033
- Sweden Biochar Gasification Market Outlook, by Feedstock, 2020-2033
- Sweden Biochar Gasification Market Outlook, by Application, 2020-2033
- Finland Biochar Gasification Market Outlook, by Technology, 2020-2033
- Finland Biochar Gasification Market Outlook, by Component, 2020-2033
- Finland Biochar Gasification Market Outlook, by Feedstock, 2020-2033
- Finland Biochar Gasification Market Outlook, by Application, 2020-2033
- Europe Biochar Gasification Market Outlook, by Technology, Value (US$ Billion), 2020-2033
- Asia Pacific Biochar Gasification Market Outlook, 2020-2033
- Asia Pacific Biochar Gasification Market Outlook, by Technology, Value (US$ Billion), 2020-2033
- Slow Pyrolysis Systems
- Fixed-Bed Gasification
- Fluidized-Bed Gasification
- Fast Pyrolysis & Other Thermochemical Systems
- Asia Pacific Biochar Gasification Market Outlook, by Component, Value (US$ Billion), 2020-2033
- Gasification & Pyrolysis Reactors
- Gas Cleaning & Conditioning Equipment
- Heat & Power Generation Equipment
- Biochar Handling & Activation Equipment
- Engineering & Carbon Services
- Asia Pacific Biochar Gasification Market Outlook, by Feedstock, Value (US$ Billion), 2020-2033
- Forestry & Sawmill Residues
- Agricultural Residues
- Manure & Digestate
- Biogenic Waste Streams
- Asia Pacific Biochar Gasification Market Outlook, by Application, Value (US$ Billion), 2020-2033
- Soil Amendment & Agriculture
- Animal Feed & Bedding
- Construction Materials
- Filtration & Activated Carbon
- Metallurgical Reduction
- Asia Pacific Biochar Gasification Market Outlook, by Country, Value (US$ Billion), 2020-2033
- India Biochar Gasification Market Outlook, by Technology, 2020-2033
- India Biochar Gasification Market Outlook, by Component, 2020-2033
- India Biochar Gasification Market Outlook, by Feedstock, 2020-2033
- India Biochar Gasification Market Outlook, by Application, 2020-2033
- China Biochar Gasification Market Outlook, by Technology, 2020-2033
- China Biochar Gasification Market Outlook, by Component, 2020-2033
- China Biochar Gasification Market Outlook, by Feedstock, 2020-2033
- China Biochar Gasification Market Outlook, by Application, 2020-2033
- Japan Biochar Gasification Market Outlook, by Technology, 2020-2033
- Japan Biochar Gasification Market Outlook, by Component, 2020-2033
- Japan Biochar Gasification Market Outlook, by Feedstock, 2020-2033
- Japan Biochar Gasification Market Outlook, by Application, 2020-2033
- South Korea Biochar Gasification Market Outlook, by Technology, 2020-2033
- South Korea Biochar Gasification Market Outlook, by Component, 2020-2033
- South Korea Biochar Gasification Market Outlook, by Feedstock, 2020-2033
- South Korea Biochar Gasification Market Outlook, by Application, 2020-2033
- Australia Biochar Gasification Market Outlook, by Technology, 2020-2033
- Australia Biochar Gasification Market Outlook, by Component, 2020-2033
- Australia Biochar Gasification Market Outlook, by Feedstock, 2020-2033
- Australia Biochar Gasification Market Outlook, by Application, 2020-2033
- Asia Pacific Biochar Gasification Market Outlook, by Technology, Value (US$ Billion), 2020-2033
- Latin America Biochar Gasification Market Outlook, 2020-2033
- Latin America Biochar Gasification Market Outlook, by Technology, Value (US$ Billion), 2020-2033
- Slow Pyrolysis Systems
- Fixed-Bed Gasification
- Fluidized-Bed Gasification
- Fast Pyrolysis & Other Thermochemical Systems
- Latin America Biochar Gasification Market Outlook, by Component, Value (US$ Billion), 2020-2033
- Gasification & Pyrolysis Reactors
- Gas Cleaning & Conditioning Equipment
- Heat & Power Generation Equipment
- Biochar Handling & Activation Equipment
- Engineering & Carbon Services
- Latin America Biochar Gasification Market Outlook, by Feedstock, Value (US$ Billion), 2020-2033
- Forestry & Sawmill Residues
- Agricultural Residues
- Manure & Digestate
- Biogenic Waste Streams
- Latin America Biochar Gasification Market Outlook, by Application, Value (US$ Billion), 2020-2033
- Soil Amendment & Agriculture
- Animal Feed & Bedding
- Construction Materials
- Filtration & Activated Carbon
- Metallurgical Reduction
- Latin America Biochar Gasification Market Outlook, by Country, Value (US$ Billion), 2020-2033
- Brazil Biochar Gasification Market Outlook, by Technology, 2020-2033
- Brazil Biochar Gasification Market Outlook, by Component, 2020-2033
- Brazil Biochar Gasification Market Outlook, by Feedstock, 2020-2033
- Brazil Biochar Gasification Market Outlook, by Application, 2020-2033
- Colombia Biochar Gasification Market Outlook, by Technology, 2020-2033
- Colombia Biochar Gasification Market Outlook, by Component, 2020-2033
- Colombia Biochar Gasification Market Outlook, by Feedstock, 2020-2033
- Colombia Biochar Gasification Market Outlook, by Application, 2020-2033
- Chile Biochar Gasification Market Outlook, by Technology, 2020-2033
- Chile Biochar Gasification Market Outlook, by Component, 2020-2033
- Chile Biochar Gasification Market Outlook, by Feedstock, 2020-2033
- Chile Biochar Gasification Market Outlook, by Application, 2020-2033
- Argentina Biochar Gasification Market Outlook, by Technology, 2020-2033
- Argentina Biochar Gasification Market Outlook, by Component, 2020-2033
- Argentina Biochar Gasification Market Outlook, by Feedstock, 2020-2033
- Argentina Biochar Gasification Market Outlook, by Application, 2020-2033
- Latin America Biochar Gasification Market Outlook, by Technology, Value (US$ Billion), 2020-2033
- Middle East & Africa Biochar Gasification Market Outlook, 2020-2033
- Middle East & Africa Biochar Gasification Market Outlook, by Technology, Value (US$ Billion), 2020-2033
- Slow Pyrolysis Systems
- Fixed-Bed Gasification
- Fluidized-Bed Gasification
- Fast Pyrolysis & Other Thermochemical Systems
- Middle East & Africa Biochar Gasification Market Outlook, by Component, Value (US$ Billion), 2020-2033
- Gasification & Pyrolysis Reactors
- Gas Cleaning & Conditioning Equipment
- Heat & Power Generation Equipment
- Biochar Handling & Activation Equipment
- Engineering & Carbon Services
- Middle East & Africa Biochar Gasification Market Outlook, by Feedstock, Value (US$ Billion), 2020-2033
- Forestry & Sawmill Residues
- Agricultural Residues
- Manure & Digestate
- Biogenic Waste Streams
- Middle East & Africa Biochar Gasification Market Outlook, by Application, Value (US$ Billion), 2020-2033
- Soil Amendment & Agriculture
- Animal Feed & Bedding
- Construction Materials
- Filtration & Activated Carbon
- Metallurgical Reduction
- Middle East & Africa Biochar Gasification Market Outlook, by Country, Value (US$ Billion), 2020-2033
- South Africa Biochar Gasification Market Outlook, by Technology, 2020-2033
- South Africa Biochar Gasification Market Outlook, by Component, 2020-2033
- South Africa Biochar Gasification Market Outlook, by Feedstock, 2020-2033
- South Africa Biochar Gasification Market Outlook, by Application, 2020-2033
- Kenya Biochar Gasification Market Outlook, by Technology, 2020-2033
- Kenya Biochar Gasification Market Outlook, by Component, 2020-2033
- Kenya Biochar Gasification Market Outlook, by Feedstock, 2020-2033
- Kenya Biochar Gasification Market Outlook, by Application, 2020-2033
- Egypt Biochar Gasification Market Outlook, by Technology, 2020-2033
- Egypt Biochar Gasification Market Outlook, by Component, 2020-2033
- Egypt Biochar Gasification Market Outlook, by Feedstock, 2020-2033
- Egypt Biochar Gasification Market Outlook, by Application, 2020-2033
- United Arab Emirates Biochar Gasification Market Outlook, by Technology, 2020-2033
- United Arab Emirates Biochar Gasification Market Outlook, by Component, 2020-2033
- United Arab Emirates Biochar Gasification Market Outlook, by Feedstock, 2020-2033
- United Arab Emirates Biochar Gasification Market Outlook, by Application, 2020-2033
- Middle East & Africa Biochar Gasification Market Outlook, by Technology, Value (US$ Billion), 2020-2033
- Competitive Landscape
- Market Concentration and Industry Leaders
- Competitive Differentiation
- Strategic Initiatives
- Recent Industry Developments
- Company Profiles
- Pyreg GmbH
- SynCraft Engineering GmbH
- Burkhardt GmbH
- Spanner Re² GmbH
- VOW ASA
- Bioforcetech Corporation
- Airex Energy Inc.
- Biochar Now, LLC
- Standard Biocarbon Corporation
- Carbo Culture
- Carbofex Oy
- Wakefield Biochar
- Carbon Gold Ltd
- Carbonfuture GmbH
- Appendix
- Research Methodology
- Report Assumptions
- Acronyms and Abbreviations
Technology
- Slow Pyrolysis Systems
- Fixed-Bed Gasification
- Fluidized-Bed Gasification
- Fast Pyrolysis & Other Thermochemical Systems
Component
- Gasification & Pyrolysis Reactors
- Gas Cleaning & Conditioning Equipment
- Heat & Power Generation Equipment
- Biochar Handling & Activation Equipment
- Engineering & Carbon Services
Feedstock
- Forestry & Sawmill Residues
- Agricultural Residues
- Manure & Digestate
- Biogenic Waste Streams
Application
- Soil Amendment & Agriculture
- Animal Feed & Bedding
- Construction Materials
- Filtration & Activated Carbon
- Metallurgical Reduction
Regions
- North America
- Europe
- Asia Pacific
- Latin America
- Middle East & Africa
Our Research Methodology
Considering the volatility of business today, traditional approaches to strategizing a game plan can be unfruitful if not detrimental. True ambiguity is no way to determine a forecast. A myriad of predetermined factors must be accounted for such as the degree of risk involved, the magnitude of circumstances, as well as conditions or consequences that are not known or unpredictable. To circumvent binary views that cast uncertainty, the application of market research intelligence to strategically posture, move, and enable actionable outcomes is necessary.
View Methodology
Quality Assured
Rigorous Validation Process

Confidentiality Assured
End-to-end Data Security

Custom Research Services
Tailored To Your Objectives
FAQs
The market is valued at US$ 0.6 billion in 2026, covering conversion equipment, gas cleaning, char handling and the services supplied around these plants.
The market is projected to reach US$ 1.4 billion by 2033, expanding at a 12.87% CAGR and adding US$ 0.8 billion in absolute opportunity.
Slow Pyrolysis Systems lead with 41.0% share in 2026, because long residence times at moderate temperature maximise the solid carbon yield projects sell.
Construction Materials grows fastest among applications at a 19.6% CAGR, while Engineering & Carbon Services leads component growth at 18.2% through 2033.
Europe holds 36.0% share in 2026, supported by harmonised fertilising product rules and an established certification standard for char quality.
Related Reports
Enhanced Oil Recovery Market Size, Share, Insights, Competitive Landscape, and Forecast 2026 to 2033
The global enhanced oil recovery market is valued at US$46.5 billion in 2026, reaching US$58.9 billion by 2033, growing at a 3.43% CAGR
AC-Coupled Energy Storage Inverter Market Size, Share, Insights, Competitive Landscape, and Forecast 2026 to 2033
The AC-coupled energy storage inverter market is forecast to grow from US$ 4.2 billion in 2026 to US$ 10.5 billion by 2033 at a 13.99% CAGR.
Steam Turbine Aftermarket Size, Share, Insights, Competitive Landscape, and Forecast 2026 to 2033
The Steam Turbine Aftermarket is projected to rise from US$ 4.56 billion in 2026 to US$ 6.29 billion by 2033 at a 4.7% CAGR. Explore key service trends.
Power EPC Market Size, Share, Insights, Competitive Landscape, and Forecast 2026 to 2033
Power EPC Market is projected to rise from US$ 780.56 billion in 2026 to US$ 1,220.97 billion by 2033 at a 6.6% CAGR. Explore generation and project trends.
Port Electrification Market Size, Share, Insights, Competitive Landscape, and Forecast 2026 to 2033
Explore the port electrification market, valued at US$ 6.8 billion in 2026 and forecast to reach US$ 16.4 billion by 2033, growing at a 13.4% CAGR.
Polycrystalline Solar Cell Market Size, Share, Insights, Competitive Landscape, and Forecast 2026 to 2033
Explore the polycrystalline solar cell market, valued at US$ 5.4 billion in 2026 and projected to reach US$ 6.6 billion by 2033, growing at 2.9% CAGR.