



Enhanced Oil Recovery Market
Enhanced Oil Recovery Market Size, Share, Insights, Competitive Landscape, and Forecast 2026 to 2033
Enhanced Oil Recovery Market Size and Trend Analysis
How Big Is the Enhanced Oil Recovery Market in 2026?
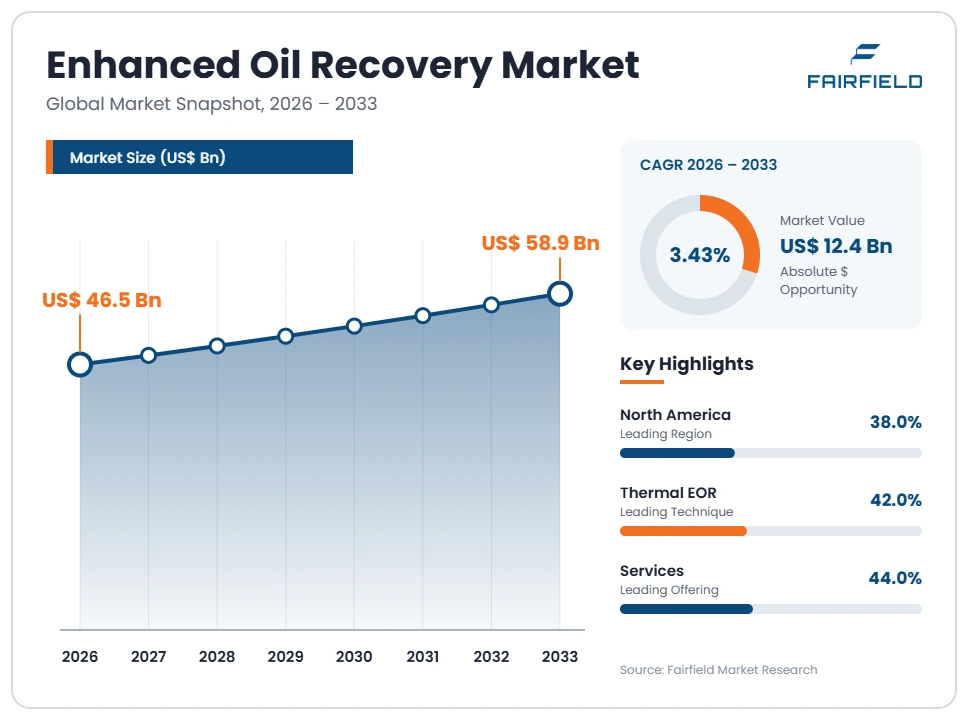
The global Enhanced Oil Recovery market size is expected to be valued at US$ 46.5 billion in 2026 and projected to reach US$ 58.9 billion by 2033, growing at a CAGR of 3.43% between 2026 and 2033.
The market expanded at roughly a 2.1% CAGR between 2020 and 2025, on a path set by crude prices, not technology. Spending fell when prices collapsed, then recovered as operators restarted deferred steam and injection work. Three forces set the outlook. Base decline in mature fields keeps tertiary oil recovery among the cheapest incremental barrels an operator can add. The 45Q credit and growing captured carbon dioxide supply support miscible flooding in the United States. Polymer flooding continues to spread through mature waterfloods in China, Oman and Argentina. Growth stays modest because every technique costs more per barrel than primary and secondary recovery, so sanction decisions wait for a durable price signal rather than a technical breakthrough.
Key Report Takeaways
- By Technique: Thermal EOR held 42.0% share in 2026, while Chemical EOR is projected to expand at a 5.1% CAGR through 2033, driven by polymer injection into mature waterfloods that already have wells, pumps and water handling in place.
- By Offering: Services held 44.0% share in 2026, while Chemicals is projected to expand at a 4.7% CAGR through 2033, because polymer and surfactant consumption scales with injected volume rather than with one-off capital spending.
- By Reservoir Type: Sandstone held 38.0% share in 2026, while Unconventional & Tight is projected to expand at a 6.2% CAGR through 2033, supported by cyclic gas injection trials in shale wells with steep decline curves.
- By Deployment: Onshore held 88.0% share in 2026, while Offshore is projected to expand at a 4.4% CAGR through 2033, helped by gas reinjection schemes on high-value fields where topside space has been designed in from the start.
- By Geography: North America held 38.0% share in 2026, while Middle East & Africa is projected to expand at a 5.1% CAGR through 2033, reflecting national programmes to lift recovery factors from giant mature carbonate fields.
Global Enhanced Oil Recovery Market Trends and Insights
Drivers Impact Analysis
Two forces carry most of the demand for tertiary recovery equipment, chemicals and services through the forecast period.
| Driver | Impact on CAGR Forecast | Geographic Relevance | Impact Timeline |
| Base decline in mature fields making tertiary barrels competitive | High | North America, Middle East & Africa, Asia Pacific | Long term ≥4 years |
| Captured carbon dioxide supply paired with the 45Q credit | Medium | North America | Medium term 2–4 years |
Mature Field Decline Keeps Tertiary Recovery Spending Resilient Across Producing Basins
Decline in large, long-producing fields sustains steady demand for injection equipment, chemicals and reservoir services. Primary and secondary methods typically leave two-thirds of the oil in place, so an operator holding a discovered, mapped and fully drilled reservoir can often add barrels for less than a new exploration programme costs. That calculation keeps existing steam floods, gas floods and polymer schemes running through price cycles once the surface facilities are built.
The mechanism is asset age. Giant fields in the United States, Oman, China, Indonesia and Venezuela are decades past peak, and their water cuts keep climbing. National production targets in several of these countries are now written around recovery factor improvement rather than new discoveries. Because injection facilities, compression trains and water treatment plants need continuous maintenance, chemicals and workover services, the installed base alone generates a recurring revenue stream.
Captured Carbon Dioxide Supply and the 45Q Credit Widen Miscible Flooding in the United States
Access to carbon dioxide at a workable delivered price is what allows CO2 flooding to grow, and new captured volumes are easing that constraint. Operators in the Permian Basin and along the Gulf Coast can now contract industrial carbon dioxide from ammonia, ethanol and gas processing plants rather than relying only on natural domes. Each new supply point makes an adjacent flood candidate commercially testable.
The causal chain runs through tax policy and measurement. The 45Q credit pays a defined amount per tonne for carbon dioxide used in enhanced oil recovery where storage is documented, which offsets part of the purchase and recycling cost. Documentation follows Subpart RR reporting or the ISO 27916 standard, so volumes retained in the reservoir can be audited. United States Environmental Protection Agency Class II permitting already covers the injection wells, which shortens approval timelines relative to greenfield storage.
Restraints Impact Analysis
Two structural constraints keep this market cyclical and prevent the steady compounding seen in other energy equipment sectors.
| Restraint | Impact on CAGR Forecast | Geographic Relevance | Impact Timeline |
| Oil price volatility and operator capital discipline | High | Global | Short term ≤2 years |
| Carbon dioxide cost and limited pipeline reach | Medium | North America, Europe, Asia Pacific | Long term ≥4 years |
Oil Price Cycles and Capital Discipline Push Out New Enhanced Oil Recovery Sanctions
Tertiary projects are an option on the oil price, and that is why new sanctions stall whenever the price outlook softens. Every technique raises lifting cost above primary and secondary recovery, through steam generation fuel, injectant purchase, chemical consumption or extra compression. Boards therefore compare a tertiary scheme against share buybacks, debt reduction and short-cycle shale wells, and the tertiary scheme usually loses on payback speed.
The underlying cause is commitment length. A steam flood or a miscible flood needs several years of injection before incremental production responds, and the surface plant is useless for anything else. Reservoir risk compounds this: sweep efficiency, conformance and injectant breakthrough can only be partly predicted from pilots, so a scheme may underperform its model. Thermal projects carry an added exposure, since fuel gas burned for steam raises both operating cost and reported emissions under carbon pricing.
Carbon Dioxide Cost and Limited Pipeline Reach Cap Miscible Flooding Outside Established Corridors
Carbon dioxide availability, not reservoir suitability, is the binding constraint on gas injection growth in most of the world. Many fields are technically good miscible flood candidates but sit far from any source of bulk carbon dioxide. Without a pipeline, the operator must fund capture, compression, dehydration and transport before a single barrel responds, which moves the project outside normal field development budgets.
The specific cost sources are compression and transport rather than the gas itself. Pipeline-grade carbon dioxide must be dried to avoid corrosion and compressed to dense phase, and trunk line construction requires right-of-way across multiple landowners and jurisdictions. Recycling plants then separate and recompress produced carbon dioxide for reinjection over the life of the flood. Outside the United States network, few regions have this infrastructure, which is why miscible flooding remains geographically concentrated despite being technically well understood.
Market Opportunities
Anthropogenic Carbon Dioxide Supply Opens a New Miscible Flooding Revenue Pool
Pairing captured industrial carbon dioxide with tertiary recovery creates a revenue pool that natural dome supply never could, because it links two separately financed businesses. An emitter gains a buyer for a waste stream, an operator gains injectant at a contracted price, and the service sector gains compression, metering, recycling and monitoring scope on every project. Each new capture plant effectively creates a catchment of flood candidates around it.
Capture operators, midstream developers and oilfield service firms are best placed to capture the value, with ammonia, ethanol and gas processing plants supplying the most concentrated streams. The 45Q credit supports the economics where storage is documented under Subpart RR or ISO 27916, and the California Low Carbon Fuel Standard provides a separate pathway through which crude produced with sequestered carbon dioxide can be treated differently from conventional barrels.
Polymer Flooding in Mature Waterfloods Creates a Recurring Chemicals and Services Pool
Converting an existing waterflood to polymer injection is the lowest-capital route into tertiary recovery, and it opens a recurring chemicals and services revenue pool. The wells, pumps, flowlines and water plant are already installed, so the incremental spending is mixing skids, filtration and a continuous polyacrylamide supply contract. That shifts revenue from one-time equipment sales toward consumables billed against injected volume for a decade or more.
Oilfield chemical suppliers, water treatment specialists and reservoir engineering consultancies stand to benefit, with mature onshore fields in China, Oman, Argentina, Canada and India creating the demand. Digital reservoir surveillance supports the model, because permanent downhole gauges, tracer campaigns and interwell connectivity analysis let engineers adjust polymer concentration field by field. Better conformance control raises sweep efficiency, which in turn justifies larger and longer chemical contracts.
Segment Analysis
- By Technique: Thermal Methods Lead While Chemical Flooding Expands Fastest
Thermal EOR held 42.0% of the market in 2026, the largest share, because steam flooding, cyclic steam stimulation and steam-assisted gravity drainage are the only practical way to mobilise heavy oil and bitumen. Gas Injection EOR followed at 34.0%, dominated by CO2 miscible and immiscible flooding plus nitrogen and hydrocarbon gas injection. Chemical EOR accounted for 21.5% and Microbial & Emerging Methods for 2.5%.
Chemical EOR is the fastest-growing technique at a 5.1% CAGR through 2033, led by polymer flooding and by alkaline-surfactant-polymer schemes in specific fields. Growth reflects low incremental capital and improved polymer tolerance to high salinity and temperature. Thermal operators face a different pressure, since the fuel burned to raise steam is both a major operating cost and a reported emission. The practical implication is that the three main techniques are geologically segregated and rarely compete for the same reservoir.
- By Offering: Services Dominate Spending While Chemicals Grow Quickest
Services held 44.0% of enhanced oil recovery spending in 2026, covering reservoir characterisation, pilot design, injection management, workovers, conformance control and production surveillance. Equipment accounted for 33.0%, including steam generators, injection pumps, compression trains, separation vessels and carbon dioxide recycling plants. Chemicals made up the remaining 23.0%, principally polymers, surfactants, alkalis, foamers and corrosion inhibitors.
Chemicals is the fastest-growing offering at a 4.7% CAGR through 2033, because injectant consumption continues for the life of a flood while equipment is bought once. Supply is concentrated among a small number of polyacrylamide and surfactant producers, which gives the oilfield chemicals segment unusual pricing stability. For vendors, the implication is a clear strategic split: equipment revenue tracks new sanctions and is therefore cyclical, whereas chemicals and services track the installed base and provide the sector’s most defensible earnings.
- By Reservoir Type: Sandstone Reservoirs Lead as Unconventional Pilots Scale Fastest
Sandstone reservoirs held 38.0% share in 2026, because their permeability and well-understood mineralogy suit polymer and surfactant chemistry with fewer adsorption losses. Carbonate reservoirs accounted for 29.0%, where fracture networks and wettability favour gas injection over chemical methods. Heavy Oil & Oil Sands represented 26.0%, served almost entirely by thermal techniques. Unconventional & Tight reservoirs held the remaining 7.0%.
Unconventional & Tight is the fastest-growing reservoir type at a 6.2% CAGR through 2033, from the smallest base. Cyclic gas injection, often using produced natural gas liquids or carbon dioxide, is being tested in shale wells whose output falls steeply within two years. Results vary widely between basins and even between pads. The business implication is that reservoir type, not geography alone, determines which vendors can bid, since chemical, thermal and gas injection suppliers serve largely separate customer sets.
- By Deployment: Onshore Projects Dominate While Offshore Schemes Grow Faster
Onshore deployment accounted for 88.0% of the market in 2026, an unusually lopsided split. Onshore fields allow large surface footprints for steam generators, chemical mixing plants, compression and recycling facilities, and they permit dense infill drilling to tighten injector-producer patterns. Costs per well are also far lower, which matters when a scheme needs many injection points before any production response appears.
Offshore deployment holds 12.0% but grows faster, at a 4.4% CAGR through 2033. Growth comes from hydrocarbon and carbon dioxide reinjection on high-value fields where platform space, power and gas handling were designed in from first oil, notably in Brazil, Norway and Malaysia. Weight, deck area and water disposal limits still rule out most retrofits. For equipment suppliers, the offshore niche rewards compact, modular injection and separation packages rather than conventional land-built plant.
Geography Analysis
- Which Region Leads the Enhanced Oil Recovery Market?
North America leads the enhanced oil recovery market with 38.0% share in 2026 and a 2.4% CAGR through 2033. The United States hosts almost all commercial carbon dioxide flooding, supported by a dedicated pipeline network serving the Permian Basin and by the 45Q credit. Canada operates the largest thermal recovery base anywhere, where steam-assisted gravity drainage in Alberta sustains continuous equipment, chemical and service demand.
Whether CO2 flooding delivers a net climate benefit is disputed. Supporters point to the carbon dioxide retained in the reservoir and to storage accounting under Subpart RR and the ISO 27916 standard. Critics point to the oil produced and to volumes still taken from natural domes rather than from capture. The two positions rest on different system boundaries, and this report does not adjudicate between them. Regional spending increasingly turns on how Class II and Class VI injection permitting treats each project.
- Europe Supplies Technology and Chemicals More Than Large Tertiary Recovery Projects
Europe accounted for 6.0% of the market in 2026 and is forecast to grow at a 2.0% CAGR to 2033, the slowest performance of the five regions. Mature fields in the United Kingdom and Norway are largely waterflooded rather than tertiary, because platform weight, deck space and produced water handling limits make retrofitted injection schemes difficult and expensive to justify.
Norway is the main exception, with long-running hydrocarbon gas reinjection and water-alternating-gas on several offshore fields. The region’s larger role is as a supplier: polymer, surfactant and corrosion inhibitor producers, reservoir simulation software developers and subsea equipment makers export into projects elsewhere. The change worth watching is decommissioning policy, since any scheme that extends field life must clear economic tests before cessation of production is approved.
- Asia Pacific Scales Chemical Flooding Across Large Mature Onshore Fields
Asia Pacific held 22.0% of the market in 2026 and is projected to grow at a 4.0% CAGR through 2033, the second-fastest regional rate. China dominates, with decades of polymer and alkaline-surfactant-polymer flooding in the Daqing and Shengli field complexes, supported by domestic polyacrylamide manufacturing at scale. These programmes exist because national output targets reward recovery factor gains from fields already drilled and connected.
Indonesia operates one of the world’s largest steam floods in Sumatra, while India and Malaysia run chemical and gas injection schemes on ageing offshore and onshore assets. Domestic service capability has deepened, lowering delivered cost. The main opportunity is produced water reuse, because polymer flooding at this scale depends on consistent injection water quality, and treatment capacity now limits expansion more often than chemistry does.
- Latin America Combines Heavy Oil Belts With Pre-Salt Gas Reinjection
Latin America held 11.0% of the market in 2026, with a projected 3.6% CAGR to 2033. Venezuela anchors regional volume through thermal recovery in the Orinoco heavy oil belt, while Brazil applies carbon dioxide and water-alternating-gas reinjection in pre-salt fields where produced gas carries high carbon dioxide content and cannot be vented or economically exported.
Argentina and Colombia add polymer flooding in mature onshore fields, and Mexico is evaluating injection schemes on declining shallow-water assets. Barriers are significant. Fiscal instability, currency controls and sanctions restrict capital and equipment access, service company presence is thin outside the main basins, and skilled crews are scarce. The clearest opportunity is pre-salt reinjection, which solves a gas disposal problem and lifts recovery with the same facility.
- Which Region Is Growing Fastest in the Enhanced Oil Recovery Market?
Middle East & Africa is growing fastest in the enhanced oil recovery market, at a 5.1% CAGR through 2033 from 23.0% share in 2026. Giant mature carbonate fields in Saudi Arabia, Oman, Kuwait, Iran and the United Arab Emirates have recovery factors that national production plans explicitly target, and state balance sheets can absorb the long payback that tertiary schemes require.
Oman is the most diversified case, running steam flooding, polymer injection and miscible gas schemes simultaneously, with solar thermal used to raise part of its steam. Egypt, Algeria and Nigeria contribute smaller gas injection projects. Barriers include water scarcity, competing domestic demand for the gas that would otherwise be injected, and security risk in parts of Africa. The opportunity lies in associated gas reinjection, which reduces flaring while supporting pressure maintenance.
Competitive Landscape
The enhanced oil recovery market is moderately concentrated, and its structure differs sharply by offering. Integrated oilfield service companies hold the strongest positions in reservoir characterisation, injection management and field services, because tertiary projects require combined subsurface, chemical and surface facility capability that few firms possess. Equipment supply is more fragmented, with steam generator, compression, pump and separation specialists competing regionally. Chemical supply is the most concentrated part of the chain, since high-molecular-weight polyacrylamide production for oilfield duty is dominated by a handful of producers with the required reactor capacity and quality control.
Vendors compete primarily on demonstrated field results rather than on product specification. An operator sanctioning a multi-decade injection scheme wants evidence from analogous reservoirs, not laboratory data, so documented pilot performance, core flood testing capability and reservoir simulation credibility decide contracts. Price matters most in chemicals, where polymer is a continuing operating cost, and least in pilot design, where a failed scheme destroys far more value than the engineering fee. New entrants tend to arrive from adjacent fields: water treatment specialists moving into injection water conditioning, carbon capture developers moving into carbon dioxide supply, and data analytics firms offering conformance diagnostics.
Strategic activity concentrates on securing injectant supply and on building integrated project delivery. Service companies are extending from equipment supply toward performance-linked contracts, where part of the fee depends on incremental barrels recovered. Chemical producers are localising manufacturing close to large flooding programmes to cut freight cost on bulk polymer. National oil companies increasingly contract directly with technology providers rather than through international operators, which changes who holds the customer relationship.
Strategic direction across the sector is converging on emissions management alongside recovery. Firms are investing in lower-carbon steam generation, injectant recycling efficiency and measurement systems that can satisfy storage accounting requirements, because those capabilities now influence project approval as much as recovery performance does.
Recent Industry Developments
- February 2018: The United States Bipartisan Budget Act expanded the 45Q tax credit and set a separate, lower per-tonne value for carbon dioxide injected for enhanced oil recovery than for dedicated saline storage – the differential still shapes where capture-linked projects are sited.
- January 2021: The United States Department of the Treasury and the Internal Revenue Service issued final 45Q regulations recognising both Subpart RR reporting and the ISO 27916 standard as a basis for documenting secure geological storage associated with enhanced oil recovery – it gave operators an auditable accounting route.
- August 2022: The United States Inflation Reduction Act raised 45Q credit values, extended the construction start window and broadened eligibility, while retaining the lower rate for enhanced oil recovery – it improved project economics without closing the gap to saline storage.
- December 2023: The United States Environmental Protection Agency granted the state of Louisiana primacy over Class VI injection well permitting – state-level primacy shortens permitting timelines for carbon dioxide injection projects along the Gulf Coast.
Companies Covered in the Report
- SLB
- Halliburton Company
- Baker Hughes Company
- Weatherford International plc
- NOV Inc.
- TechnipFMC plc
- Occidental Petroleum Corporation
- Chevron Corporation
- Exxon Mobil Corporation
- China Petroleum & Chemical Corporation
- Petróleo Brasileiro S.A.
- Cenovus Energy Inc.
- SNF Group
- BASF SE
Enhanced Oil Recovery Market Report Scope
| Metric | Value |
| Study Period | 2020–2033 |
| Market Size 2026 | US$ 46.5 Billion |
| Market Size 2033 | US$ 58.9 Billion |
| CAGR 2026–2033 | 3.43% |
| Absolute Dollar Opportunity | US$ 12.4 Billion |
| Largest Market | North America (38.0% share in 2026) |
| Fastest-Growing Market | Middle East & Africa (5.1% CAGR) |
| Market Concentration | Medium |
| Major Players | SLB, Halliburton Company, Baker Hughes Company, China Petroleum & Chemical Corporation |
Enhanced Oil Recovery Market Segmentation
Technique
- Thermal EOR
- Gas Injection EOR
- Chemical EOR
- Microbial & Emerging Methods
Offering
- Equipment
- Chemicals
- Services
Reservoir Type
- Sandstone
- Carbonate
- Heavy Oil & Oil Sands
- Unconventional & Tight
Deployment
- Onshore
- Offshore
Regions
- North America
- Europe
- Asia Pacific
- Latin America
- Middle East & Africa
- Executive Summary
- Global Enhanced Oil Recovery Market Snapshot
- Future Projections, 2026-2033
- Key Market Trends
- Regional Snapshot
- Market Overview
- Market Definition and Report Scope
- Historical Market Trends, 2020-2025
- Market Dynamics
- Drivers Impact Analysis
- Mature Field Decline Keeps Tertiary Recovery Spending Resilient Across Producing Basins
- Captured Carbon Dioxide Supply and the 45Q Credit Widen Miscible Flooding in the United States
- Restraints Impact Analysis
- Oil Price Cycles and Capital Discipline Push Out New Enhanced Oil Recovery Sanctions
- Carbon Dioxide Cost and Limited Pipeline Reach Cap Miscible Flooding Outside Established Corridors
- Market Opportunities
- Anthropogenic Carbon Dioxide Supply Opens a New Miscible Flooding Revenue Pool
- Polymer Flooding in Mature Waterfloods Creates a Recurring Chemicals and Services Pool
- Drivers Impact Analysis
- Global Enhanced Oil Recovery Market Outlook, 2020-2033
- Global Enhanced Oil Recovery Market Outlook, by Technique, Value (US$ Billion), 2020-2033
- Thermal EOR
- Gas Injection EOR
- Chemical EOR
- Microbial & Emerging Methods
- Global Enhanced Oil Recovery Market Outlook, by Offering, Value (US$ Billion), 2020-2033
- Equipment
- Chemicals
- Services
- Global Enhanced Oil Recovery Market Outlook, by Reservoir Type, Value (US$ Billion), 2020-2033
- Sandstone
- Carbonate
- Heavy Oil & Oil Sands
- Unconventional & Tight
- Global Enhanced Oil Recovery Market Outlook, by Deployment, Value (US$ Billion), 2020-2033
- Onshore
- Offshore
- Global Enhanced Oil Recovery Market Outlook, by Region, Value (US$ Billion), 2020-2033
- North America
- Europe
- Asia Pacific
- Latin America
- Middle East & Africa
- Global Enhanced Oil Recovery Market Outlook, by Technique, Value (US$ Billion), 2020-2033
- North America Enhanced Oil Recovery Market Outlook, 2020-2033
- North America Enhanced Oil Recovery Market Outlook, by Technique, Value (US$ Billion), 2020-2033
- Thermal EOR
- Gas Injection EOR
- Chemical EOR
- Microbial & Emerging Methods
- North America Enhanced Oil Recovery Market Outlook, by Offering, Value (US$ Billion), 2020-2033
- Equipment
- Chemicals
- Services
- North America Enhanced Oil Recovery Market Outlook, by Reservoir Type, Value (US$ Billion), 2020-2033
- Sandstone
- Carbonate
- Heavy Oil & Oil Sands
- Unconventional & Tight
- North America Enhanced Oil Recovery Market Outlook, by Deployment, Value (US$ Billion), 2020-2033
- Onshore
- Offshore
- North America Enhanced Oil Recovery Market Outlook, by Country, Value (US$ Billion), 2020-2033
- United States Enhanced Oil Recovery Market Outlook, by Technique, 2020-2033
- United States Enhanced Oil Recovery Market Outlook, by Offering, 2020-2033
- United States Enhanced Oil Recovery Market Outlook, by Reservoir Type, 2020-2033
- United States Enhanced Oil Recovery Market Outlook, by Deployment, 2020-2033
- Canada Enhanced Oil Recovery Market Outlook, by Technique, 2020-2033
- Canada Enhanced Oil Recovery Market Outlook, by Offering, 2020-2033
- Canada Enhanced Oil Recovery Market Outlook, by Reservoir Type, 2020-2033
- Canada Enhanced Oil Recovery Market Outlook, by Deployment, 2020-2033
- North America Enhanced Oil Recovery Market Outlook, by Technique, Value (US$ Billion), 2020-2033
- Europe Enhanced Oil Recovery Market Outlook, 2020-2033
- Europe Enhanced Oil Recovery Market Outlook, by Technique, Value (US$ Billion), 2020-2033
- Thermal EOR
- Gas Injection EOR
- Chemical EOR
- Microbial & Emerging Methods
- Europe Enhanced Oil Recovery Market Outlook, by Offering, Value (US$ Billion), 2020-2033
- Equipment
- Chemicals
- Services
- Europe Enhanced Oil Recovery Market Outlook, by Reservoir Type, Value (US$ Billion), 2020-2033
- Sandstone
- Carbonate
- Heavy Oil & Oil Sands
- Unconventional & Tight
- Europe Enhanced Oil Recovery Market Outlook, by Deployment, Value (US$ Billion), 2020-2033
- Onshore
- Offshore
- Europe Enhanced Oil Recovery Market Outlook, by Country, Value (US$ Billion), 2020-2033
- United Kingdom Enhanced Oil Recovery Market Outlook, by Technique, 2020-2033
- United Kingdom Enhanced Oil Recovery Market Outlook, by Offering, 2020-2033
- United Kingdom Enhanced Oil Recovery Market Outlook, by Reservoir Type, 2020-2033
- United Kingdom Enhanced Oil Recovery Market Outlook, by Deployment, 2020-2033
- Norway Enhanced Oil Recovery Market Outlook, by Technique, 2020-2033
- Norway Enhanced Oil Recovery Market Outlook, by Offering, 2020-2033
- Norway Enhanced Oil Recovery Market Outlook, by Reservoir Type, 2020-2033
- Norway Enhanced Oil Recovery Market Outlook, by Deployment, 2020-2033
- Europe Enhanced Oil Recovery Market Outlook, by Technique, Value (US$ Billion), 2020-2033
- Asia Pacific Enhanced Oil Recovery Market Outlook, 2020-2033
- Asia Pacific Enhanced Oil Recovery Market Outlook, by Technique, Value (US$ Billion), 2020-2033
- Thermal EOR
- Gas Injection EOR
- Chemical EOR
- Microbial & Emerging Methods
- Asia Pacific Enhanced Oil Recovery Market Outlook, by Offering, Value (US$ Billion), 2020-2033
- Equipment
- Chemicals
- Services
- Asia Pacific Enhanced Oil Recovery Market Outlook, by Reservoir Type, Value (US$ Billion), 2020-2033
- Sandstone
- Carbonate
- Heavy Oil & Oil Sands
- Unconventional & Tight
- Asia Pacific Enhanced Oil Recovery Market Outlook, by Deployment, Value (US$ Billion), 2020-2033
- Onshore
- Offshore
- Asia Pacific Enhanced Oil Recovery Market Outlook, by Country, Value (US$ Billion), 2020-2033
- China Enhanced Oil Recovery Market Outlook, by Technique, 2020-2033
- China Enhanced Oil Recovery Market Outlook, by Offering, 2020-2033
- China Enhanced Oil Recovery Market Outlook, by Reservoir Type, 2020-2033
- China Enhanced Oil Recovery Market Outlook, by Deployment, 2020-2033
- Indonesia Enhanced Oil Recovery Market Outlook, by Technique, 2020-2033
- Indonesia Enhanced Oil Recovery Market Outlook, by Offering, 2020-2033
- Indonesia Enhanced Oil Recovery Market Outlook, by Reservoir Type, 2020-2033
- Indonesia Enhanced Oil Recovery Market Outlook, by Deployment, 2020-2033
- India Enhanced Oil Recovery Market Outlook, by Technique, 2020-2033
- India Enhanced Oil Recovery Market Outlook, by Offering, 2020-2033
- India Enhanced Oil Recovery Market Outlook, by Reservoir Type, 2020-2033
- India Enhanced Oil Recovery Market Outlook, by Deployment, 2020-2033
- Malaysia Enhanced Oil Recovery Market Outlook, by Technique, 2020-2033
- Malaysia Enhanced Oil Recovery Market Outlook, by Offering, 2020-2033
- Malaysia Enhanced Oil Recovery Market Outlook, by Reservoir Type, 2020-2033
- Malaysia Enhanced Oil Recovery Market Outlook, by Deployment, 2020-2033
- Asia Pacific Enhanced Oil Recovery Market Outlook, by Technique, Value (US$ Billion), 2020-2033
- Latin America Enhanced Oil Recovery Market Outlook, 2020-2033
- Latin America Enhanced Oil Recovery Market Outlook, by Technique, Value (US$ Billion), 2020-2033
- Thermal EOR
- Gas Injection EOR
- Chemical EOR
- Microbial & Emerging Methods
- Latin America Enhanced Oil Recovery Market Outlook, by Offering, Value (US$ Billion), 2020-2033
- Equipment
- Chemicals
- Services
- Latin America Enhanced Oil Recovery Market Outlook, by Reservoir Type, Value (US$ Billion), 2020-2033
- Sandstone
- Carbonate
- Heavy Oil & Oil Sands
- Unconventional & Tight
- Latin America Enhanced Oil Recovery Market Outlook, by Deployment, Value (US$ Billion), 2020-2033
- Onshore
- Offshore
- Latin America Enhanced Oil Recovery Market Outlook, by Country, Value (US$ Billion), 2020-2033
- Venezuela Enhanced Oil Recovery Market Outlook, by Technique, 2020-2033
- Venezuela Enhanced Oil Recovery Market Outlook, by Offering, 2020-2033
- Venezuela Enhanced Oil Recovery Market Outlook, by Reservoir Type, 2020-2033
- Venezuela Enhanced Oil Recovery Market Outlook, by Deployment, 2020-2033
- Brazil Enhanced Oil Recovery Market Outlook, by Technique, 2020-2033
- Brazil Enhanced Oil Recovery Market Outlook, by Offering, 2020-2033
- Brazil Enhanced Oil Recovery Market Outlook, by Reservoir Type, 2020-2033
- Brazil Enhanced Oil Recovery Market Outlook, by Deployment, 2020-2033
- Argentina Enhanced Oil Recovery Market Outlook, by Technique, 2020-2033
- Argentina Enhanced Oil Recovery Market Outlook, by Offering, 2020-2033
- Argentina Enhanced Oil Recovery Market Outlook, by Reservoir Type, 2020-2033
- Argentina Enhanced Oil Recovery Market Outlook, by Deployment, 2020-2033
- Colombia Enhanced Oil Recovery Market Outlook, by Technique, 2020-2033
- Colombia Enhanced Oil Recovery Market Outlook, by Offering, 2020-2033
- Colombia Enhanced Oil Recovery Market Outlook, by Reservoir Type, 2020-2033
- Colombia Enhanced Oil Recovery Market Outlook, by Deployment, 2020-2033
- Mexico Enhanced Oil Recovery Market Outlook, by Technique, 2020-2033
- Mexico Enhanced Oil Recovery Market Outlook, by Offering, 2020-2033
- Mexico Enhanced Oil Recovery Market Outlook, by Reservoir Type, 2020-2033
- Mexico Enhanced Oil Recovery Market Outlook, by Deployment, 2020-2033
- Latin America Enhanced Oil Recovery Market Outlook, by Technique, Value (US$ Billion), 2020-2033
- Middle East & Africa Enhanced Oil Recovery Market Outlook, 2020-2033
- Middle East & Africa Enhanced Oil Recovery Market Outlook, by Technique, Value (US$ Billion), 2020-2033
- Thermal EOR
- Gas Injection EOR
- Chemical EOR
- Microbial & Emerging Methods
- Middle East & Africa Enhanced Oil Recovery Market Outlook, by Offering, Value (US$ Billion), 2020-2033
- Equipment
- Chemicals
- Services
- Middle East & Africa Enhanced Oil Recovery Market Outlook, by Reservoir Type, Value (US$ Billion), 2020-2033
- Sandstone
- Carbonate
- Heavy Oil & Oil Sands
- Unconventional & Tight
- Middle East & Africa Enhanced Oil Recovery Market Outlook, by Deployment, Value (US$ Billion), 2020-2033
- Onshore
- Offshore
- Middle East & Africa Enhanced Oil Recovery Market Outlook, by Country, Value (US$ Billion), 2020-2033
- Saudi Arabia Enhanced Oil Recovery Market Outlook, by Technique, 2020-2033
- Saudi Arabia Enhanced Oil Recovery Market Outlook, by Offering, 2020-2033
- Saudi Arabia Enhanced Oil Recovery Market Outlook, by Reservoir Type, 2020-2033
- Saudi Arabia Enhanced Oil Recovery Market Outlook, by Deployment, 2020-2033
- Oman Enhanced Oil Recovery Market Outlook, by Technique, 2020-2033
- Oman Enhanced Oil Recovery Market Outlook, by Offering, 2020-2033
- Oman Enhanced Oil Recovery Market Outlook, by Reservoir Type, 2020-2033
- Oman Enhanced Oil Recovery Market Outlook, by Deployment, 2020-2033
- Kuwait Enhanced Oil Recovery Market Outlook, by Technique, 2020-2033
- Kuwait Enhanced Oil Recovery Market Outlook, by Offering, 2020-2033
- Kuwait Enhanced Oil Recovery Market Outlook, by Reservoir Type, 2020-2033
- Kuwait Enhanced Oil Recovery Market Outlook, by Deployment, 2020-2033
- Iran Enhanced Oil Recovery Market Outlook, by Technique, 2020-2033
- Iran Enhanced Oil Recovery Market Outlook, by Offering, 2020-2033
- Iran Enhanced Oil Recovery Market Outlook, by Reservoir Type, 2020-2033
- Iran Enhanced Oil Recovery Market Outlook, by Deployment, 2020-2033
- United Arab Emirates Enhanced Oil Recovery Market Outlook, by Technique, 2020-2033
- United Arab Emirates Enhanced Oil Recovery Market Outlook, by Offering, 2020-2033
- United Arab Emirates Enhanced Oil Recovery Market Outlook, by Reservoir Type, 2020-2033
- United Arab Emirates Enhanced Oil Recovery Market Outlook, by Deployment, 2020-2033
- Egypt Enhanced Oil Recovery Market Outlook, by Technique, 2020-2033
- Egypt Enhanced Oil Recovery Market Outlook, by Offering, 2020-2033
- Egypt Enhanced Oil Recovery Market Outlook, by Reservoir Type, 2020-2033
- Egypt Enhanced Oil Recovery Market Outlook, by Deployment, 2020-2033
- Algeria Enhanced Oil Recovery Market Outlook, by Technique, 2020-2033
- Algeria Enhanced Oil Recovery Market Outlook, by Offering, 2020-2033
- Algeria Enhanced Oil Recovery Market Outlook, by Reservoir Type, 2020-2033
- Algeria Enhanced Oil Recovery Market Outlook, by Deployment, 2020-2033
- Nigeria Enhanced Oil Recovery Market Outlook, by Technique, 2020-2033
- Nigeria Enhanced Oil Recovery Market Outlook, by Offering, 2020-2033
- Nigeria Enhanced Oil Recovery Market Outlook, by Reservoir Type, 2020-2033
- Nigeria Enhanced Oil Recovery Market Outlook, by Deployment, 2020-2033
- Middle East & Africa Enhanced Oil Recovery Market Outlook, by Technique, Value (US$ Billion), 2020-2033
- Competitive Landscape
- Market Concentration and Industry Leaders
- Competitive Differentiation
- Strategic Initiatives
- Recent Industry Developments
- Company Profiles
- SLB
- Halliburton Company
- Baker Hughes Company
- Weatherford International plc
- NOV Inc.
- TechnipFMC plc
- Occidental Petroleum Corporation
- Chevron Corporation
- Exxon Mobil Corporation
- China Petroleum & Chemical Corporation
- Petróleo Brasileiro S.A.
- Cenovus Energy Inc.
- SNF Group
- BASF SE
- Appendix
- Research Methodology
- Report Assumptions
- Acronyms and Abbreviations
Technique
- Thermal EOR
- Gas Injection EOR
- Chemical EOR
- Microbial & Emerging Methods
Offering
- Equipment
- Chemicals
- Services
Reservoir Type
- Sandstone
- Carbonate
- Heavy Oil & Oil Sands
- Unconventional & Tight
Deployment
- Onshore
- Offshore
Regions
- North America
- Europe
- Asia Pacific
- Latin America
- Middle East & Africa
Our Research Methodology
Considering the volatility of business today, traditional approaches to strategizing a game plan can be unfruitful if not detrimental. True ambiguity is no way to determine a forecast. A myriad of predetermined factors must be accounted for such as the degree of risk involved, the magnitude of circumstances, as well as conditions or consequences that are not known or unpredictable. To circumvent binary views that cast uncertainty, the application of market research intelligence to strategically posture, move, and enable actionable outcomes is necessary.
View Methodology
Quality Assured
Rigorous Validation Process

Confidentiality Assured
End-to-end Data Security

Custom Research Services
Tailored To Your Objectives
FAQs
The market is valued at US$ 46.5 billion in 2026, measuring the equipment, chemicals and services supplied rather than the incremental oil produced.
The market is projected to reach US$ 58.9 billion by 2033, growing at a 3.43% CAGR and adding US$ 12.4 billion in absolute opportunity.
Thermal EOR leads with 42.0% share in 2026, because steam-based methods are the only practical way to mobilise heavy oil and bitumen.
Unconventional & Tight reservoirs grow fastest at a 6.2% CAGR, while Chemical EOR leads technique growth at 5.1% through 2033.
North America holds 38.0% share in 2026, supported by United States carbon dioxide flooding infrastructure and Canada thermal recovery operations in Alberta.
Related Reports
Biochar Gasification Market Size, Share, Insights, Competitive Landscape, and Forecast 2026 to 2033
The global biochar gasification market is valued at US$0.6 billion in 2026, reaching US$1.4 billion by 2033, growing at a 12.87% CAGR
AC-Coupled Energy Storage Inverter Market Size, Share, Insights, Competitive Landscape, and Forecast 2026 to 2033
The AC-coupled energy storage inverter market is forecast to grow from US$ 4.2 billion in 2026 to US$ 10.5 billion by 2033 at a 13.99% CAGR.
Steam Turbine Aftermarket Size, Share, Insights, Competitive Landscape, and Forecast 2026 to 2033
The Steam Turbine Aftermarket is projected to rise from US$ 4.56 billion in 2026 to US$ 6.29 billion by 2033 at a 4.7% CAGR. Explore key service trends.
Power EPC Market Size, Share, Insights, Competitive Landscape, and Forecast 2026 to 2033
Power EPC Market is projected to rise from US$ 780.56 billion in 2026 to US$ 1,220.97 billion by 2033 at a 6.6% CAGR. Explore generation and project trends.
Port Electrification Market Size, Share, Insights, Competitive Landscape, and Forecast 2026 to 2033
Explore the port electrification market, valued at US$ 6.8 billion in 2026 and forecast to reach US$ 16.4 billion by 2033, growing at a 13.4% CAGR.
Polycrystalline Solar Cell Market Size, Share, Insights, Competitive Landscape, and Forecast 2026 to 2033
Explore the polycrystalline solar cell market, valued at US$ 5.4 billion in 2026 and projected to reach US$ 6.6 billion by 2033, growing at 2.9% CAGR.