



Digital Biomanufacturing Market
Digital Biomanufacturing Market Size, Share, Insights, Competitive Landscape, and Forecast 2026 to 2033
Digital Biomanufacturing Market Analysis, 2026–2033
Digital Biomanufacturing Market
Digital Biomanufacturing Market Size, Share, Insights, Competitive Landscape, and Forecast 2026 to 2033
Digital Biomanufacturing Market Size and Trend Analysis
How Big Is the Digital Biomanufacturing Market in 2026?
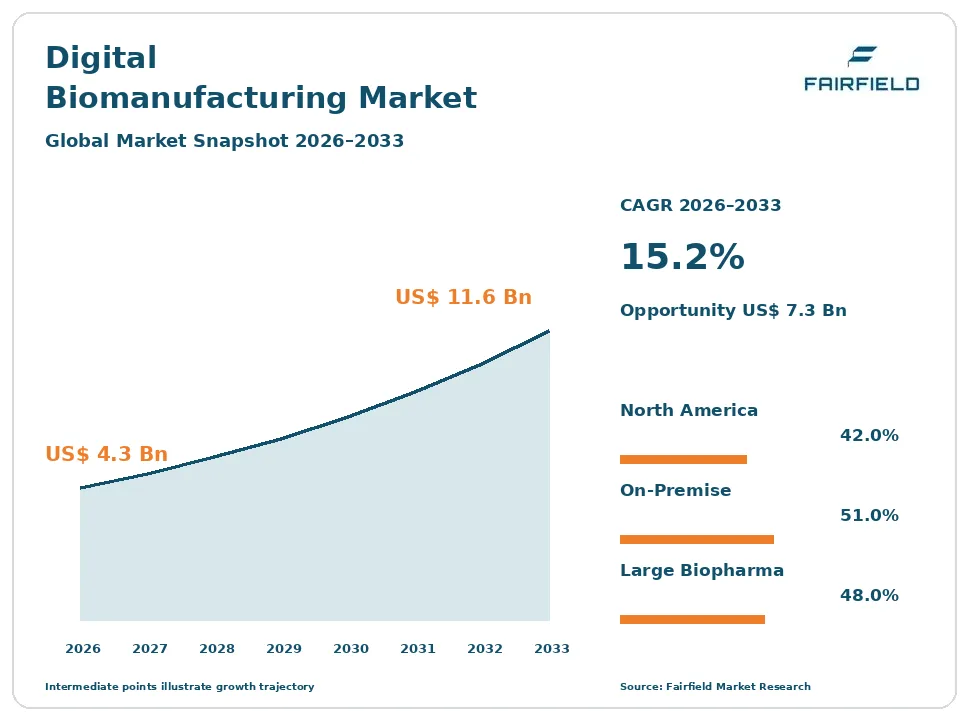
The global Digital Biomanufacturing market size is expected to be valued at US$ 4.3 billion in 2026 and projected to reach US$ 11.6 billion by 2033, growing at a CAGR of 15.2% between 2026 and 2033.
Between 2020 and 2025 the market expanded at roughly a 13.8% CAGR, rising from a small base as sponsors replaced paper batch records during pandemic-era capacity builds. Three factors now carry growth. First, batch release cost and cycle time make electronic records an easy financial case. Second, regulators actively encourage continuous manufacturing, real-time release and inline measurement. Third, multi-product flexible facilities cannot be run on paper logbooks. The direction of travel is steady rather than sudden. Validation economics, not technology, set the pace, so the layer that spreads fastest is the one that removes paperwork rather than the one that optimises the process.
Key Report Takeaways
- By Solution Type: Manufacturing Execution Systems and Electronic Batch Records held 26% share in 2026, while Digital Twins and Process Modeling is projected to expand at a 20.4% CAGR through 2033, driven by scale-up prediction in multi-product plants.
- By Deployment Mode: On-Premise held 51% share in 2026, while Cloud is projected to expand at a 19.8% CAGR through 2033, as GAMP 5 Second Edition clarified how validated workloads may sit with external service providers.
- By Process Stage: Upstream Manufacturing held 28% share in 2026, while Process Development and Scale-Up is projected to expand at an 18.1% CAGR through 2033, because modelling pays back fastest before a process is locked.
- By End User: Large Biopharmaceutical Manufacturers held 48% share in 2026, while Contract Development and Manufacturing Organizations are projected to expand at an 18.6% CAGR through 2033, reflecting client audits that now demand contemporaneous electronic data.
- By Geography: North America held 42% share in 2026, while Asia Pacific is projected to expand at a 19.3% CAGR through 2033, supported by new biologics capacity in China, India and South Korea.
Global Digital Biomanufacturing Market Trends and Insights
Drivers Impact Analysis
| Driver | Impact on CAGR Forecast | Geographic Relevance | Impact Timeline |
| Batch release cost and the appeal of review by exception | High | North America, Europe | Short term ≤2 years |
| Experienced bioprocess staff shortages and multi-product flexible facilities | Medium | Global, strongest in Asia Pacific | Medium term 2–4 years |
The two forces below explain most of the forecast growth in biopharmaceutical manufacturing software.
Batch Release Cycle Time and Review by Exception Pull Electronic Records Into Commercial Biologics Plants
Batch release economics give digital biomanufacturing its clearest commercial case. A paper batch record for one monoclonal antibody campaign can run to several hundred pages, and quality review of that record often takes longer than the production run. Electronic batch records with built-in parameter checking remove most of that effort, because only flagged exceptions reach a human reviewer. Manufacturers call this review by exception, and it compresses release from weeks to days.
The mechanism is regulatory rather than technical. 21 CFR Part 11 and EU GMP Annex 11 already accept electronic records and signatures where systems are validated and audit trails complete. Data integrity guidance from the MHRA and the FDA, built on the ALCOA+ principles, then makes paper harder to defend than a controlled system. Plants therefore buy execution systems first and optimisation software much later.
Flexible Multi-Product Facilities and Bioprocess Staff Shortages Force Automation Across Biologics Operations
Workforce scarcity is converting automation from a preference into a requirement. Experienced bioprocess engineers and qualified quality reviewers are in short supply in every major manufacturing cluster. Facilities respond by encoding process knowledge in recipes, alarms and advanced process control, so that a smaller team can supervise more suites. Automation also narrows operator-to-operator variability, which is the practical reason deviations fall after an execution system goes live.
The structural cause is the shift away from single-product blockbuster plants. Modern facilities run several molecules through shared single-use suites, with frequent changeover and short campaigns. Paper logbooks and spreadsheet scheduling cannot track that cadence reliably. ISA-88 recipe models and ISA-95 enterprise-control integration give vendors a common vocabulary for describing those changeovers, which is why orchestration and scheduling software sells into new multi-product sites first.
Restraints Impact Analysis
| Restraint | Impact on CAGR Forecast | Geographic Relevance | Impact Timeline |
| Validation and change control cost on every software change | High | Global | Long term ≥4 years |
| Legacy equipment that will not expose usable process data | Medium | Europe, North America | Medium term 2–4 years |
The restraints below slow adoption without reversing it, and both are operational rather than technical.
Qualification Cost on Every Change Keeps Software Refresh Cycles Slow in Regulated Biologics Plants
Validation economics limit how much software a regulated plant will buy. In a licensed facility every configuration change is a qualification event, requiring risk assessment, test scripts, executed evidence and quality approval. A minor version upgrade that takes an hour technically can take months to release into production. Buyers therefore favour fewer, larger vendors who can carry the documentation burden, and they avoid products that change quickly.
The cost sits in people, not licences. Qualification consumes validation engineers, quality assurance reviewers and subject matter experts for weeks, and the same evidence must be reproduced for each site and each regulated market. GAMP 5 and its second edition reduce this through critical thinking and supplier leverage, and address agile, cloud and artificial intelligence delivery. Even so, change control remains the single largest line item in most digital programmes.
Legacy Skids and Closed Controllers Block the Data Contextualisation Behind Digital Twin Projects
Data contextualisation, not modelling, is where most digital biomanufacturing projects stall. Bioprocess data sits in historians, equipment controllers, laboratory systems and paper, recorded on different time bases and with inconsistent batch identifiers. Before any model can be built, someone must align a chromatography skid trace with an offline cell count and a deviation record. That plumbing work routinely consumes most of a project budget.
The underlying cause is installed hardware. Bioreactor skids, filtration units and freeze dryers have fifteen to twenty year lives, and many shipped with closed controllers, proprietary protocols or no network interface at all. Retrofitting gateways reopens qualification for the equipment itself, which few plants will accept mid-campaign. Plant network segregation under ISA/IEC 62443 adds further constraints, because process control networks cannot simply be opened to analytics platforms without a documented cybersecurity assessment.
Market Opportunities
Two revenue pools are opening that are distinct from general software demand in biologics manufacturing.
Contract Manufacturers Open a Managed Validation and Integration Services Pool in Bioprocess Software
Managed validation services are becoming a recurring revenue pool rather than a project cost. Contract development and manufacturing organisations run many clients across shared suites, and each client expects contemporaneous electronic data, audit trail review and segregated records. Few of these organisations can staff that internally at the pace their order books demand. Vendors that sell qualified configurations, pre-executed test evidence and periodic review as a subscription capture spend that previously went to consultancies.
Capture favours suppliers with documented quality systems and regulatory experience. The demand comes from mid-sized contract manufacturers expanding into biologics fill-finish and cell culture, and from emerging biotechnology companies with no internal quality infrastructure. PIC/S guidance on computerised systems in regulated environments, with its data integrity expectations, gives both groups an explicit checklist that service contracts can be written against.
Real-Time Release and Spectroscopic Soft Sensors Create a New Inline Measurement Revenue Pool
Real-time release testing opens a measurement revenue pool that barely existed five years ago. Replacing an offline assay with an inline spectroscopic prediction removes a hold step, frees quality control laboratory capacity and shortens working capital cycles. The sale is not only the probe. It is the chemometric model, its lifecycle management, and the documentation that supports the predicted attribute as a registered analytical procedure.
Suppliers combining optical hardware with modelling services are best placed. Demand comes from continuous and intensified upstream processes, from perfusion operations and from downstream chromatography pooling decisions. The FDA Process Analytical Technology framework established the principle, and ICH Q14 with the revised ICH Q2 on analytical procedure development and validation now gives soft sensors a defined path through regulatory filings and post-approval change management.
Segment Analysis
By Solution Type: Execution Systems Hold the Base While Digital Twins Scale Quickest
Manufacturing Execution Systems and Electronic Batch Records lead with 26% share in 2026, because they are the only category with an unambiguous payback. Removing paper review shortens batch release, reduces documentation deviations and satisfies inspectors directly, so the purchase survives capital review in a way that optimisation software often does not. Process control and automation follows closely, since control systems are bought with the plant.
Digital Twins and Process Modeling is the fastest-growing category at a 20.4% CAGR through 2033. Mechanistic and hybrid models now predict scale-up behaviour, chromatography breakthrough and media depletion well enough to cut wet experiments. Their constraint is data quality rather than mathematics. For vendors, the implication is that modelling sells best when bundled with historians and contextualisation tooling, not as a standalone analytics product.
By Deployment Mode: On-Premise Still Dominates as Cloud Delivery Accelerates
On-Premise deployment holds 51% share in 2026, reflecting a conservative installed base and genuine engineering constraints. Execution and control layers must keep running when network links fail, and quality organisations remain cautious about records held outside the site. Plant network segregation requirements under ISA/IEC 62443 reinforce that position, because process control traffic is deliberately isolated from enterprise networks.
Cloud deployment grows fastest at a 19.8% CAGR through 2033, led by laboratory informatics, quality management and analytics rather than real-time control. GAMP 5 Second Edition addressed cloud and service provider models explicitly, which removed much of the ambiguity that previously stalled approvals. Hybrid architectures, with execution on site and analytics off site, are becoming the practical default and shape how vendors now package their offerings.
By Process Stage: Upstream Manufacturing Leads While Process Development Grows Fastest
Upstream Manufacturing accounts for 28% share in 2026. Cell culture generates the densest sensor data, carries the most variability and determines downstream yield, so it attracts control and monitoring investment first. Inline sensing, soft sensors and advanced process control are concentrated here, and perfusion operations in particular cannot be supervised manually over long run times.
Process Development and Scale-Up expands fastest at an 18.1% CAGR through 2033. Modelling pays back most before a process is locked, when changes are cheap and no licence is at stake. Machine learning for design of experiments, scale-down correlation and deviation prediction is adopted far more freely in development than in a validated suite. The implication is that vendors should seed development groups early, then follow the molecule into commercial manufacturing.
By End User: Large Manufacturers Spend Most While Contract Organisations Grow Fastest
Large Biopharmaceutical Manufacturers hold 48% share in 2026. They operate the most licensed sites, carry the largest validation teams and face the heaviest inspection burden across multiple regulated markets. Their programmes are also the only ones large enough to justify enterprise historians, site-wide advanced process control and bespoke integration work across dozens of systems.
Contract Development and Manufacturing Organizations grow fastest at an 18.6% CAGR through 2033. Their clients now audit data integrity directly, and winning biologics work increasingly requires demonstrable electronic batch records and audit trail review. Rapid capacity additions give them greenfield sites without legacy controllers, so they can specify contextualised data platforms at design stage. Emerging biotechnology companies follow, buying informatics before they ever own a plant.
Geography Analysis
Which Region Is Leading the Digital Biomanufacturing Market?
North America leads the market with 42% share in 2026, driven by the United States and a smaller but sophisticated Canadian base. The region hosts the largest concentration of licensed biologics plants, the deepest validation labour pool and the most demanding inspection regime. 21 CFR Part 11 has shaped electronic record practice there for over two decades, so the installed base of execution systems is mature and replacement cycles, not first adoption, now drive spend. The FDA Emerging Technology Programme gives sponsors a formal route to discuss continuous manufacturing, inline measurement and novel control strategies before filing, which lowers the perceived regulatory risk of advanced process control. The main change ahead is the shift from records compliance toward predictive control and real-time release.
Europe Converts Computerised Systems Rules Into Structured Digital Investment
Europe holds 28% share in 2026, anchored by Germany, Ireland, Switzerland, Denmark and Belgium. The regional pattern is distinctive: investment is driven as much by regulation as by cost. EU GMP Annex 11 sets explicit expectations for computerised systems, supplier assessment and audit trails, and inspectorates examine those controls closely. Ireland and Denmark in particular host large export-oriented biologics capacity where release throughput directly constrains revenue. German engineering groups also supply much of the control and recipe technology used globally, which keeps domestic reference projects well funded. The region’s constraint is an older installed base of equipment with closed controllers. The opportunity lies in the revision of computerised systems rules, which is prompting many sites to reassess validation strategy rather than patch it.
Which Region Is Growing Fastest in the Digital Biomanufacturing Market?
Asia Pacific is the fastest-growing region at a 19.3% CAGR between 2026 and 2033, expanding from 21% share in 2026, led by China, India, South Korea, Japan and Singapore. The reason is greenfield construction. New biologics and biosimilar plants are being built without legacy controllers, so contextualised data platforms, execution systems and historians can be specified at design stage rather than retrofitted. South Korea has concentrated very large contract manufacturing capacity, where client audits force electronic records early. India is upgrading quality systems under sustained export inspection pressure, and data integrity findings have made automated audit trails a commercial necessity. China is investing heavily in domestic biologics. The constraint is a shortage of validation engineers, which favours vendors offering managed services.
Latin America Builds Local Biologics Capacity From a Narrow Automation Base
Latin America contributes 5% of the market in 2026, with Brazil, Mexico, Argentina and Colombia accounting for most activity. Public biologics and vaccine capacity, often built through technology transfer agreements, is the principal source of demand. Those agreements usually import both the process and the documentation system, which pulls execution software in behind them. Barriers are real: capital budgets are tight, qualified automation engineers are scarce, currency volatility complicates multi-year software contracts, and many plants still run hybrid paper and electronic records. Regulatory modernisation by ANVISA and COFEPRIS is gradually raising documentation expectations. The clearest near-term opportunity is cloud-delivered quality management and laboratory informatics, which avoids the capital and staffing demands of a full on-site deployment.
Middle East & Africa Ties Digital Adoption to New Localisation Programmes
Middle East & Africa represents 4% of the market in 2026, concentrated in Saudi Arabia, the United Arab Emirates, Egypt and South Africa. Demand follows pharmaceutical localisation policy rather than existing manufacturing scale. Sovereign investment programmes are funding new fill-finish and biologics facilities that are specified to international standards from the outset, which means execution systems and historians are included in the original build. Barriers include a very small pool of experienced bioprocess and validation staff, dependence on external integrators, and fragmented regulatory capability across the wider region. South Africa has the most established manufacturing base and the clearest vaccine ambitions. The opportunity is turnkey delivery, where a single supplier provides the plant, the software and the qualification evidence together.
Competitive Landscape
The market is moderately concentrated, and the concentration is a direct consequence of validation economics. Buyers in regulated plants cannot afford supplier risk, because a vendor failure strands qualified systems that are expensive to replace. That logic favours large industrial automation groups and established life science suppliers with documented quality systems, long product support commitments and the capacity to supply validation evidence. A long tail of specialist vendors exists in digital twins, chemometrics and laboratory informatics, but most eventually partner with or are absorbed by the larger platform suppliers rather than displacing them.
Competition turns on documentation capability more than on features. Vendors compete on the completeness of their validation packages, the depth of their bioprocess libraries, the breadth of equipment drivers and connectors they support, and their ability to integrate with existing historians and control layers. Reference installations at named inspected sites carry unusual weight. New entrants arrive from two directions: analytics and modelling specialists coming down from the data layer, and equipment suppliers extending upward from instrumentation into software. Both find that the hardest part is not the algorithm but the qualification evidence.
Strategic activity has concentrated on filling portfolio gaps rather than on scale. Automation groups have added life science specific execution and recipe capability, instrument suppliers have added analytics and informatics, and software vendors have acquired chemometrics and modelling expertise. Partnerships between control vendors and single-use equipment suppliers matter competitively because they determine whose data model becomes the plant standard.
Strategic direction is converging on three themes: reducing the cost of qualification through pre-validated configurations, solving data contextualisation before selling models, and packaging artificial intelligence in forms that a quality organisation can accept and audit.
Digital Biomanufacturing Industry Leaders
- Siemens AG
- Rockwell Automation, Inc.
- Sartorius AG
- Körber AG
- Cytiva
Recent Industry Developments
- August 2024: The European Union Artificial Intelligence Act entered into force, creating the first broad statutory framework for artificial intelligence and prompting biomanufacturers to classify and document models used in regulated production.
- September 2024: The European Medicines Agency issued its reflection paper on the use of artificial intelligence across the medicinal product lifecycle, giving sponsors a stated regulatory position on machine learning in manufacturing and quality.
- January 2025: The FDA published draft guidance on the use of artificial intelligence to support regulatory decision-making for drug and biological products, introducing a credibility assessment approach that vendors now design their models around.
- July 2025: The European Commission opened public consultation on a comprehensively revised EU GMP Annex 11 on computerised systems, signalling updated expectations on data integrity, cloud delivery and supplier management.
Companies Covered in the Report
- Siemens AG
- Rockwell Automation, Inc.
- Emerson Electric Co.
- Honeywell International Inc.
- ABB Ltd
- Sartorius AG
- Cytiva
- Thermo Fisher Scientific Inc.
- Repligen Corporation
- Körber AG
- Dassault Systèmes SE
- AVEVA Group Limited
- Veeva Systems Inc.
Digital Biomanufacturing Market Report Scope
This report covers the software, data and automation layer of biopharmaceutical and biologics manufacturing, including execution systems, process control, process analytical technology, digital twins, data platforms, informatics, quality systems and related validation services. Physical bioprocess equipment, single-use consumables and media are covered separately, as is industrial and food fermentation. The base year is 2025 and the forecast period runs from 2026 to 2033, with all values in US$ Billion.
Solution Type
- Manufacturing Execution Systems and Electronic Batch Records
- Process Control and Automation Systems
- Process Analytical Technology and Soft Sensors
- Digital Twins and Process Modeling
- Data Historians and Contextualized Data Platforms
- Laboratory Information Management Systems and Electronic Laboratory Notebooks
- Quality Management and Deviation and CAPA Systems
- Validation, Integration and Managed Services
Deployment Mode
- On-Premise
- Hybrid
- Cloud
Process Stage
- Process Development and Scale-Up
- Upstream Manufacturing
- Downstream Purification
- Fill-Finish and Packaging
- Quality Control and Batch Release
End User
- Large Biopharmaceutical Manufacturers
- Contract Development and Manufacturing Organizations
- Emerging Biotechnology Companies
- Academic and Research Institutes
Regions
- North America
- Europe
- Asia Pacific
- Latin America
- Middle East & Africa
Key Questions Answered in the Report
How big is the digital biomanufacturing market in 2026?
The market is valued at US$ 4.3 billion in 2026, covering the software, data and automation layer used across regulated biologics manufacturing operations worldwide.
What is the forecast size and CAGR through 2033?
The market is projected to reach US$ 11.6 billion by 2033, growing at a 15.2% CAGR and adding US$ 7.3 billion in absolute opportunity.
Which solution type leads the digital biomanufacturing market?
Manufacturing Execution Systems and Electronic Batch Records lead with 26% share in 2026, because removing paper review delivers the clearest and fastest financial payback.
Which segment and region are growing fastest?
Digital Twins and Process Modeling grows fastest at a 20.4% CAGR, while Asia Pacific expands at a 19.3% CAGR on greenfield biologics capacity.
Which region holds the largest share and how concentrated is the market?
North America holds 42% share in 2026, and the market is moderately concentrated because validation and documentation requirements favour large, well-established suppliers.
1. Executive Summary
1.1. Global Digital Biomanufacturing Market Snapshot
1.2. Future Projections
1.3. Key Report Takeaways
1.4. Regional Snapshot
2. Market Overview
2.1. Market Definition and Report Scope
2.2. Historical Trends 2020–2025
2.3. Market Dynamics
2.3.1. Drivers
2.3.1.1. Batch Release Cycle Time and Review by Exception Pull Electronic Records Into Commercial Biologics Plants
2.3.1.2. Flexible Multi-Product Facilities and Bioprocess Staff Shortages Force Automation Across Biologics Operations
2.3.2. Restraints
2.3.2.1. Qualification Cost on Every Change Keeps Software Refresh Cycles Slow in Regulated Biologics Plants
2.3.2.2. Legacy Skids and Closed Controllers Block the Data Contextualisation Behind Digital Twin Projects
2.3.3. Market Opportunities
2.3.3.1. Contract Manufacturers Open a Managed Validation and Integration Services Pool in Bioprocess Software
2.3.3.2. Real-Time Release and Spectroscopic Soft Sensors Create a New Inline Measurement Revenue Pool
3. Global Digital Biomanufacturing Market Outlook, 2020–2033
3.1. Global Digital Biomanufacturing Market Outlook, by Solution Type, Value (US$ Billion), 2020–2033
3.1.1. Manufacturing Execution Systems and Electronic Batch Records
3.1.2. Process Control and Automation Systems
3.1.3. Process Analytical Technology and Soft Sensors
3.1.4. Digital Twins and Process Modeling
3.1.5. Data Historians and Contextualized Data Platforms
3.1.6. Laboratory Information Management Systems and Electronic Laboratory Notebooks
3.1.7. Quality Management and Deviation and CAPA Systems
3.1.8. Validation, Integration and Managed Services
3.2. Global Digital Biomanufacturing Market Outlook, by Deployment Mode, Value (US$ Billion), 2020–2033
3.2.1. On-Premise
3.2.2. Hybrid
3.2.3. Cloud
3.3. Global Digital Biomanufacturing Market Outlook, by Process Stage, Value (US$ Billion), 2020–2033
3.3.1. Process Development and Scale-Up
3.3.2. Upstream Manufacturing
3.3.3. Downstream Purification
3.3.4. Fill-Finish and Packaging
3.3.5. Quality Control and Batch Release
3.4. Global Digital Biomanufacturing Market Outlook, by End User, Value (US$ Billion), 2020–2033
3.4.1. Large Biopharmaceutical Manufacturers
3.4.2. Contract Development and Manufacturing Organizations
3.4.3. Emerging Biotechnology Companies
3.4.4. Academic and Research Institutes
3.5. Global Digital Biomanufacturing Market Outlook, by Region, Value (US$ Billion), 2020–2033
3.5.1. North America
3.5.2. Europe
3.5.3. Asia Pacific
3.5.4. Latin America
3.5.5. Middle East & Africa
4. North America Digital Biomanufacturing Market Outlook, 2020–2033
4.1. North America Digital Biomanufacturing Market Outlook, by Solution Type, Value (US$ Billion), 2020–2033
4.1.1. Manufacturing Execution Systems and Electronic Batch Records
4.1.2. Process Control and Automation Systems
4.1.3. Process Analytical Technology and Soft Sensors
4.1.4. Digital Twins and Process Modeling
4.1.5. Data Historians and Contextualized Data Platforms
4.1.6. Laboratory Information Management Systems and Electronic Laboratory Notebooks
4.1.7. Quality Management and Deviation and CAPA Systems
4.1.8. Validation, Integration and Managed Services
4.2. North America Digital Biomanufacturing Market Outlook, by Deployment Mode, Value (US$ Billion), 2020–2033
4.2.1. On-Premise
4.2.2. Hybrid
4.2.3. Cloud
4.3. North America Digital Biomanufacturing Market Outlook, by Process Stage, Value (US$ Billion), 2020–2033
4.3.1. Process Development and Scale-Up
4.3.2. Upstream Manufacturing
4.3.3. Downstream Purification
4.3.4. Fill-Finish and Packaging
4.3.5. Quality Control and Batch Release
4.4. North America Digital Biomanufacturing Market Outlook, by End User, Value (US$ Billion), 2020–2033
4.4.1. Large Biopharmaceutical Manufacturers
4.4.2. Contract Development and Manufacturing Organizations
4.4.3. Emerging Biotechnology Companies
4.4.4. Academic and Research Institutes
4.5. North America Digital Biomanufacturing Market Outlook, by Country, Value (US$ Billion), 2020–2033
4.5.1. United States Digital Biomanufacturing Market Outlook, by Solution Type, 2020–2033
4.5.2. United States Digital Biomanufacturing Market Outlook, by Deployment Mode, 2020–2033
4.5.3. United States Digital Biomanufacturing Market Outlook, by Process Stage, 2020–2033
4.5.4. United States Digital Biomanufacturing Market Outlook, by End User, 2020–2033
4.5.5. Canada Digital Biomanufacturing Market Outlook, by Solution Type, 2020–2033
4.5.6. Canada Digital Biomanufacturing Market Outlook, by Deployment Mode, 2020–2033
4.5.7. Canada Digital Biomanufacturing Market Outlook, by Process Stage, 2020–2033
4.5.8. Canada Digital Biomanufacturing Market Outlook, by End User, 2020–2033
5. Europe Digital Biomanufacturing Market Outlook, 2020–2033
5.1. Europe Digital Biomanufacturing Market Outlook, by Solution Type, Value (US$ Billion), 2020–2033
5.1.1. Manufacturing Execution Systems and Electronic Batch Records
5.1.2. Process Control and Automation Systems
5.1.3. Process Analytical Technology and Soft Sensors
5.1.4. Digital Twins and Process Modeling
5.1.5. Data Historians and Contextualized Data Platforms
5.1.6. Laboratory Information Management Systems and Electronic Laboratory Notebooks
5.1.7. Quality Management and Deviation and CAPA Systems
5.1.8. Validation, Integration and Managed Services
5.2. Europe Digital Biomanufacturing Market Outlook, by Deployment Mode, Value (US$ Billion), 2020–2033
5.2.1. On-Premise
5.2.2. Hybrid
5.2.3. Cloud
5.3. Europe Digital Biomanufacturing Market Outlook, by Process Stage, Value (US$ Billion), 2020–2033
5.3.1. Process Development and Scale-Up
5.3.2. Upstream Manufacturing
5.3.3. Downstream Purification
5.3.4. Fill-Finish and Packaging
5.3.5. Quality Control and Batch Release
5.4. Europe Digital Biomanufacturing Market Outlook, by End User, Value (US$ Billion), 2020–2033
5.4.1. Large Biopharmaceutical Manufacturers
5.4.2. Contract Development and Manufacturing Organizations
5.4.3. Emerging Biotechnology Companies
5.4.4. Academic and Research Institutes
5.5. Europe Digital Biomanufacturing Market Outlook, by Country, Value (US$ Billion), 2020–2033
5.5.1. Germany Digital Biomanufacturing Market Outlook, by Solution Type, 2020–2033
5.5.2. Germany Digital Biomanufacturing Market Outlook, by Deployment Mode, 2020–2033
5.5.3. Germany Digital Biomanufacturing Market Outlook, by Process Stage, 2020–2033
5.5.4. Germany Digital Biomanufacturing Market Outlook, by End User, 2020–2033
5.5.5. Ireland Digital Biomanufacturing Market Outlook, by Solution Type, 2020–2033
5.5.6. Ireland Digital Biomanufacturing Market Outlook, by Deployment Mode, 2020–2033
5.5.7. Ireland Digital Biomanufacturing Market Outlook, by Process Stage, 2020–2033
5.5.8. Ireland Digital Biomanufacturing Market Outlook, by End User, 2020–2033
5.5.9. Switzerland Digital Biomanufacturing Market Outlook, by Solution Type, 2020–2033
5.5.10. Switzerland Digital Biomanufacturing Market Outlook, by Deployment Mode, 2020–2033
5.5.11. Switzerland Digital Biomanufacturing Market Outlook, by Process Stage, 2020–2033
5.5.12. Switzerland Digital Biomanufacturing Market Outlook, by End User, 2020–2033
5.5.13. Denmark Digital Biomanufacturing Market Outlook, by Solution Type, 2020–2033
5.5.14. Denmark Digital Biomanufacturing Market Outlook, by Deployment Mode, 2020–2033
5.5.15. Denmark Digital Biomanufacturing Market Outlook, by Process Stage, 2020–2033
5.5.16. Denmark Digital Biomanufacturing Market Outlook, by End User, 2020–2033
5.5.17. Belgium Digital Biomanufacturing Market Outlook, by Solution Type, 2020–2033
5.5.18. Belgium Digital Biomanufacturing Market Outlook, by Deployment Mode, 2020–2033
5.5.19. Belgium Digital Biomanufacturing Market Outlook, by Process Stage, 2020–2033
5.5.20. Belgium Digital Biomanufacturing Market Outlook, by End User, 2020–2033
6. Asia Pacific Digital Biomanufacturing Market Outlook, 2020–2033
6.1. Asia Pacific Digital Biomanufacturing Market Outlook, by Solution Type, Value (US$ Billion), 2020–2033
6.1.1. Manufacturing Execution Systems and Electronic Batch Records
6.1.2. Process Control and Automation Systems
6.1.3. Process Analytical Technology and Soft Sensors
6.1.4. Digital Twins and Process Modeling
6.1.5. Data Historians and Contextualized Data Platforms
6.1.6. Laboratory Information Management Systems and Electronic Laboratory Notebooks
6.1.7. Quality Management and Deviation and CAPA Systems
6.1.8. Validation, Integration and Managed Services
6.2. Asia Pacific Digital Biomanufacturing Market Outlook, by Deployment Mode, Value (US$ Billion), 2020–2033
6.2.1. On-Premise
6.2.2. Hybrid
6.2.3. Cloud
6.3. Asia Pacific Digital Biomanufacturing Market Outlook, by Process Stage, Value (US$ Billion), 2020–2033
6.3.1. Process Development and Scale-Up
6.3.2. Upstream Manufacturing
6.3.3. Downstream Purification
6.3.4. Fill-Finish and Packaging
6.3.5. Quality Control and Batch Release
6.4. Asia Pacific Digital Biomanufacturing Market Outlook, by End User, Value (US$ Billion), 2020–2033
6.4.1. Large Biopharmaceutical Manufacturers
6.4.2. Contract Development and Manufacturing Organizations
6.4.3. Emerging Biotechnology Companies
6.4.4. Academic and Research Institutes
6.5. Asia Pacific Digital Biomanufacturing Market Outlook, by Country, Value (US$ Billion), 2020–2033
6.5.1. China Digital Biomanufacturing Market Outlook, by Solution Type, 2020–2033
6.5.2. China Digital Biomanufacturing Market Outlook, by Deployment Mode, 2020–2033
6.5.3. China Digital Biomanufacturing Market Outlook, by Process Stage, 2020–2033
6.5.4. China Digital Biomanufacturing Market Outlook, by End User, 2020–2033
6.5.5. India Digital Biomanufacturing Market Outlook, by Solution Type, 2020–2033
6.5.6. India Digital Biomanufacturing Market Outlook, by Deployment Mode, 2020–2033
6.5.7. India Digital Biomanufacturing Market Outlook, by Process Stage, 2020–2033
6.5.8. India Digital Biomanufacturing Market Outlook, by End User, 2020–2033
6.5.9. South Korea Digital Biomanufacturing Market Outlook, by Solution Type, 2020–2033
6.5.10. South Korea Digital Biomanufacturing Market Outlook, by Deployment Mode, 2020–2033
6.5.11. South Korea Digital Biomanufacturing Market Outlook, by Process Stage, 2020–2033
6.5.12. South Korea Digital Biomanufacturing Market Outlook, by End User, 2020–2033
6.5.13. Japan Digital Biomanufacturing Market Outlook, by Solution Type, 2020–2033
6.5.14. Japan Digital Biomanufacturing Market Outlook, by Deployment Mode, 2020–2033
6.5.15. Japan Digital Biomanufacturing Market Outlook, by Process Stage, 2020–2033
6.5.16. Japan Digital Biomanufacturing Market Outlook, by End User, 2020–2033
6.5.17. Singapore Digital Biomanufacturing Market Outlook, by Solution Type, 2020–2033
6.5.18. Singapore Digital Biomanufacturing Market Outlook, by Deployment Mode, 2020–2033
6.5.19. Singapore Digital Biomanufacturing Market Outlook, by Process Stage, 2020–2033
6.5.20. Singapore Digital Biomanufacturing Market Outlook, by End User, 2020–2033
7. Latin America Digital Biomanufacturing Market Outlook, 2020–2033
7.1. Latin America Digital Biomanufacturing Market Outlook, by Solution Type, Value (US$ Billion), 2020–2033
7.1.1. Manufacturing Execution Systems and Electronic Batch Records
7.1.2. Process Control and Automation Systems
7.1.3. Process Analytical Technology and Soft Sensors
7.1.4. Digital Twins and Process Modeling
7.1.5. Data Historians and Contextualized Data Platforms
7.1.6. Laboratory Information Management Systems and Electronic Laboratory Notebooks
7.1.7. Quality Management and Deviation and CAPA Systems
7.1.8. Validation, Integration and Managed Services
7.2. Latin America Digital Biomanufacturing Market Outlook, by Deployment Mode, Value (US$ Billion), 2020–2033
7.2.1. On-Premise
7.2.2. Hybrid
7.2.3. Cloud
7.3. Latin America Digital Biomanufacturing Market Outlook, by Process Stage, Value (US$ Billion), 2020–2033
7.3.1. Process Development and Scale-Up
7.3.2. Upstream Manufacturing
7.3.3. Downstream Purification
7.3.4. Fill-Finish and Packaging
7.3.5. Quality Control and Batch Release
7.4. Latin America Digital Biomanufacturing Market Outlook, by End User, Value (US$ Billion), 2020–2033
7.4.1. Large Biopharmaceutical Manufacturers
7.4.2. Contract Development and Manufacturing Organizations
7.4.3. Emerging Biotechnology Companies
7.4.4. Academic and Research Institutes
7.5. Latin America Digital Biomanufacturing Market Outlook, by Country, Value (US$ Billion), 2020–2033
7.5.1. Brazil Digital Biomanufacturing Market Outlook, by Solution Type, 2020–2033
7.5.2. Brazil Digital Biomanufacturing Market Outlook, by Deployment Mode, 2020–2033
7.5.3. Brazil Digital Biomanufacturing Market Outlook, by Process Stage, 2020–2033
7.5.4. Brazil Digital Biomanufacturing Market Outlook, by End User, 2020–2033
7.5.5. Mexico Digital Biomanufacturing Market Outlook, by Solution Type, 2020–2033
7.5.6. Mexico Digital Biomanufacturing Market Outlook, by Deployment Mode, 2020–2033
7.5.7. Mexico Digital Biomanufacturing Market Outlook, by Process Stage, 2020–2033
7.5.8. Mexico Digital Biomanufacturing Market Outlook, by End User, 2020–2033
7.5.9. Argentina Digital Biomanufacturing Market Outlook, by Solution Type, 2020–2033
7.5.10. Argentina Digital Biomanufacturing Market Outlook, by Deployment Mode, 2020–2033
7.5.11. Argentina Digital Biomanufacturing Market Outlook, by Process Stage, 2020–2033
7.5.12. Argentina Digital Biomanufacturing Market Outlook, by End User, 2020–2033
7.5.13. Colombia Digital Biomanufacturing Market Outlook, by Solution Type, 2020–2033
7.5.14. Colombia Digital Biomanufacturing Market Outlook, by Deployment Mode, 2020–2033
7.5.15. Colombia Digital Biomanufacturing Market Outlook, by Process Stage, 2020–2033
7.5.16. Colombia Digital Biomanufacturing Market Outlook, by End User, 2020–2033
8. Middle East & Africa Digital Biomanufacturing Market Outlook, 2020–2033
8.1. Middle East & Africa Digital Biomanufacturing Market Outlook, by Solution Type, Value (US$ Billion), 2020–2033
8.1.1. Manufacturing Execution Systems and Electronic Batch Records
8.1.2. Process Control and Automation Systems
8.1.3. Process Analytical Technology and Soft Sensors
8.1.4. Digital Twins and Process Modeling
8.1.5. Data Historians and Contextualized Data Platforms
8.1.6. Laboratory Information Management Systems and Electronic Laboratory Notebooks
8.1.7. Quality Management and Deviation and CAPA Systems
8.1.8. Validation, Integration and Managed Services
8.2. Middle East & Africa Digital Biomanufacturing Market Outlook, by Deployment Mode, Value (US$ Billion), 2020–2033
8.2.1. On-Premise
8.2.2. Hybrid
8.2.3. Cloud
8.3. Middle East & Africa Digital Biomanufacturing Market Outlook, by Process Stage, Value (US$ Billion), 2020–2033
8.3.1. Process Development and Scale-Up
8.3.2. Upstream Manufacturing
8.3.3. Downstream Purification
8.3.4. Fill-Finish and Packaging
8.3.5. Quality Control and Batch Release
8.4. Middle East & Africa Digital Biomanufacturing Market Outlook, by End User, Value (US$ Billion), 2020–2033
8.4.1. Large Biopharmaceutical Manufacturers
8.4.2. Contract Development and Manufacturing Organizations
8.4.3. Emerging Biotechnology Companies
8.4.4. Academic and Research Institutes
8.5. Middle East & Africa Digital Biomanufacturing Market Outlook, by Country, Value (US$ Billion), 2020–2033
8.5.1. Saudi Arabia Digital Biomanufacturing Market Outlook, by Solution Type, 2020–2033
8.5.2. Saudi Arabia Digital Biomanufacturing Market Outlook, by Deployment Mode, 2020–2033
8.5.3. Saudi Arabia Digital Biomanufacturing Market Outlook, by Process Stage, 2020–2033
8.5.4. Saudi Arabia Digital Biomanufacturing Market Outlook, by End User, 2020–2033
8.5.5. United Arab Emirates Digital Biomanufacturing Market Outlook, by Solution Type, 2020–2033
8.5.6. United Arab Emirates Digital Biomanufacturing Market Outlook, by Deployment Mode, 2020–2033
8.5.7. United Arab Emirates Digital Biomanufacturing Market Outlook, by Process Stage, 2020–2033
8.5.8. United Arab Emirates Digital Biomanufacturing Market Outlook, by End User, 2020–2033
8.5.9. Egypt Digital Biomanufacturing Market Outlook, by Solution Type, 2020–2033
8.5.10. Egypt Digital Biomanufacturing Market Outlook, by Deployment Mode, 2020–2033
8.5.11. Egypt Digital Biomanufacturing Market Outlook, by Process Stage, 2020–2033
8.5.12. Egypt Digital Biomanufacturing Market Outlook, by End User, 2020–2033
8.5.13. South Africa Digital Biomanufacturing Market Outlook, by Solution Type, 2020–2033
8.5.14. South Africa Digital Biomanufacturing Market Outlook, by Deployment Mode, 2020–2033
8.5.15. South Africa Digital Biomanufacturing Market Outlook, by Process Stage, 2020–2033
8.5.16. South Africa Digital Biomanufacturing Market Outlook, by End User, 2020–2033
9. Competitive Landscape
9.1. Market Concentration and Industry Leaders
9.2. Competitive Differentiation
9.3. Strategic Moves and Market Direction
9.4. Recent Industry Developments
9.5. Company Profiles
9.5.1. Siemens AG
9.5.2. Rockwell Automation, Inc.
9.5.3. Emerson Electric Co.
9.5.4. Honeywell International Inc.
9.5.5. ABB Ltd
9.5.6. Sartorius AG
9.5.7. Cytiva
9.5.8. Thermo Fisher Scientific Inc.
9.5.9. Repligen Corporation
9.5.10. Körber AG
9.5.11. Dassault Systèmes SE
9.5.12. AVEVA Group Limited
9.5.13. Veeva Systems Inc.
10. Appendix
10.1. Research Methodology
10.2. Report Assumptions
10.3. Acronyms and Abbreviations
| Solution Type | Manufacturing Execution Systems and Electronic Batch Records, Process Control and Automation Systems, Process Analytical Technology and Soft Sensors, Digital Twins and Process Modeling, Data Historians and Contextualized Data Platforms, Laboratory Information Management Systems and Electronic Laboratory Notebooks, Quality Management and Deviation and CAPA Systems, Validation, Integration and Managed Services |
| Deployment Mode | On-Premise, Hybrid, Cloud |
| Process Stage | Process Development and Scale-Up, Upstream Manufacturing, Downstream Purification, Fill-Finish and Packaging, Quality Control and Batch Release |
| End User | Large Biopharmaceutical Manufacturers, Contract Development and Manufacturing Organizations, Emerging Biotechnology Companies, Academic and Research Institutes |
| Regions | North America, Europe, Asia Pacific, Latin America, Middle East & Africa |
Our Research Methodology
Considering the volatility of business today, traditional approaches to strategizing a game plan can be unfruitful if not detrimental. True ambiguity is no way to determine a forecast. A myriad of predetermined factors must be accounted for such as the degree of risk involved, the magnitude of circumstances, as well as conditions or consequences that are not known or unpredictable. To circumvent binary views that cast uncertainty, the application of market research intelligence to strategically posture, move, and enable actionable outcomes is necessary.
View Methodology
Quality Assured
Rigorous Validation Process

Confidentiality Assured
End-to-end Data Security

Custom Research Services
Tailored To Your Objectives
FAQs
The market is valued at US$ 4.3 billion in 2026, covering the software, data and automation layer used across regulated biologics manufacturing operations worldwide.
The market is projected to reach US$ 11.6 billion by 2033, growing at a 15.2% CAGR and adding US$ 7.3 billion in absolute opportunity.
Manufacturing Execution Systems and Electronic Batch Records lead with 26% share in 2026, because removing paper review delivers the clearest and fastest financial payback.
Digital Twins and Process Modeling grows fastest at a 20.4% CAGR, while Asia Pacific expands at a 19.3% CAGR on greenfield biologics capacity.
North America holds 42% share in 2026, and the market is moderately concentrated because validation and documentation requirements favour large, well-established suppliers.
Related Reports
Veterinary Telehealth Market Size, Share, Insights, Competitive Landscape, and Forecast 2026 to 2033
Veterinary telehealth market to grow from US$ 0.6 billion in 2026 to US$ 1.5 billion by 2033 at a 14.0% CAGR. Explore services, segments and regional insights.
Chemical Peel Market Size, Share, Insights, Competitive Landscape, and Forecast 2026 to 2033
The chemical peel market is projected to grow from US$2.4 billion in 2026 to US$4.3 billion by 2033, at an 8.7% CAGR. Explore segments and regional trends.
Smart Home Health Market Size, Share, Insights, Competitive Landscape, and Forecast 2026 to 2033
The smart home health market is projected to grow from US$5.80 billion in 2026 to US$9.90 billion by 2033, at a 7.9% CAGR, driven by aging and home monitoring.
Population Health Management Market Size, Share, Insights, Competitive Landscape, and Forecast 2026 to 2033
The population health management market is projected to grow from US$46.93 billion in 2026 to US$132.63 billion by 2033, at a 16.0% CAGR, led by value-based care.
Medical Second Opinion Market Size, Share, Insights, Competitive Landscape, and Forecast 2026 to 2033
The medical second opinion market is projected to grow from US$9.69 billion in 2026 to US$28.55 billion by 2033, at a 16.7% CAGR, led by virtual care.
Patient Blood Management Market Size, Share, Insights, Competitive Landscape, and Forecast 2026 to 2033
Explore the patient blood management market, reaching US$ 25.61 billion by 2033 at 6.4% CAGR, with product and regional insights.