



Drug Discovery Informatics Market
Drug Discovery Informatics Market Size, Share, Insights, Competitive Landscape, and Forecast 2026 to 2033
How Fast Is the Drug Discovery Informatics Market Growing?
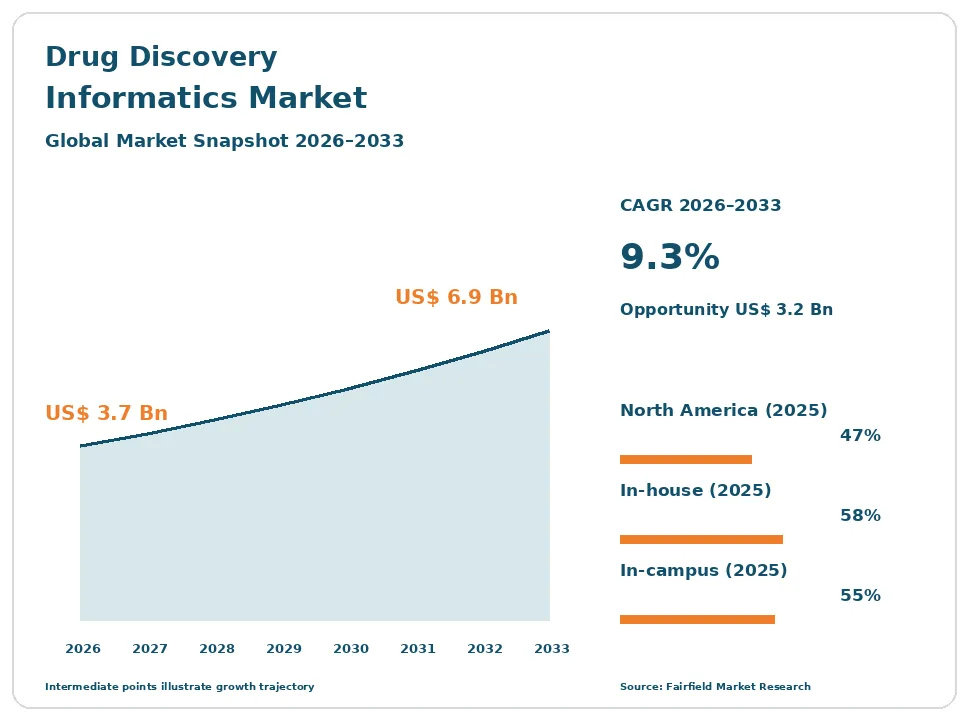
The global drug discovery informatics market size is expected to be valued at US$ 3.7 billion in 2026 and projected to reach US$ 6.9 billion by 2033, growing at a CAGR of 9.3% between 2026 and 2033.
Between 2020 and 2025, the market grew at a CAGR of about 10.2%, as pandemic vaccine and antiviral programs showed the value of computational design, cloud computing became standard in research labs, and investors poured money into AI-first biotech companies. The drug discovery informatics market covers software, platforms, databases, and services used to find, design, and test new drug candidates, including cheminformatics, bioinformatics, molecular modeling and docking, target identification, electronic lab notebooks, scientific data management, and predictive toxicology tools. These tools help scientists analyze genomic and chemical data, simulate how molecules bind to targets, and choose the best compounds to make and test. Growth comes from rising research spending, huge volumes of biological data, falling cloud computing costs, and fast progress in AI drug discovery. The market is shifting toward cloud platforms, generative chemistry, and federated learning. In January 2026, Schrödinger partnered with Eli Lilly to offer TuneLab models in its LiveDesign platform.
Key Report Takeaways
- By Service Type: In-house held about 58% share in 2025, while Outsourced is projected to expand at a 10.8% CAGR through 2033, driven by small and mid-sized biotechs that lack computing teams and turn to specialist providers for modeling and data analysis.
- By Modality: In-campus Platform held about 55% share in 2025, while Cloud-based Systems are projected to expand at a 11.5% CAGR through 2033, driven by scalable computing for physics-based simulation, AI models, and secure collaboration across partner organizations.
- By End User: Pharmaceutical Companies held about 46% share in 2025, while Contract Research Organizations are projected to expand at a 11.0% CAGR through 2033, driven by outsourcing of discovery chemistry, biology, and computational services by drug developers worldwide.
- By Region: North America held about 47% share in 2025, while Asia Pacific is projected to expand at a 11.6% CAGR through 2033, driven by fast-growing biotech sectors, large contract research organizations, and government funding in China, India, Japan, and South Korea.
Global Drug Discovery Informatics Market Trends and Insights
Drivers Impact Analysis
Two drivers carry the strongest influence on drug discovery informatics market demand during the forecast period.
AI Adoption Is Driving the Drug Discovery Informatics Market
AI and machine learning adoption in drug research is the strongest driver of the drug discovery informatics market. AI can cut years from discovery.
The mechanism is the high cost and failure rate of traditional drug discovery. Bringing a new drug to market can take more than 10 years and cost over US$ 2 billion, and most candidates fail. AI tools predict protein structures, design new molecules, forecast binding strength, and flag safety risks before compounds are made, helping teams test fewer compounds and focus on the best ones. AlphaFold made accurate protein structure prediction widely available, and generative models now propose novel chemistry. Large drug makers such as Eli Lilly, Bristol Myers Squibb, Sanofi, and AstraZeneca have signed major AI partnerships, and several AI-designed drugs have entered clinical trials. These trends push companies to invest in informatics platforms, data infrastructure, and computing power.
Research Spending Is Expanding the Drug Discovery Informatics Market
Rising research spending and data volumes are expanding the drug discovery informatics market. Labs produce more data than ever.
The cause is growing biopharma investment and new technologies. Global pharmaceutical research spending exceeds US$ 250 billion a year. Genomics, proteomics, high-throughput screening, and imaging generate huge datasets that need analysis and storage. Automated labs and robotic chemistry add data. Electronic lab notebooks replace paper, and scientific data management systems connect instruments, experiments, and results. New modalities such as antibodies, RNA therapies, cell therapies, and protein degraders need specialized design tools. Venture funding for AI biotech remained strong in 2025, and large pharma groups are increasing digital research budgets. Regulators are also accepting more model-informed drug development evidence. These trends support steady, long-term informatics demand across the industry.
| Driver | Impact on CAGR Forecast | Geographic Relevance | Impact Timeline |
| AI and machine learning adoption in drug research | High | North America, Europe, Asia Pacific | Long term (≥4 years) |
| Rising research spending and data volumes | Medium | Global | Medium term (2-4 years) |
Restraints Impact Analysis
Two restraints limit how quickly the drug discovery informatics market grows.
High Costs Slow the Drug Discovery Informatics Market
High costs and skills shortages slow the drug discovery informatics market. Advanced tools need experts and budgets.
The specific causes are expensive software licenses, computing costs, and a lack of trained computational chemists and data scientists. Physics-based simulations require large computing resources. Small biotechs face funding pressure, especially after the biotech downturn of 2022 and 2023. Experts who combine chemistry, biology, and computer science are scarce, and large pharma and technology firms hire many of them. Small companies may lack the data volumes needed to train strong AI models. Returns on informatics spending can be hard to measure because drug programs take many years. Some AI drug candidates have failed in trials, raising doubts among investors. These factors slow adoption, especially among smaller academic labs and research organizations.
Data Concerns Restrict the Drug Discovery Informatics Market
Data quality, integration, and intellectual property security concerns restrict the drug discovery informatics market. AI needs good data.
The underlying causes are fragmented, inconsistent research data and fears about sharing proprietary information. Many labs store data in different formats, spreadsheets, and legacy systems, making it hard to combine datasets for AI. Negative results are often not recorded, biasing models. Companies worry about leaks of proprietary chemical structures and trade secrets, and some hesitate to use cloud platforms. Data privacy laws limit sharing of patient-derived data, such as genomic and clinical records used for target discovery. Cleaning and standardizing data can take more time than building the models themselves, and many companies lack data engineers. Integration between instruments, notebooks, and modeling tools is often weak. These factors limit progress and slow the adoption of shared AI models across organizations.
| Restraint | Impact on CAGR Forecast | Geographic Relevance | Impact Timeline |
| High costs and skills shortages | High | Global | Long term (≥4 years) |
| Data quality, integration, and IP security concerns | Medium | Global | Medium term (2-4 years) |
Market Opportunities
Generative AI and Federated Learning Open a Fast-Growth Revenue Pool
Generative AI and federated learning open a fast-growth revenue pool in the drug discovery informatics market. New models design molecules faster.
Vendors can capture this opportunity. Generative chemistry tools propose novel compounds. Generative chemistry tools propose novel compounds with desired properties, and protein design models create new antibodies and enzymes. Federated learning lets companies train models together without sharing raw data, as shown by Lilly TuneLab. Large language models help scientists search literature and plan experiments. NVIDIA, Isomorphic Labs, and many startups are investing here, and computing costs for training models are falling. Pharma companies want tools that explain predictions and fit existing workflows. Subscription and usage-based pricing make advanced models accessible to small biotechs. Companies offering validated generative tools, secure collaboration, and strong data platforms can win.
Asia Pacific Biotech Growth Creates a Growth Revenue Pool
Asia Pacific biotech growth creates a growth revenue pool in the drug discovery informatics market. Regional research is expanding.
Vendors can capture this opportunity. China has a fast-growing biotech sector that licenses many drug candidates to Western companies, and WuXi AppTec and other CROs run huge discovery operations. India has large CROs such as Syngene and Aragen and a growing pool of computational scientists. Japan and South Korea fund AI drug discovery programs. Lower costs attract global sponsors, and governments in China and Singapore fund AI and biotech research centers. Western pharma companies are licensing more drug candidates discovered in China, increasing demand for advanced design tools there. Cloud regions in Japan, India, and Australia help meet data residency rules. Academic research is growing quickly across the region. Companies with local partners, data centers, and language support can grow quickly.
Segment Analysis
By Service Type: In-house Leads While Outsourced Grows Fastest
In-house held about 58% share in 2025. Large drug makers run their own informatics teams, computing clusters, and data platforms to protect intellectual property and integrate tools into their research workflows. They buy licenses from Schrödinger, BIOVIA, Certara, and Dotmatics and build proprietary AI models on internal data. In-house teams also manage data governance, security, and integration with lab systems, and many large companies combine internal tools with vendor software.
Outsourced is the fastest-growing service type, expanding at a 10.8% CAGR through 2033. Small and mid-sized biotechs often lack computing teams and outsource modeling, data analysis, and AI design to specialist providers and CROs. Pay-per-project models lower costs, and providers bring experienced computational chemists and biologists. Virtual biotechs with few staff rely almost entirely on outside partners. For the market, outsourcing growth broadens demand.
By Modality: In-campus Platform Leads While Cloud-based Systems Grow Fastest
In-campus Platform held about 55% share in 2025. Many companies keep data and computing on site to protect proprietary information and meet internal security rules. Large pharma groups have invested in high-performance computing clusters that run simulations and store decades of research data.
Cloud-based Systems are the fastest-growing modality, expanding at a 11.5% CAGR through 2033. Cloud computing scales easily for large simulations and AI training, lets teams collaborate across sites and partners, and avoids hardware costs. Software-as-a-service platforms such as Benchling and LiveDesign are popular with biotechs, and cloud providers offer GPU capacity for AI training. Hybrid setups that combine on-site data with cloud computing are common in large pharma. For the market, cloud growth adds subscriptions.
By End User: Pharmaceutical Companies Lead While Contract Research Organizations Grow Fastest
Pharmaceutical Companies held about 46% share in 2025. They spend the most on research and run large discovery programs across many disease areas, using informatics tools for target selection, compound design, and safety prediction. Big pharma AI partnerships drive much of the market’s growth.
Contract Research Organizations are the fastest-growing end user, expanding at a 11.0% CAGR through 2033. Drug developers increasingly outsource discovery chemistry, biology, and computational services to CROs, which invest in informatics to win contracts. Biotechnology companies form another fast-growing group, especially AI-first startups. CROs such as WuXi AppTec, Charles River Laboratories, Evotec, and Syngene are expanding computational chemistry and AI services to offer integrated design, make, test, and analyze cycles. For the market, CRO growth adds demand.
Geography Analysis
Which Region Is Leading the Drug Discovery Informatics Market?
North America is leading the drug discovery informatics market with about 47% share in 2025. The United States has the largest biopharma industry, the most venture-backed biotechs, and leading informatics vendors such as Schrödinger, Certara, Benchling, and Dotmatics. Research clusters in Boston, San Francisco, and San Diego drive demand, and NIH funding supports academic research. Canada adds AI research, with hubs in Toronto and Montreal. Large pharma companies such as Eli Lilly, Pfizer, Merck, and Bristol Myers Squibb have signed major AI deals with informatics vendors and startups. Key barriers include costs and skills shortages. One change shaping the region is AI partnerships.
Europe Shapes the Drug Discovery Informatics Market Through Research Hubs
Europe is a major drug discovery informatics market. The United Kingdom, Switzerland, and Germany host research hubs in Cambridge, Oxford, Basel, and Munich. AstraZeneca, GSK, Novartis, Roche, and Bayer run large AI and informatics programs, and Isomorphic Labs is based in London. Dassault Systèmes and Genedata are based in the region. The European Union AI Act adds rules for high-risk AI, and research programs such as the Innovative Health Initiative fund shared data projects. Switzerland and Denmark have strong biotech sectors. Key barriers include strict data rules and slower funding. One opportunity is AI research.
Which Region Is Growing Fastest in the Drug Discovery Informatics Market?
Asia Pacific is growing fastest in the drug discovery informatics market, expanding at a 11.6% CAGR through 2033. China, India, Japan, South Korea, Singapore, and Australia lead. China’s biotech sector is producing many new drug candidates, and AI drug discovery startups such as XtalPi are growing. Large CROs in China and India use informatics tools to serve global clients, and Japan’s pharma companies such as Takeda and Daiichi Sankyo invest in AI. South Korea funds national AI drug discovery programs. Key barriers include skills gaps and data rules. One change shaping the region is biotech growth.
Latin America Grows the Drug Discovery Informatics Market Through Academic Research
Latin America is a small drug discovery informatics market. Brazil and Mexico lead, with Argentina and Chile adding demand. Universities and research institutes such as Fiocruz in Brazil use computational tools for neglected tropical diseases and vaccines. Global pharma companies run clinical research in the region but little discovery. Cloud platforms make tools more affordable for universities and small biotechs, and free academic licenses help train researchers. Brazil has a growing biotech startup scene and strong research in natural products and tropical medicine. Mexico has expanding pharmaceutical manufacturing. Key barriers include limited funding and few large drug developers. One opportunity is academic partnerships.
Middle East & Africa Develops the Drug Discovery Informatics Market Through Research Investment
Middle East & Africa is a developing drug discovery informatics market. Israel and Saudi Arabia invest in research, with Israel hosting many AI and biotech startups. The United Arab Emirates and Qatar fund genomics and AI research programs, and Saudi Arabia is building biotech capacity under Vision 2030. South Africa has strong academic research in infectious disease. Research universities in Saudi Arabia, such as KAUST, use high-performance computing for molecular modeling. Government funds are attracting biotech companies to the region. Key barriers include a limited pharma industry and small research workforces. One change shaping the region is AI investment.
Competitive Landscape
The drug discovery informatics market is moderately fragmented. Schrödinger, Dassault Systèmes, through BIOVIA, Certara, Siemens, through Dotmatics, and Benchling are leading players, while Cresset Group, OpenEye Scientific, now part of Cadence, Genedata, Chemaxon, Optibrium, Insilico Medicine, and Recursion Pharmaceuticals compete strongly. Cloud providers such as Amazon Web Services, Microsoft, and Google, along with NVIDIA and its BioNeMo platform, supply computing and AI models, while many startups offer specialized tools for protein design, toxicity prediction, and lab data management.
Companies compete on scientific accuracy, speed, ease of use, data integration, security, scalability, and price. Physics-based simulation leaders such as Schrödinger combine software sales with their own drug programs, while lab informatics platforms such as Benchling and Dotmatics focus on capturing and organizing experimental data. AI-first companies such as Insilico Medicine and Recursion use their platforms to build drug pipelines and partner with large pharma.
Strategic moves show how competition is changing. In November 2024, Recursion completed its merger with Exscientia. In July 2025, Siemens completed its roughly US$ 5.1 billion acquisition of Dotmatics, entering scientific software. In January 2026, Schrödinger partnered with Eli Lilly to offer TuneLab models in LiveDesign. Cadence had earlier bought OpenEye Scientific. These moves show competition shifting toward large platform owners and AI partnerships.
Three themes shape vendor strategy. First, companies are adding generative AI and machine learning to modeling tools. Second, they are moving platforms to the cloud and connecting lab, design, and analysis data. Third, they are expanding in Asia Pacific, especially China, India, and Japan, through partnerships with local biotechs and CROs.
Drug Discovery Informatics Market Industry Leaders
- Schrödinger
- Dassault Systèmes (BIOVIA)
- Certara
- Siemens (Dotmatics)
- Benchling
Recent Industry Developments
- January 2026: Schrödinger partnered with Eli Lilly to make Lilly TuneLab AI models available inside its LiveDesign enterprise informatics platform, using federated learning to keep partner data private - expands AI drug discovery access for biotechs.
- July 2025: Siemens completed its acquisition of Dotmatics, a scientific research and data management software provider, for about US$ 5.1 billion - brings industrial software scale to the drug discovery informatics market.
- November 2024: Recursion Pharmaceuticals completed its merger with Exscientia - creates a larger AI-driven drug discovery platform combining biology and cheminformatics capabilities.
Companies Covered in the Report
- Schrödinger
- Dassault Systèmes (BIOVIA)
- Certara
- Siemens (Dotmatics)
- Benchling
- Cresset Group
- OpenEye Scientific (Cadence)
- Genedata
- Chemaxon
- Optibrium
- Insilico Medicine
- Recursion Pharmaceuticals
Drug Discovery Informatics Market Scope
This report covers the drug discovery informatics market, including in-house and outsourced services, cloud-based systems and in-campus platforms, used for data sequencing, molecular docking, identification and validation informatics, target data analysis, and other applications, by pharmaceutical companies, contract research organizations, biotechnology companies, and other end users. The base year is 2025, and the forecast period runs from 2026 to 2033. All values are expressed in US$ Billion.
Service Type
- In-house
- Outsourced
Modality
- Cloud-based Systems
- In-campus Platform
Application
- Data Sequencing
- Molecular Docking
- Identification and Validation Informatics
- Target Data Analysis
- Others
End User
- Pharmaceutical Companies
- Contract Research Organizations
- Biotechnology Companies
- Others
Regions
- North America
- Europe
- Asia Pacific
- Latin America
- Middle East & Africa
1. Executive Summary
1.1. Global Drug Discovery Informatics Market Snapshot
1.2. Future Projections, 2026-2033
1.3. Key Market Trends
1.4. Regional Snapshot
2. Market Overview
2.1. Market Definition and Report Scope
2.2. Historical Market Trends, 2020-2025
2.3. Market Dynamics
2.3.1. Drivers Impact Analysis
2.3.1.1. AI Adoption Is Driving the Drug Discovery Informatics Market
2.3.1.2. Research Spending Is Expanding the Drug Discovery Informatics Market
2.3.2. Restraints Impact Analysis
2.3.2.1. High Costs Slow the Drug Discovery Informatics Market
2.3.2.2. Data Concerns Restrict the Drug Discovery Informatics Market
2.3.3. Market Opportunities
2.3.3.1. Generative AI and Federated Learning Open a Fast-Growth Revenue Pool
2.3.3.2. Asia Pacific Biotech Growth Creates a Growth Revenue Pool
3. Global Drug Discovery Informatics Market Outlook, 2020-2033
3.1. Global Drug Discovery Informatics Market Outlook, by Service Type, Value (US$ Billion), 2020-2033
3.1.1. In-house
3.1.2. Outsourced
3.2. Global Drug Discovery Informatics Market Outlook, by Modality, Value (US$ Billion), 2020-2033
3.2.1. Cloud-based Systems
3.2.2. In-campus Platform
3.3. Global Drug Discovery Informatics Market Outlook, by Application, Value (US$ Billion), 2020-2033
3.3.1. Data Sequencing
3.3.2. Molecular Docking
3.3.3. Identification and Validation Informatics
3.3.4. Target Data Analysis
3.3.5. Others
3.4. Global Drug Discovery Informatics Market Outlook, by End User, Value (US$ Billion), 2020-2033
3.4.1. Pharmaceutical Companies
3.4.2. Contract Research Organizations
3.4.3. Biotechnology Companies
3.4.4. Others
3.5. Global Drug Discovery Informatics Market Outlook, by Region, Value (US$ Billion), 2020-2033
3.5.1. North America
3.5.2. Europe
3.5.3. Asia Pacific
3.5.4. Latin America
3.5.5. Middle East & Africa
4. North America Drug Discovery Informatics Market Outlook, 2020-2033
4.1. North America Drug Discovery Informatics Market Outlook, by Service Type, Value (US$ Billion), 2020-2033
4.1.1. In-house
4.1.2. Outsourced
4.2. North America Drug Discovery Informatics Market Outlook, by Modality, Value (US$ Billion), 2020-2033
4.2.1. Cloud-based Systems
4.2.2. In-campus Platform
4.3. North America Drug Discovery Informatics Market Outlook, by Application, Value (US$ Billion), 2020-2033
4.3.1. Data Sequencing
4.3.2. Molecular Docking
4.3.3. Identification and Validation Informatics
4.3.4. Target Data Analysis
4.3.5. Others
4.4. North America Drug Discovery Informatics Market Outlook, by End User, Value (US$ Billion), 2020-2033
4.4.1. Pharmaceutical Companies
4.4.2. Contract Research Organizations
4.4.3. Biotechnology Companies
4.4.4. Others
4.5. North America Drug Discovery Informatics Market Outlook, by Country, Value (US$ Billion), 2020-2033
4.5.1. United States Drug Discovery Informatics Market Outlook, by Service Type, 2020-2033
4.5.2. United States Drug Discovery Informatics Market Outlook, by Modality, 2020-2033
4.5.3. United States Drug Discovery Informatics Market Outlook, by Application, 2020-2033
4.5.4. United States Drug Discovery Informatics Market Outlook, by End User, 2020-2033
4.5.5. Canada Drug Discovery Informatics Market Outlook, by Service Type, 2020-2033
4.5.6. Canada Drug Discovery Informatics Market Outlook, by Modality, 2020-2033
4.5.7. Canada Drug Discovery Informatics Market Outlook, by Application, 2020-2033
4.5.8. Canada Drug Discovery Informatics Market Outlook, by End User, 2020-2033
5. Europe Drug Discovery Informatics Market Outlook, 2020-2033
5.1. Europe Drug Discovery Informatics Market Outlook, by Service Type, Value (US$ Billion), 2020-2033
5.1.1. In-house
5.1.2. Outsourced
5.2. Europe Drug Discovery Informatics Market Outlook, by Modality, Value (US$ Billion), 2020-2033
5.2.1. Cloud-based Systems
5.2.2. In-campus Platform
5.3. Europe Drug Discovery Informatics Market Outlook, by Application, Value (US$ Billion), 2020-2033
5.3.1. Data Sequencing
5.3.2. Molecular Docking
5.3.3. Identification and Validation Informatics
5.3.4. Target Data Analysis
5.3.5. Others
5.4. Europe Drug Discovery Informatics Market Outlook, by End User, Value (US$ Billion), 2020-2033
5.4.1. Pharmaceutical Companies
5.4.2. Contract Research Organizations
5.4.3. Biotechnology Companies
5.4.4. Others
5.5. Europe Drug Discovery Informatics Market Outlook, by Country, Value (US$ Billion), 2020-2033
5.5.1. United Kingdom Drug Discovery Informatics Market Outlook, by Service Type, 2020-2033
5.5.2. United Kingdom Drug Discovery Informatics Market Outlook, by Modality, 2020-2033
5.5.3. United Kingdom Drug Discovery Informatics Market Outlook, by Application, 2020-2033
5.5.4. United Kingdom Drug Discovery Informatics Market Outlook, by End User, 2020-2033
5.5.5. Switzerland Drug Discovery Informatics Market Outlook, by Service Type, 2020-2033
5.5.6. Switzerland Drug Discovery Informatics Market Outlook, by Modality, 2020-2033
5.5.7. Switzerland Drug Discovery Informatics Market Outlook, by Application, 2020-2033
5.5.8. Switzerland Drug Discovery Informatics Market Outlook, by End User, 2020-2033
5.5.9. Germany Drug Discovery Informatics Market Outlook, by Service Type, 2020-2033
5.5.10. Germany Drug Discovery Informatics Market Outlook, by Modality, 2020-2033
5.5.11. Germany Drug Discovery Informatics Market Outlook, by Application, 2020-2033
5.5.12. Germany Drug Discovery Informatics Market Outlook, by End User, 2020-2033
5.5.13. Denmark Drug Discovery Informatics Market Outlook, by Service Type, 2020-2033
5.5.14. Denmark Drug Discovery Informatics Market Outlook, by Modality, 2020-2033
5.5.15. Denmark Drug Discovery Informatics Market Outlook, by Application, 2020-2033
5.5.16. Denmark Drug Discovery Informatics Market Outlook, by End User, 2020-2033
6. Asia Pacific Drug Discovery Informatics Market Outlook, 2020-2033
6.1. Asia Pacific Drug Discovery Informatics Market Outlook, by Service Type, Value (US$ Billion), 2020-2033
6.1.1. In-house
6.1.2. Outsourced
6.2. Asia Pacific Drug Discovery Informatics Market Outlook, by Modality, Value (US$ Billion), 2020-2033
6.2.1. Cloud-based Systems
6.2.2. In-campus Platform
6.3. Asia Pacific Drug Discovery Informatics Market Outlook, by Application, Value (US$ Billion), 2020-2033
6.3.1. Data Sequencing
6.3.2. Molecular Docking
6.3.3. Identification and Validation Informatics
6.3.4. Target Data Analysis
6.3.5. Others
6.4. Asia Pacific Drug Discovery Informatics Market Outlook, by End User, Value (US$ Billion), 2020-2033
6.4.1. Pharmaceutical Companies
6.4.2. Contract Research Organizations
6.4.3. Biotechnology Companies
6.4.4. Others
6.5. Asia Pacific Drug Discovery Informatics Market Outlook, by Country, Value (US$ Billion), 2020-2033
6.5.1. China Drug Discovery Informatics Market Outlook, by Service Type, 2020-2033
6.5.2. China Drug Discovery Informatics Market Outlook, by Modality, 2020-2033
6.5.3. China Drug Discovery Informatics Market Outlook, by Application, 2020-2033
6.5.4. China Drug Discovery Informatics Market Outlook, by End User, 2020-2033
6.5.5. India Drug Discovery Informatics Market Outlook, by Service Type, 2020-2033
6.5.6. India Drug Discovery Informatics Market Outlook, by Modality, 2020-2033
6.5.7. India Drug Discovery Informatics Market Outlook, by Application, 2020-2033
6.5.8. India Drug Discovery Informatics Market Outlook, by End User, 2020-2033
6.5.9. Japan Drug Discovery Informatics Market Outlook, by Service Type, 2020-2033
6.5.10. Japan Drug Discovery Informatics Market Outlook, by Modality, 2020-2033
6.5.11. Japan Drug Discovery Informatics Market Outlook, by Application, 2020-2033
6.5.12. Japan Drug Discovery Informatics Market Outlook, by End User, 2020-2033
6.5.13. South Korea Drug Discovery Informatics Market Outlook, by Service Type, 2020-2033
6.5.14. South Korea Drug Discovery Informatics Market Outlook, by Modality, 2020-2033
6.5.15. South Korea Drug Discovery Informatics Market Outlook, by Application, 2020-2033
6.5.16. South Korea Drug Discovery Informatics Market Outlook, by End User, 2020-2033
6.5.17. Singapore Drug Discovery Informatics Market Outlook, by Service Type, 2020-2033
6.5.18. Singapore Drug Discovery Informatics Market Outlook, by Modality, 2020-2033
6.5.19. Singapore Drug Discovery Informatics Market Outlook, by Application, 2020-2033
6.5.20. Singapore Drug Discovery Informatics Market Outlook, by End User, 2020-2033
6.5.21. Australia Drug Discovery Informatics Market Outlook, by Service Type, 2020-2033
6.5.22. Australia Drug Discovery Informatics Market Outlook, by Modality, 2020-2033
6.5.23. Australia Drug Discovery Informatics Market Outlook, by Application, 2020-2033
6.5.24. Australia Drug Discovery Informatics Market Outlook, by End User, 2020-2033
7. Latin America Drug Discovery Informatics Market Outlook, 2020-2033
7.1. Latin America Drug Discovery Informatics Market Outlook, by Service Type, Value (US$ Billion), 2020-2033
7.1.1. In-house
7.1.2. Outsourced
7.2. Latin America Drug Discovery Informatics Market Outlook, by Modality, Value (US$ Billion), 2020-2033
7.2.1. Cloud-based Systems
7.2.2. In-campus Platform
7.3. Latin America Drug Discovery Informatics Market Outlook, by Application, Value (US$ Billion), 2020-2033
7.3.1. Data Sequencing
7.3.2. Molecular Docking
7.3.3. Identification and Validation Informatics
7.3.4. Target Data Analysis
7.3.5. Others
7.4. Latin America Drug Discovery Informatics Market Outlook, by End User, Value (US$ Billion), 2020-2033
7.4.1. Pharmaceutical Companies
7.4.2. Contract Research Organizations
7.4.3. Biotechnology Companies
7.4.4. Others
7.5. Latin America Drug Discovery Informatics Market Outlook, by Country, Value (US$ Billion), 2020-2033
7.5.1. Brazil Drug Discovery Informatics Market Outlook, by Service Type, 2020-2033
7.5.2. Brazil Drug Discovery Informatics Market Outlook, by Modality, 2020-2033
7.5.3. Brazil Drug Discovery Informatics Market Outlook, by Application, 2020-2033
7.5.4. Brazil Drug Discovery Informatics Market Outlook, by End User, 2020-2033
7.5.5. Mexico Drug Discovery Informatics Market Outlook, by Service Type, 2020-2033
7.5.6. Mexico Drug Discovery Informatics Market Outlook, by Modality, 2020-2033
7.5.7. Mexico Drug Discovery Informatics Market Outlook, by Application, 2020-2033
7.5.8. Mexico Drug Discovery Informatics Market Outlook, by End User, 2020-2033
7.5.9. Argentina Drug Discovery Informatics Market Outlook, by Service Type, 2020-2033
7.5.10. Argentina Drug Discovery Informatics Market Outlook, by Modality, 2020-2033
7.5.11. Argentina Drug Discovery Informatics Market Outlook, by Application, 2020-2033
7.5.12. Argentina Drug Discovery Informatics Market Outlook, by End User, 2020-2033
7.5.13. Chile Drug Discovery Informatics Market Outlook, by Service Type, 2020-2033
7.5.14. Chile Drug Discovery Informatics Market Outlook, by Modality, 2020-2033
7.5.15. Chile Drug Discovery Informatics Market Outlook, by Application, 2020-2033
7.5.16. Chile Drug Discovery Informatics Market Outlook, by End User, 2020-2033
8. Middle East & Africa Drug Discovery Informatics Market Outlook, 2020-2033
8.1. Middle East & Africa Drug Discovery Informatics Market Outlook, by Service Type, Value (US$ Billion), 2020-2033
8.1.1. In-house
8.1.2. Outsourced
8.2. Middle East & Africa Drug Discovery Informatics Market Outlook, by Modality, Value (US$ Billion), 2020-2033
8.2.1. Cloud-based Systems
8.2.2. In-campus Platform
8.3. Middle East & Africa Drug Discovery Informatics Market Outlook, by Application, Value (US$ Billion), 2020-2033
8.3.1. Data Sequencing
8.3.2. Molecular Docking
8.3.3. Identification and Validation Informatics
8.3.4. Target Data Analysis
8.3.5. Others
8.4. Middle East & Africa Drug Discovery Informatics Market Outlook, by End User, Value (US$ Billion), 2020-2033
8.4.1. Pharmaceutical Companies
8.4.2. Contract Research Organizations
8.4.3. Biotechnology Companies
8.4.4. Others
8.5. Middle East & Africa Drug Discovery Informatics Market Outlook, by Country, Value (US$ Billion), 2020-2033
8.5.1. Israel Drug Discovery Informatics Market Outlook, by Service Type, 2020-2033
8.5.2. Israel Drug Discovery Informatics Market Outlook, by Modality, 2020-2033
8.5.3. Israel Drug Discovery Informatics Market Outlook, by Application, 2020-2033
8.5.4. Israel Drug Discovery Informatics Market Outlook, by End User, 2020-2033
8.5.5. Saudi Arabia Drug Discovery Informatics Market Outlook, by Service Type, 2020-2033
8.5.6. Saudi Arabia Drug Discovery Informatics Market Outlook, by Modality, 2020-2033
8.5.7. Saudi Arabia Drug Discovery Informatics Market Outlook, by Application, 2020-2033
8.5.8. Saudi Arabia Drug Discovery Informatics Market Outlook, by End User, 2020-2033
8.5.9. United Arab Emirates Drug Discovery Informatics Market Outlook, by Service Type, 2020-2033
8.5.10. United Arab Emirates Drug Discovery Informatics Market Outlook, by Modality, 2020-2033
8.5.11. United Arab Emirates Drug Discovery Informatics Market Outlook, by Application, 2020-2033
8.5.12. United Arab Emirates Drug Discovery Informatics Market Outlook, by End User, 2020-2033
8.5.13. Qatar Drug Discovery Informatics Market Outlook, by Service Type, 2020-2033
8.5.14. Qatar Drug Discovery Informatics Market Outlook, by Modality, 2020-2033
8.5.15. Qatar Drug Discovery Informatics Market Outlook, by Application, 2020-2033
8.5.16. Qatar Drug Discovery Informatics Market Outlook, by End User, 2020-2033
8.5.17. South Africa Drug Discovery Informatics Market Outlook, by Service Type, 2020-2033
8.5.18. South Africa Drug Discovery Informatics Market Outlook, by Modality, 2020-2033
8.5.19. South Africa Drug Discovery Informatics Market Outlook, by Application, 2020-2033
8.5.20. South Africa Drug Discovery Informatics Market Outlook, by End User, 2020-2033
9. Competitive Landscape
9.1. Market Concentration and Industry Leaders
9.2. Competitive Differentiation
9.3. Strategic Initiatives
9.4. Recent Industry Developments
9.5. Company Profiles
9.5.1. Schrödinger
9.5.2. Dassault Systèmes (BIOVIA)
9.5.3. Certara
9.5.4. Siemens (Dotmatics)
9.5.5. Benchling
9.5.6. Cresset Group
9.5.7. OpenEye Scientific (Cadence)
9.5.8. Genedata
9.5.9. Chemaxon
9.5.10. Optibrium
9.5.11. Insilico Medicine
9.5.12. Recursion Pharmaceuticals
10. Appendix
10.1. Research Methodology
10.2. Report Assumptions
10.3. Acronyms and Abbreviations
| Service Type | In-house, Outsourced |
| Modality | Cloud-based Systems, In-campus Platform |
| Application | Data Sequencing, Molecular Docking, Identification and Validation Informatics, Target Data Analysis, Others |
| End User | Pharmaceutical Companies, Contract Research Organizations, Biotechnology Companies, Others |
| Regions | North America, Europe, Asia Pacific, Latin America, Middle East & Africa |
Our Research Methodology
Considering the volatility of business today, traditional approaches to strategizing a game plan can be unfruitful if not detrimental. True ambiguity is no way to determine a forecast. A myriad of predetermined factors must be accounted for such as the degree of risk involved, the magnitude of circumstances, as well as conditions or consequences that are not known or unpredictable. To circumvent binary views that cast uncertainty, the application of market research intelligence to strategically posture, move, and enable actionable outcomes is necessary.
View Methodology
Quality Assured
Rigorous Validation Process

Confidentiality Assured
End-to-end Data Security

Custom Research Services
Tailored To Your Objectives
FAQs
The drug discovery informatics market is valued at US$ 3.7 billion in 2026, led by in-house platforms and North America.
The market is projected to reach US$ 6.9 billion by 2033, growing at a 9.3% CAGR and adding US$ 3.2 billion.
Cloud-based systems are growing fastest at an 11.5% CAGR through 2033, driven by scalable computing for simulation and AI models.
Asia Pacific is growing fastest at an 11.6% CAGR through 2033, driven by biotech growth, large CROs, and government research funding.
North America holds the largest share at about 47% in 2025, supported by the largest biopharma industry and AI drug discovery investment.
Related Reports
Medical Device Security Market Size, Share, Insights, Competitive Landscape, and Forecast 2026 to 2033
The global medical device security market is valued at US$6.8 billion in 2026, reaching US$12.0 billion by 2033, growing at an 8.4% CAGR
Healthcare IT Integration Market Size, Share, Insights, Competitive Landscape, and Forecast 2026 to 2033
The global healthcare IT integration market is valued at US$4.9 billion in 2026, reaching US$10.6 billion by 2033, growing at an 11.7% CAGR
Veterinary Telehealth Market Size, Share, Insights, Competitive Landscape, and Forecast 2026 to 2033
Veterinary telehealth market to grow from US$ 0.6 billion in 2026 to US$ 1.5 billion by 2033 at a 14.0% CAGR. Explore services, segments and regional insights.
Chemical Peel Market Size, Share, Insights, Competitive Landscape, and Forecast 2026 to 2033
The chemical peel market is projected to grow from US$2.4 billion in 2026 to US$4.3 billion by 2033, at an 8.7% CAGR. Explore segments and regional trends.
Smart Home Health Market Size, Share, Insights, Competitive Landscape, and Forecast 2026 to 2033
The smart home health market is projected to grow from US$5.80 billion in 2026 to US$9.90 billion by 2033, at a 7.9% CAGR, driven by aging and home monitoring.
Population Health Management Market Size, Share, Insights, Competitive Landscape, and Forecast 2026 to 2033
The population health management market is projected to grow from US$46.93 billion in 2026 to US$132.63 billion by 2033, at a 16.0% CAGR, led by value-based care.