



Food Preservatives Market
Food Preservatives Market Size, Share, Insights, Competitive Landscape, and Forecast 2026 to 2033
How Fast Is the Food Preservatives Market Growing?
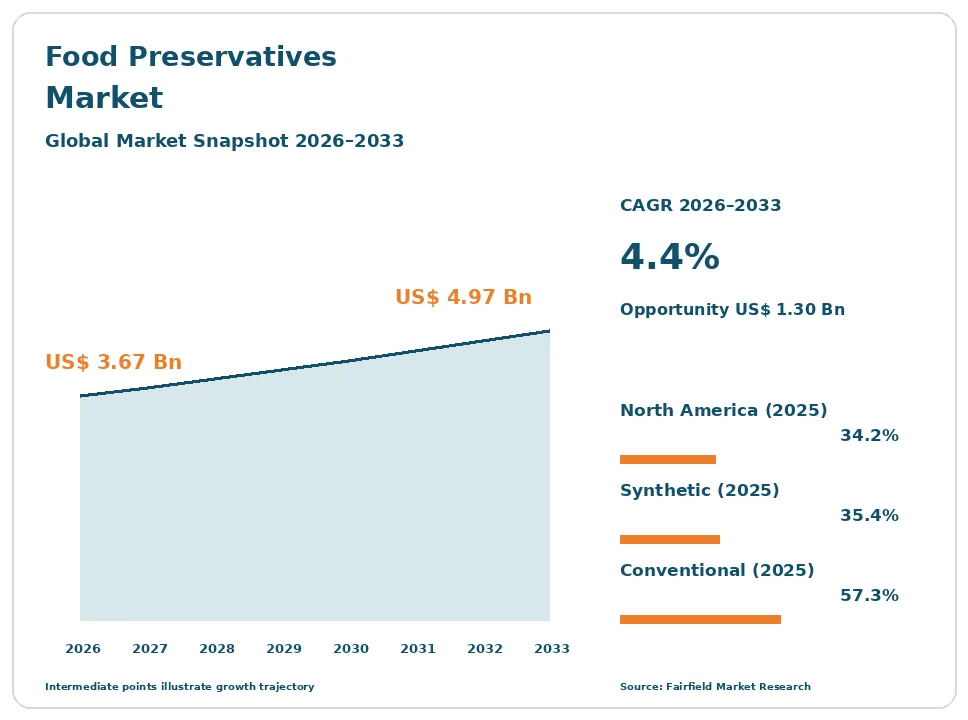
The global food preservatives market size is expected to be valued at US$ 3.67 billion in 2026 and projected to reach US$ 4.97 billion by 2033, growing at a CAGR of 4.4% between 2026 and 2033.
Between 2020 and 2025, the market grew at a CAGR of about 3.8%, as pandemic stockpiling lifted demand for packaged and shelf-stable foods, and food makers then reformulated products to meet clean label expectations. The food preservatives market covers synthetic and natural ingredients that slow spoilage caused by bacteria, yeasts, molds, and oxidation, including sorbates, benzoates, propionates, nitrites, sulfites, antioxidants such as tocopherols and rosemary extract, organic acids, vinegar, cultured dextrose, natamycin, and nisin. These ingredients protect food safety, extend shelf life, and cut food waste across meat, bakery, dairy, beverages, snacks, sauces, and prepared meals. Growth comes from rising processed and convenience food consumption, longer supply chains, and food waste reduction goals. The market is shifting toward natural food preservatives and fermentation-based solutions. In April 2025, Corbion launched a cultured wheat mold inhibitor for bakers.
Key Report Takeaways
- By Type: Synthetic held 35.4% share in 2025, while Natural is projected to expand at a 5.8% CAGR through 2033, driven by consumer demand for recognizable ingredients and food makers replacing sorbates and benzoates with fermentates, vinegar, and plant extracts.
- By Application: Meat and Poultry held 29.4% share in 2025, while Beverages is projected to expand at a 5.1% CAGR through 2033, driven by growth in functional drinks, low-sugar beverages, and juices that need protection from yeasts and molds.
- By Label: Conventional held 57.3% share in 2025, while Clean Label is projected to expand at a 5.6% CAGR through 2033, driven by retailer ingredient policies, shopper preferences, and brand reformulation commitments across bakery, dairy, and snacks.
- By Region: North America held 34.2% share in 2025, while Europe is projected to expand at a 5.3% CAGR through 2033, driven by strict additive rules, strong clean label demand, and food waste reduction policies across the region.
Global Food Preservatives Market Trends and Insights
Drivers Impact Analysis
| Driver | Impact on CAGR Forecast | Geographic Relevance | Impact Timeline |
| Rising processed and convenience food consumption | High | Global, strongest in Asia Pacific and Latin America | Long term (≥4 years) |
| Food waste reduction and longer supply chains | Medium | North America, Europe | Medium term (2-4 years) |
Two drivers carry the strongest influence on food preservatives market demand during the forecast period.
Processed Food Consumption Is Driving the Food Preservatives Market
Rising processed and convenience food consumption is the strongest driver of the food preservatives market. Packaged food needs a longer shelf life.
The mechanism is changing lifestyles. Urbanization, smaller households, more women in the workforce, and busy schedules are pushing consumers toward ready meals, packaged bread, snacks, sauces, processed meats, and bottled drinks. In China, India, Indonesia, Brazil, and Mexico, rising incomes and modern retail are expanding packaged food sales quickly. Online grocery and quick commerce add longer handling times. Each of these products must stay safe and fresh from the factory through distribution, store shelves, and home storage. Preservatives prevent mold, bacterial growth, and rancidity, so demand rises with packaged food volume. Food makers also launch more products with lower sugar and salt, which can reduce natural preservation and require added protection, supporting steady growth.
Food Waste Reduction Is Expanding the Food Preservatives Market
Food waste reduction goals and longer supply chains are expanding the food preservatives market. Longer shelf life means less waste.
The cause is pressure from governments, retailers, and investors to cut food loss. About one third of food produced is lost or wasted, and the United Nations has set a goal to halve retail and consumer food waste by 2030. Retailers such as Tesco and Walmart track waste reduction targets. Global sourcing means ingredients and finished foods travel further. Extending shelf life by a few days can cut waste significantly, since bread, dairy, and fresh meat are among the most wasted foods. Supermarkets also want fewer markdowns and less shrink on short-dated products, so they ask suppliers for longer code dates. Preservatives, including natural antimicrobials and antioxidants, help brands and retailers meet these goals while protecting margins and supporting demand.
Restraints Impact Analysis
| Restraint | Impact on CAGR Forecast | Geographic Relevance | Impact Timeline |
| Consumer concerns about synthetic additives | High | North America, Europe | Long term (≥4 years) |
| Strict regulation and costly approvals | Medium | Global | Medium term (2-4 years) |
Two restraints limit how quickly the food preservatives market grows.
Consumer Concerns Slow the Food Preservatives Market
Consumer concerns about synthetic additives slow the food preservatives market. Many shoppers avoid unfamiliar names on labels.
The specific causes are health worries and media coverage. Some studies have linked nitrites in processed meats to cancer risk, and sulfites and benzoates to allergic reactions or other effects, raising concern. Clean label trends lead brands to remove artificial preservatives, sometimes shortening shelf life rather than replacing them. Natural alternatives often cost more per unit of protection and can affect taste or color. In the United States, state bills and federal reviews target certain additives, adding uncertainty for food makers. Social media campaigns and ingredient scanning apps amplify these concerns among younger shoppers. Some brands now advertise “no preservatives” on packs. These factors reduce volumes of some synthetic preservatives and pressure prices, slowing value growth in mature markets.
Strict Regulation Restricts the Food Preservatives Market
Strict regulation and costly approvals restrict the food preservatives market. New ingredients take years to approve.
The underlying causes are complex safety rules that differ by country. The European Food Safety Authority, the U.S. Food and Drug Administration, and other agencies set limits on which preservatives can be used, in which foods, and at what levels. Re-evaluations can tighten limits or remove approvals. New natural preservatives need safety data, which is expensive. Labeling rules on “no preservatives” claims vary. Approval for a new food additive in Europe can take several years and cost millions of dollars, and approvals in one country do not carry over to others. Small innovators often lack the resources to complete dossiers in many markets at once. Natural ingredients sold as food rather than additives face their own labeling questions. These hurdles slow innovation, raise costs, and delay market entry.
Market Opportunities
Fermentation-Based Natural Preservatives Open a Fast-Growth Revenue Pool
Fermentation-based natural preservatives open a fast-growth revenue pool in the food preservatives market. Cultured ingredients meet clean label needs.
Ingredient suppliers can capture this opportunity. Cultured dextrose, cultured wheat, cultured sugar, and vinegar-based ingredients are produced by fermentation and can be labeled with simple names, while providing antimicrobial protection. Corbion, Kerry Group, dsm-firmenich, and IFF are expanding fermentation-based portfolios for bakery, meat, dairy, and ready meals. Bacteriophages, protective cultures, and bacteriocins such as nisin offer targeted protection. Companies that combine fermentation expertise, application labs, and predictive shelf-life models can win premium clean label preservatives business. Fermentation capacity in Europe and North America is expanding, and precision fermentation may lower costs further. Partnerships with large bakery and meat processors help suppliers scale new solutions quickly.
Plant Extract Antioxidants Create a Growth Revenue Pool
Plant extract antioxidants create a growth revenue pool in the food preservatives market. Natural extracts protect color and flavor.
Suppliers can capture this opportunity. Rosemary, green tea, acerola, and tocopherol extracts slow oxidation in meats, oils, snacks, and pet food, replacing synthetic antioxidants such as BHA and BHT. Kemin Industries and Kalsec lead in plant extract antioxidants, supplying meat, snack, and oil producers worldwide. Growth in plant-based meat, fortified oils, nutrition bars, and functional foods adds demand, because unsaturated fats and added omega-3s oxidize quickly. Pet food makers are also switching to natural antioxidants to meet owner expectations. Extract suppliers are improving flavor neutrality and standardizing active compounds. Demand for natural antioxidants is rising in Europe and North America. Companies offering blends that combine antioxidants and antimicrobials can grow faster than the market.
Segment Analysis
By Type: Synthetic Leads While Natural Grows Fastest
Synthetic held 35.4% share in 2025. Sorbates, benzoates, propionates, nitrites, and sulfites remain widely used because they are cheap, effective at low doses, and well understood by food makers. They are common in bakery, beverages, processed meats, and sauces, especially in price-sensitive markets.
Natural is the fastest-growing type, expanding at a 5.8% CAGR through 2033. Fermentates, vinegar, natamycin, nisin, rosemary extract, and organic acids from natural sources are replacing synthetics in many products. Prices of natural options are falling as production scales, and new blends are closing the efficacy gap with synthetics. Large brands are making public commitments to remove artificial ingredients. For the market, the natural shift raises value per kilogram and rewards innovative suppliers.
By Application: Meat and Poultry Lead While Beverages Grow Fastest
Meat and Poultry held 29.4% share in 2025. Processed meats such as ham, bacon, sausages, and deli meats are highly perishable and need protection from Listeria, Clostridium, and other pathogens. Nitrites, lactates, acetates, and vinegar-based ingredients are widely used, and clean label cured meats increasingly use celery powder.
Beverages are the fastest-growing application, expanding at a 5.1% CAGR through 2033. Juices, flavored waters, functional drinks, and low-sugar soft drinks need protection from yeasts and molds, and sugar reduction makes drinks more vulnerable to spoilage. Bakery, dairy, snacks, and sauces form other applications, with bakery a major user of propionates and mold inhibitors. For the market, beverage growth supports demand for sorbates, benzoates, and natural alternatives.
By Label: Conventional Leads While Clean Label Grows Fastest
Conventional held 57.3% share in 2025. Most processed foods still use conventional preservatives, especially in mass-market and private label products where cost matters most. Conventional preservatives offer proven performance, broad approvals, and low cost per unit of protection, and many food makers in Asia Pacific, Latin America, and Middle East & Africa continue to rely on them for staple products such as bread, sauces, and soft drinks.
Clean Label is the fastest-growing label type, expanding at a 5.6% CAGR through 2033. Retailers, brands, and food service chains are removing artificial ingredients and replacing them with ingredients consumers recognize. Clean label solutions such as cultured dextrose, vinegar, and rosemary extract are now common in premium bread, deli meats, and dips. For the market, clean label growth shifts spending toward higher-value natural solutions and application support.
Geography Analysis
Which Region Is Leading the Food Preservatives Market?
North America is leading the food preservatives market with a 34.2% share in 2025. The United States has one of the world’s largest processed food industries, with high consumption of packaged bread, processed meats, snacks, beverages, and ready meals. Cargill, Archer Daniels Midland, Kemin Industries, IFF, and Kalsec are major suppliers based in the region. Clean label demand is strong, and many brands are replacing synthetic preservatives with natural options. Canada and Mexico add demand from bakery, meat, and beverage producers. Key barriers include state additive bans. One change shaping the region is clean label reformulation.
Which Region Is Growing Fastest in the Food Preservatives Market?
Europe is growing fastest in the food preservatives market, expanding at a 5.3% CAGR through 2033, with a 27.6% share in 2025. Germany, France, the United Kingdom, Italy, Spain, and the Netherlands have strong processed meat, bakery, and dairy industries. Strict additive rules and strong consumer interest in natural ingredients push food makers toward fermentation-based and plant-based preservatives. Corbion, Kerry Group, dsm-firmenich, Galactic, and Jungbunzlauer are major suppliers with strong fermentation capacity. Key barriers include regulatory re-evaluations. One opportunity is natural meat and bakery preservation.
Asia Pacific Expands the Food Preservatives Market Through Packaged Food Growth
Asia Pacific held a 24.8% share in 2025 and is expanding at about 5.1% CAGR. China, India, Japan, Indonesia, South Korea, and Australia have growing packaged food, bakery, beverage, and noodle industries. Rising incomes, urbanization, and modern retail are expanding packaged food consumption. Local producers in China supply large volumes of sorbates and benzoates to domestic and export markets. Japan leads in natural preservatives such as polylysine and plant extracts. Hot, humid climates in India and Indonesia raise spoilage risk, supporting demand. Key barriers include price sensitivity. One change shaping the region is rising convenience food demand.
Latin America Grows the Food Preservatives Market Through Meat and Beverage Processing
Latin America is a growing food preservatives market. Brazil, Mexico, Argentina, Chile, and Colombia have large meat processing, bakery, and beverage industries, and Brazil is a major meat exporter. Packaged food sales are growing in cities, and supermarket chains are expanding their private label ranges of bread, sauces, and drinks. Meat exporters must meet strict food safety standards in importing countries, which supports preservative use. Cargill, Archer Daniels Midland, and Kerry Group run production and application sites in the region. Key barriers include price sensitivity and currency swings. One opportunity is meat export preservation.
Middle East & Africa Develops the Food Preservatives Market Through Food Imports and Processing
Middle East & Africa held a 6.1% share in 2025. Saudi Arabia, the United Arab Emirates, South Africa, Egypt, and Nigeria have growing packaged food and beverage industries, and hot climates increase spoilage risk. Governments in Saudi Arabia and the United Arab Emirates are investing in local food manufacturing to improve food security, creating new demand for preservatives. Halal certification is important for ingredients sold in the region. Growing bakery, dairy, and juice industries add volume. Key barriers include limited cold chains and price sensitivity. One change shaping the region is local food processing growth.
Competitive Landscape
The food preservatives market is moderately fragmented. Cargill, Archer Daniels Midland, Kerry Group, Corbion, and IFF are leading players, while BASF, dsm-firmenich, Kemin Industries, Tate & Lyle, Celanese, Eastman Chemical, and Galactic compete strongly. Many regional producers, especially in China and India, supply synthetic preservatives such as sorbates, benzoates, and propionates at low cost, while specialized firms such as Kalsec and Jungbunzlauer focus on natural ingredients.
Companies compete on efficacy, cost in use, label friendliness, regulatory approvals, application support, and supply reliability. Synthetic preservative producers compete mainly on price and scale, while natural solution suppliers compete on innovation, clean label claims, and technical support. Application labs that help bakers, meat processors, and beverage makers test and reformulate products are a key differentiator. Predictive shelf-life models, such as Corbion’s mold inhibition model, help customers choose solutions faster.
Strategic moves show how competition is changing. In April 2025, Corbion launched a cultured wheat mold inhibitor for bakers. In June 2025, dsm-firmenich launched fermentation-based natural preservation solutions. In October 2025, IFF expanded its natural food protection portfolio. In March 2026, Kemin Industries introduced a natural preservative for bakery and prepared foods.
Three themes shape vendor strategy. First, companies are expanding natural and fermentation-based portfolios. Second, they are investing in shelf-life prediction tools. Third, they are growing in Asia Pacific and Latin America, where packaged food demand is rising fastest. Acquisitions of smaller natural ingredient firms remain a common way to add technology.
Food Preservatives Market Industry Leaders
- Cargill
- Archer Daniels Midland
- Kerry Group
- Corbion
- IFF
Recent Industry Developments
- March 2026: Kemin Industries introduced a next-generation natural food preservative for bakery and prepared foods - expands natural food preservatives for clean label producers.
- October 2025: IFF expanded its natural food protection portfolio with new mold-inhibiting and shelf-life-extending ingredients - strengthens clean label preservatives offerings.
- June 2025: dsm-firmenich launched fermentation-based natural preservation solutions - adds options for brands replacing synthetic preservatives.
- April 2025: Corbion launched Verdad Essence WH100, a cultured wheat mold inhibitor for breads, buns, tortillas, and flatbreads, and upgraded its natural mold inhibition model - supports bakers moving away from artificial preservatives.
Companies Covered in the Report
- Cargill
- Archer Daniels Midland
- Kerry Group
- Corbion
- IFF
- BASF
- dsm-firmenich
- Kemin Industries
- Tate & Lyle
- Celanese
- Eastman Chemical
- Galactic
Food Preservatives Market Scope
This report covers the food preservatives market, including synthetic and natural preservatives with antimicrobial, antioxidant, and other functions, used in meat and poultry, bakery, dairy, beverages, snacks, sauces, and other foods, across conventional and clean label products. The base year is 2025, and the forecast period runs from 2026 to 2033. All values are expressed in US$ Billion.
Type
- Synthetic
- Natural
Function
- Antimicrobial
- Antioxidant
- Others
Application
- Meat and Poultry
- Bakery
- Dairy
- Beverages
- Snacks
- Sauces and Dressings
- Others
Label
- Conventional
- Clean Label
Regions
- North America
- Europe
- Asia Pacific
- Latin America
- Middle East & Africa
Key Questions Answered in the Report
How big is the food preservatives market in 2026?
The food preservatives market is valued at US$ 3.67 billion in 2026, led by synthetic preservatives and North America.
What is the food preservatives market forecast to 2033?
The market is projected to reach US$ 4.97 billion by 2033, growing at a 4.4% CAGR and adding US$ 1.30 billion.
Which type is growing fastest in the food preservatives market?
Natural preservatives are growing fastest at a 5.8% CAGR through 2033, driven by clean label demand and fermentation-based ingredient innovation.
Which region is growing fastest in the food preservatives market?
Europe is growing fastest at a 5.3% CAGR through 2033, driven by strict additive rules, clean label demand, and food waste policies.
Which application holds the largest food preservatives market share?
Meat and poultry holds the largest share at 29.4% in 2025, because processed meats need strong protection against dangerous bacteria.
1. Executive Summary
1.1. Global Food Preservatives Market Snapshot
1.2. Future Projections, 2026-2033
1.3. Key Market Trends
1.4. Regional Snapshot
2. Market Overview
2.1. Market Definition and Report Scope
2.2. Historical Market Trends, 2020-2025
2.3. Market Dynamics
2.3.1. Drivers Impact Analysis
2.3.1.1. Processed Food Consumption Is Driving the Food Preservatives Market
2.3.1.2. Food Waste Reduction Is Expanding the Food Preservatives Market
2.3.2. Restraints Impact Analysis
2.3.2.1. Consumer Concerns Slow the Food Preservatives Market
2.3.2.2. Strict Regulation Restricts the Food Preservatives Market
2.3.3. Market Opportunities
2.3.3.1. Fermentation-Based Natural Preservatives Open a Fast-Growth Revenue Pool
2.3.3.2. Plant Extract Antioxidants Create a Growth Revenue Pool
3. Global Food Preservatives Market Outlook, 2020-2033
3.1. Global Food Preservatives Market Outlook, by Type, Value (US$ Billion), 2020-2033
3.1.1. Synthetic
3.1.2. Natural
3.2. Global Food Preservatives Market Outlook, by Function, Value (US$ Billion), 2020-2033
3.2.1. Antimicrobial
3.2.2. Antioxidant
3.2.3. Others
3.3. Global Food Preservatives Market Outlook, by Application, Value (US$ Billion), 2020-2033
3.3.1. Meat and Poultry
3.3.2. Bakery
3.3.3. Dairy
3.3.4. Beverages
3.3.5. Snacks
3.3.6. Sauces and Dressings
3.3.7. Others
3.4. Global Food Preservatives Market Outlook, by Label, Value (US$ Billion), 2020-2033
3.4.1. Conventional
3.4.2. Clean Label
3.5. Global Food Preservatives Market Outlook, by Region, Value (US$ Billion), 2020-2033
3.5.1. North America
3.5.2. Europe
3.5.3. Asia Pacific
3.5.4. Latin America
3.5.5. Middle East & Africa
4. North America Food Preservatives Market Outlook, 2020-2033
4.1. North America Food Preservatives Market Outlook, by Type, Value (US$ Billion), 2020-2033
4.1.1. Synthetic
4.1.2. Natural
4.2. North America Food Preservatives Market Outlook, by Function, Value (US$ Billion), 2020-2033
4.2.1. Antimicrobial
4.2.2. Antioxidant
4.2.3. Others
4.3. North America Food Preservatives Market Outlook, by Application, Value (US$ Billion), 2020-2033
4.3.1. Meat and Poultry
4.3.2. Bakery
4.3.3. Dairy
4.3.4. Beverages
4.3.5. Snacks
4.3.6. Sauces and Dressings
4.3.7. Others
4.4. North America Food Preservatives Market Outlook, by Label, Value (US$ Billion), 2020-2033
4.4.1. Conventional
4.4.2. Clean Label
4.5. North America Food Preservatives Market Outlook, by Country, Value (US$ Billion), 2020-2033
4.5.1. United States Food Preservatives Market Outlook, by Type, 2020-2033
4.5.2. United States Food Preservatives Market Outlook, by Function, 2020-2033
4.5.3. United States Food Preservatives Market Outlook, by Application, 2020-2033
4.5.4. United States Food Preservatives Market Outlook, by Label, 2020-2033
4.5.5. Canada Food Preservatives Market Outlook, by Type, 2020-2033
4.5.6. Canada Food Preservatives Market Outlook, by Function, 2020-2033
4.5.7. Canada Food Preservatives Market Outlook, by Application, 2020-2033
4.5.8. Canada Food Preservatives Market Outlook, by Label, 2020-2033
4.5.9. Mexico Food Preservatives Market Outlook, by Type, 2020-2033
4.5.10. Mexico Food Preservatives Market Outlook, by Function, 2020-2033
4.5.11. Mexico Food Preservatives Market Outlook, by Application, 2020-2033
4.5.12. Mexico Food Preservatives Market Outlook, by Label, 2020-2033
5. Europe Food Preservatives Market Outlook, 2020-2033
5.1. Europe Food Preservatives Market Outlook, by Type, Value (US$ Billion), 2020-2033
5.1.1. Synthetic
5.1.2. Natural
5.2. Europe Food Preservatives Market Outlook, by Function, Value (US$ Billion), 2020-2033
5.2.1. Antimicrobial
5.2.2. Antioxidant
5.2.3. Others
5.3. Europe Food Preservatives Market Outlook, by Application, Value (US$ Billion), 2020-2033
5.3.1. Meat and Poultry
5.3.2. Bakery
5.3.3. Dairy
5.3.4. Beverages
5.3.5. Snacks
5.3.6. Sauces and Dressings
5.3.7. Others
5.4. Europe Food Preservatives Market Outlook, by Label, Value (US$ Billion), 2020-2033
5.4.1. Conventional
5.4.2. Clean Label
5.5. Europe Food Preservatives Market Outlook, by Country, Value (US$ Billion), 2020-2033
5.5.1. Germany Food Preservatives Market Outlook, by Type, 2020-2033
5.5.2. Germany Food Preservatives Market Outlook, by Function, 2020-2033
5.5.3. Germany Food Preservatives Market Outlook, by Application, 2020-2033
5.5.4. Germany Food Preservatives Market Outlook, by Label, 2020-2033
5.5.5. France Food Preservatives Market Outlook, by Type, 2020-2033
5.5.6. France Food Preservatives Market Outlook, by Function, 2020-2033
5.5.7. France Food Preservatives Market Outlook, by Application, 2020-2033
5.5.8. France Food Preservatives Market Outlook, by Label, 2020-2033
5.5.9. United Kingdom Food Preservatives Market Outlook, by Type, 2020-2033
5.5.10. United Kingdom Food Preservatives Market Outlook, by Function, 2020-2033
5.5.11. United Kingdom Food Preservatives Market Outlook, by Application, 2020-2033
5.5.12. United Kingdom Food Preservatives Market Outlook, by Label, 2020-2033
5.5.13. Italy Food Preservatives Market Outlook, by Type, 2020-2033
5.5.14. Italy Food Preservatives Market Outlook, by Function, 2020-2033
5.5.15. Italy Food Preservatives Market Outlook, by Application, 2020-2033
5.5.16. Italy Food Preservatives Market Outlook, by Label, 2020-2033
5.5.17. Spain Food Preservatives Market Outlook, by Type, 2020-2033
5.5.18. Spain Food Preservatives Market Outlook, by Function, 2020-2033
5.5.19. Spain Food Preservatives Market Outlook, by Application, 2020-2033
5.5.20. Spain Food Preservatives Market Outlook, by Label, 2020-2033
5.5.21. Netherlands Food Preservatives Market Outlook, by Type, 2020-2033
5.5.22. Netherlands Food Preservatives Market Outlook, by Function, 2020-2033
5.5.23. Netherlands Food Preservatives Market Outlook, by Application, 2020-2033
5.5.24. Netherlands Food Preservatives Market Outlook, by Label, 2020-2033
6. Asia Pacific Food Preservatives Market Outlook, 2020-2033
6.1. Asia Pacific Food Preservatives Market Outlook, by Type, Value (US$ Billion), 2020-2033
6.1.1. Synthetic
6.1.2. Natural
6.2. Asia Pacific Food Preservatives Market Outlook, by Function, Value (US$ Billion), 2020-2033
6.2.1. Antimicrobial
6.2.2. Antioxidant
6.2.3. Others
6.3. Asia Pacific Food Preservatives Market Outlook, by Application, Value (US$ Billion), 2020-2033
6.3.1. Meat and Poultry
6.3.2. Bakery
6.3.3. Dairy
6.3.4. Beverages
6.3.5. Snacks
6.3.6. Sauces and Dressings
6.3.7. Others
6.4. Asia Pacific Food Preservatives Market Outlook, by Label, Value (US$ Billion), 2020-2033
6.4.1. Conventional
6.4.2. Clean Label
6.5. Asia Pacific Food Preservatives Market Outlook, by Country, Value (US$ Billion), 2020-2033
6.5.1. China Food Preservatives Market Outlook, by Type, 2020-2033
6.5.2. China Food Preservatives Market Outlook, by Function, 2020-2033
6.5.3. China Food Preservatives Market Outlook, by Application, 2020-2033
6.5.4. China Food Preservatives Market Outlook, by Label, 2020-2033
6.5.5. India Food Preservatives Market Outlook, by Type, 2020-2033
6.5.6. India Food Preservatives Market Outlook, by Function, 2020-2033
6.5.7. India Food Preservatives Market Outlook, by Application, 2020-2033
6.5.8. India Food Preservatives Market Outlook, by Label, 2020-2033
6.5.9. Japan Food Preservatives Market Outlook, by Type, 2020-2033
6.5.10. Japan Food Preservatives Market Outlook, by Function, 2020-2033
6.5.11. Japan Food Preservatives Market Outlook, by Application, 2020-2033
6.5.12. Japan Food Preservatives Market Outlook, by Label, 2020-2033
6.5.13. Indonesia Food Preservatives Market Outlook, by Type, 2020-2033
6.5.14. Indonesia Food Preservatives Market Outlook, by Function, 2020-2033
6.5.15. Indonesia Food Preservatives Market Outlook, by Application, 2020-2033
6.5.16. Indonesia Food Preservatives Market Outlook, by Label, 2020-2033
6.5.17. South Korea Food Preservatives Market Outlook, by Type, 2020-2033
6.5.18. South Korea Food Preservatives Market Outlook, by Function, 2020-2033
6.5.19. South Korea Food Preservatives Market Outlook, by Application, 2020-2033
6.5.20. South Korea Food Preservatives Market Outlook, by Label, 2020-2033
6.5.21. Australia Food Preservatives Market Outlook, by Type, 2020-2033
6.5.22. Australia Food Preservatives Market Outlook, by Function, 2020-2033
6.5.23. Australia Food Preservatives Market Outlook, by Application, 2020-2033
6.5.24. Australia Food Preservatives Market Outlook, by Label, 2020-2033
7. Latin America Food Preservatives Market Outlook, 2020-2033
7.1. Latin America Food Preservatives Market Outlook, by Type, Value (US$ Billion), 2020-2033
7.1.1. Synthetic
7.1.2. Natural
7.2. Latin America Food Preservatives Market Outlook, by Function, Value (US$ Billion), 2020-2033
7.2.1. Antimicrobial
7.2.2. Antioxidant
7.2.3. Others
7.3. Latin America Food Preservatives Market Outlook, by Application, Value (US$ Billion), 2020-2033
7.3.1. Meat and Poultry
7.3.2. Bakery
7.3.3. Dairy
7.3.4. Beverages
7.3.5. Snacks
7.3.6. Sauces and Dressings
7.3.7. Others
7.4. Latin America Food Preservatives Market Outlook, by Label, Value (US$ Billion), 2020-2033
7.4.1. Conventional
7.4.2. Clean Label
7.5. Latin America Food Preservatives Market Outlook, by Country, Value (US$ Billion), 2020-2033
7.5.1. Brazil Food Preservatives Market Outlook, by Type, 2020-2033
7.5.2. Brazil Food Preservatives Market Outlook, by Function, 2020-2033
7.5.3. Brazil Food Preservatives Market Outlook, by Application, 2020-2033
7.5.4. Brazil Food Preservatives Market Outlook, by Label, 2020-2033
7.5.5. Mexico Food Preservatives Market Outlook, by Type, 2020-2033
7.5.6. Mexico Food Preservatives Market Outlook, by Function, 2020-2033
7.5.7. Mexico Food Preservatives Market Outlook, by Application, 2020-2033
7.5.8. Mexico Food Preservatives Market Outlook, by Label, 2020-2033
7.5.9. Argentina Food Preservatives Market Outlook, by Type, 2020-2033
7.5.10. Argentina Food Preservatives Market Outlook, by Function, 2020-2033
7.5.11. Argentina Food Preservatives Market Outlook, by Application, 2020-2033
7.5.12. Argentina Food Preservatives Market Outlook, by Label, 2020-2033
7.5.13. Chile Food Preservatives Market Outlook, by Type, 2020-2033
7.5.14. Chile Food Preservatives Market Outlook, by Function, 2020-2033
7.5.15. Chile Food Preservatives Market Outlook, by Application, 2020-2033
7.5.16. Chile Food Preservatives Market Outlook, by Label, 2020-2033
7.5.17. Colombia Food Preservatives Market Outlook, by Type, 2020-2033
7.5.18. Colombia Food Preservatives Market Outlook, by Function, 2020-2033
7.5.19. Colombia Food Preservatives Market Outlook, by Application, 2020-2033
7.5.20. Colombia Food Preservatives Market Outlook, by Label, 2020-2033
8. Middle East & Africa Food Preservatives Market Outlook, 2020-2033
8.1. Middle East & Africa Food Preservatives Market Outlook, by Type, Value (US$ Billion), 2020-2033
8.1.1. Synthetic
8.1.2. Natural
8.2. Middle East & Africa Food Preservatives Market Outlook, by Function, Value (US$ Billion), 2020-2033
8.2.1. Antimicrobial
8.2.2. Antioxidant
8.2.3. Others
8.3. Middle East & Africa Food Preservatives Market Outlook, by Application, Value (US$ Billion), 2020-2033
8.3.1. Meat and Poultry
8.3.2. Bakery
8.3.3. Dairy
8.3.4. Beverages
8.3.5. Snacks
8.3.6. Sauces and Dressings
8.3.7. Others
8.4. Middle East & Africa Food Preservatives Market Outlook, by Label, Value (US$ Billion), 2020-2033
8.4.1. Conventional
8.4.2. Clean Label
8.5. Middle East & Africa Food Preservatives Market Outlook, by Country, Value (US$ Billion), 2020-2033
8.5.1. Saudi Arabia Food Preservatives Market Outlook, by Type, 2020-2033
8.5.2. Saudi Arabia Food Preservatives Market Outlook, by Function, 2020-2033
8.5.3. Saudi Arabia Food Preservatives Market Outlook, by Application, 2020-2033
8.5.4. Saudi Arabia Food Preservatives Market Outlook, by Label, 2020-2033
8.5.5. United Arab Emirates Food Preservatives Market Outlook, by Type, 2020-2033
8.5.6. United Arab Emirates Food Preservatives Market Outlook, by Function, 2020-2033
8.5.7. United Arab Emirates Food Preservatives Market Outlook, by Application, 2020-2033
8.5.8. United Arab Emirates Food Preservatives Market Outlook, by Label, 2020-2033
8.5.9. South Africa Food Preservatives Market Outlook, by Type, 2020-2033
8.5.10. South Africa Food Preservatives Market Outlook, by Function, 2020-2033
8.5.11. South Africa Food Preservatives Market Outlook, by Application, 2020-2033
8.5.12. South Africa Food Preservatives Market Outlook, by Label, 2020-2033
8.5.13. Egypt Food Preservatives Market Outlook, by Type, 2020-2033
8.5.14. Egypt Food Preservatives Market Outlook, by Function, 2020-2033
8.5.15. Egypt Food Preservatives Market Outlook, by Application, 2020-2033
8.5.16. Egypt Food Preservatives Market Outlook, by Label, 2020-2033
8.5.17. Nigeria Food Preservatives Market Outlook, by Type, 2020-2033
8.5.18. Nigeria Food Preservatives Market Outlook, by Function, 2020-2033
8.5.19. Nigeria Food Preservatives Market Outlook, by Application, 2020-2033
8.5.20. Nigeria Food Preservatives Market Outlook, by Label, 2020-2033
9. Competitive Landscape
9.1. Market Concentration and Industry Leaders
9.2. Competitive Differentiation
9.3. Strategic Initiatives
9.4. Recent Industry Developments
9.5. Company Profiles
9.5.1. Cargill
9.5.2. Archer Daniels Midland
9.5.3. Kerry Group
9.5.4. Corbion
9.5.5. IFF
9.5.6. BASF
9.5.7. dsm-firmenich
9.5.8. Kemin Industries
9.5.9. Tate & Lyle
9.5.10. Celanese
9.5.11. Eastman Chemical
9.5.12. Galactic
10. Appendix
10.1. Research Methodology
10.2. Report Assumptions
10.3. Acronyms and Abbreviations
| Type | Synthetic, Natural |
| Function | Antimicrobial, Antioxidant, Others |
| Application | Meat and Poultry, Bakery, Dairy, Beverages, Snacks, Sauces and Dressings, Others |
| Label | Conventional, Clean Label |
| Regions | North America, Europe, Asia Pacific, Latin America, Middle East & Africa |
Our Research Methodology
Considering the volatility of business today, traditional approaches to strategizing a game plan can be unfruitful if not detrimental. True ambiguity is no way to determine a forecast. A myriad of predetermined factors must be accounted for such as the degree of risk involved, the magnitude of circumstances, as well as conditions or consequences that are not known or unpredictable. To circumvent binary views that cast uncertainty, the application of market research intelligence to strategically posture, move, and enable actionable outcomes is necessary.
View Methodology
Quality Assured
Rigorous Validation Process

Confidentiality Assured
End-to-end Data Security

Custom Research Services
Tailored To Your Objectives
FAQs
The food preservatives market is valued at US$ 3.67 billion in 2026, led by synthetic preservatives and North America.
The market is projected to reach US$ 4.97 billion by 2033, growing at a 4.4% CAGR and adding US$ 1.30 billion.
Natural preservatives are growing fastest at a 5.8% CAGR through 2033, driven by clean label demand and fermentation-based ingredient innovation.
Europe is growing fastest at a 5.3% CAGR through 2033, driven by strict additive rules, clean label demand, and food waste policies.
Meat and poultry holds the largest share at 29.4% in 2025, because processed meats need strong protection against dangerous bacteria.
Related Reports
Kombucha Market Size, Share, Insights, Competitive Landscape, and Forecast 2026 to 2033
The Kombucha Market is projected to grow from US$ 3.2 billion in 2026 to US$ 4.8 billion by 2033 at a 6.0% CAGR. Explore trends and leading segments.
Insect Protein Market Size, Share, Insights, Competitive Landscape, and Forecast 2026 to 2033
Insect Protein Market is projected to grow from US$ 1.03 billion in 2026 to US$ 3.17 billion by 2033 at a 17.4% CAGR. Explore trends and key segments.
Functional Mushroom Market Size, Share, Insights, Competitive Landscape, and Forecast 2026 to 2033
Explore the Functional Mushroom Market, projected to grow from US$ 2.6 billion in 2026 to US$ 4.4 billion by 2033 at a 7.8% CAGR. See trends and segments.
Beeswax Market Size, Share, Insights, Competitive Landscape, and Forecast 2026 to 2033
The beeswax market is valued at US$ 0.7 billion in 2026 and projected to reach US$ 1.0 billion by 2033 at a CAGR of 5.2%.
Adaptogens Market Size, Share, Insights, Competitive Landscape, and Forecast 2026 to 2033
The adaptogens market is valued at US$ 17.09 billion in 2026 and projected to reach US$ 29.08 billion by 2033, growing at a CAGR of 7.9%.
Spearmint Oil Market Size, Share, Insights, Competitive Landscape, and Forecast 2026 to 2033
The global spearmint oil market is valued at US$0.4 billion in 2026, reaching US$0.6 billion by 2033, growing at a 6.0% CAGR